
Stocks & Equities
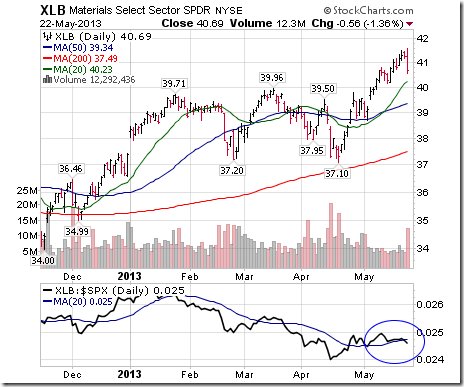
The intermediate corrective phase in North American equity markets remains intact. Short term strength provides an opportunity to reduce equity exposure, particularly in sectors that have a history of moving lower during a summer corrective phase. These sectors included industrials, consumer discretionary, materials and financials.
Selected sectors are setting up for seasonal trades this summer including fertilizers, energy and gold. They already are showing signs of outperformance relative to the S&P 500 Index and the TSX Composite Index. Stay tuned for special sector opportunities as the summer progresses.
Equity Trends
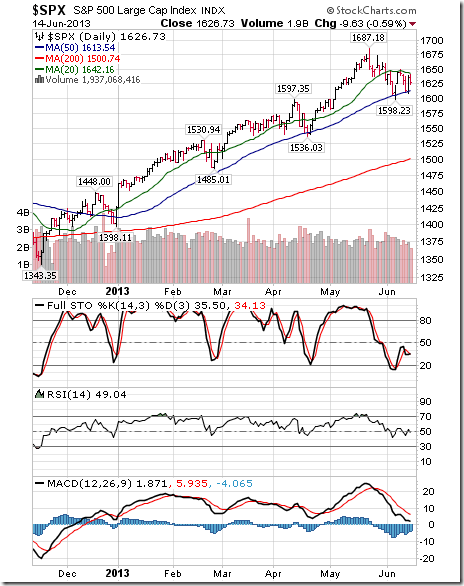
The S&P 500 Index fell 16.65 points (1.01%) last week. Trend remains up. Resistance is at its May 22nd high at 1,687.18. Support is at 1,598.23. The Index remains below its 20 day moving average, but bounced once again from near its 50 day moving average. Short term momentum indicators have declined to neutral levels.
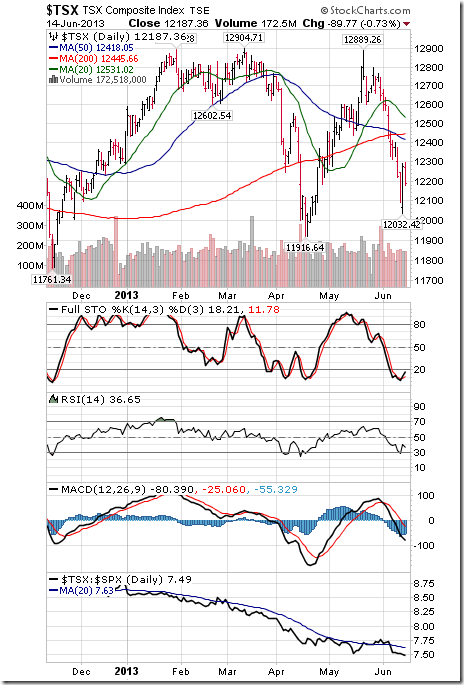
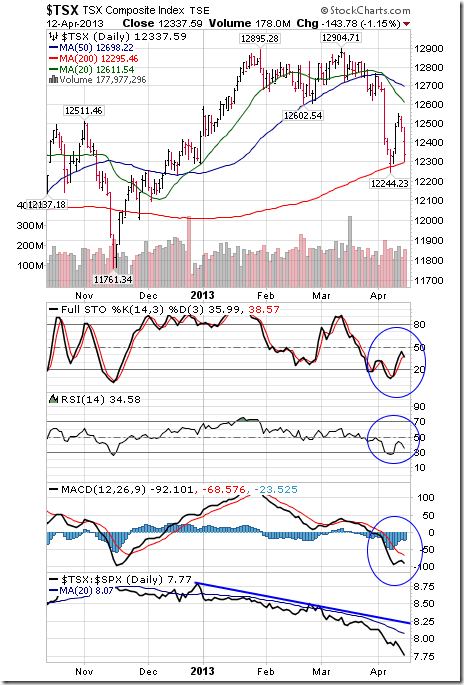
The TSX Composite Index fell 185.94 points (1.50%) last week. Trend remains down. The Index remains below its 20 day moving average and completed a “Death Cross” when its 50 day moving average fell below its 200 day moving average. Tech Talk is not a believer in the Death Cross indicators, but other technical analysts are talking about it. Strength relative to the S&P 500 Index changed from neutral to negative. Technical score based on the above indicators changed from 0.5 to 0.0 out of 3.0. Short term momentum indicators are oversold, but have yet to show signs of bottoming.
Percent of S&P 500 stocks trading above their 50 day moving average fell last week to 59.60% from 67.80%. Percent remains in a downtrend from an intermediate overbought level.
Percent of S&P 500 stock trading above their 200 day moving average slipped last week to 88.20% from 90.60%. Percent remains in a downtrend from an intermediate overbought level.
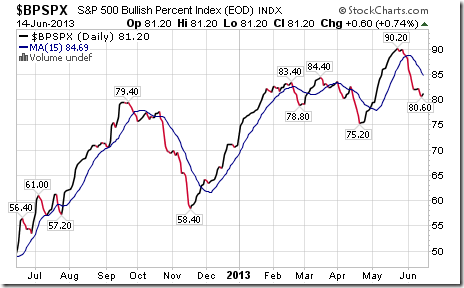
Bullish Percent Index for S&P 500 stocks slipped last week to 81.20% from 82.00% and remained below its 15 day moving average. The Index continues to trend down from an intermediate overbought level.
Bullish Percent Index for TSX Composite stocks fell last week to 59.41% from 62.76% and dropped below its 15 day moving average. The Index has resumed an intermediate downtrend.
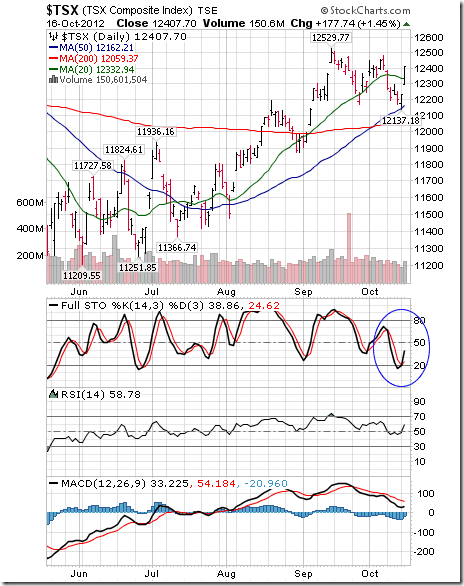
Percent of TSX stocks trading above their 50 day moving average fell last week to 31.80% after briefly reaching a low of 24.69%. Historic data shows that the TSX Composite Index frequently bottoms on a recovery by Percent from below the 25% level.
Percent of TSX stocks trading above their 200 day moving average fell last week to 42.68% from 46.86%. Percent continues in an intermediate downtrend.
……read so much more HERE including 44 more charts.

The most frequently asked question I seem to get, no matter the time period, is “Larry, don’t you see hyperinflation for the U.S. in the years ahead?”
So let me clarify my position, here and now. There was a time when I expected the U.S. economy would eventually experience hyperinflation.
But 21 months ago, when the price of gold failed to react to the Fed’s QE III announcement of virtually unlimited money-printing and the yellow metal entered an interim bear market, I knew something had radically changed.
So I further researched the known periods of hyperinflation in the world. And I found something that completely changed my view: There has never been a major core economy that has died at the hands of hyperinflation.
There was the Weimar Republic, of course, but it was not a core economy for the world. There are the hyperinflations of Zimbabwe, Brazil, Argentina and countless other small economies that were never at the core of the global economy.
And upon further study, I found that even the Roman Empire, certainly a core economy during its reign, didn’t even die of hyperinflation.
It died largely because of abuse of power by politicians, which drove citizens away from the Empire; by rapidly rising taxation, which had the same effect; and by a corrupt Treasury and justice system that tracked down and confiscated citizens’ wealth, largely to fund increased military campaigns, which were hoped to revive the Roman economy. Sound familiar?
Was there high inflation in Rome before it fell? Yes, but nothing of the sort of hyperinflation like we subsequently saw in Weimar Germany or any of the countries I mention above.
So, then, what does the U.S. economy face? Further disinflation, eventual reflation or something else?
My view, and I am not hedging my answer or talking out of both sides of my mouth: We face a combination of further disinflation in the short-term, followed by a rather large jump in inflation a few months from now and heading into the future for at least three years.
How high will inflation eventually go? Hard to say, but I wouldn’t be surprised if, say, three years from now, we see 20% or even 25% inflation.
But I highly doubt we will ever see inflation in the thousands or even millions of percent. It’s just not possible in a core economy. For many different reasons.
Whether we have deflation or inflation is also the wrong way to think about the U.S. economy these days. The reason? Ever since we abandoned the gold standard, inflation and deflation have become two sides of the same coin.
In other words, they are both present in the economy at the same time. You can have certain goods and services and even asset classes deflating, while others are inflating. It’s as simple as that.
For instance, the price of LED TVs has crashed in the past year or so, as have the prices of laptop computers and many other goods. Not to mention real estate prices since their peak in 2007.
Meanwhile, other items have experienced inflation. Food prices, legal and health-care services, and more.
So it’s not a matter of one or the other, it’s a matter of what sector is inflating and why, versus which sectors are deflating and why.
Nevertheless, there’s another important underlying force that you need to understand, another one that resulted from the abolishment of the gold standard.
A certain level of general, system-wide inflation is always baked into the cake. It’s due, again, to the fact that we no longer have a gold standard, but it’s also due to many other forces, such as population growth, limited availability of natural resources, the constant desire for people to improve their lives and more.
 And it’s also why investing in gold ? just after it experiences a short-term disinflationary trend ? is an ideal strategy to jump on.This is important to understand, because it’s the chief reason prices will be higher a year from now, five years from now and even 10 years from now … no matter what the U.S. or global economy does.
For instance, $5,000 in cash squirreled away in a bank in 1913, when the Federal Reserve was created, is now worth only 4.37 cents. That’s right: 4.37 cents.
Put another way, it would take $114,396.56 of today’s money to buy what $5,000 would have bought in 1913.
Want more recent examples? Consider the following …
It now takes $6,210.11 to buy what $5,000 bought just 10 years ago … $29,161.44 to buy what $5,000 bought in 1970 … $47,047.46 to buy what $5,000 bought in 1950.
Even a McDonald’s Big Mac, which cost a mere 57 cents in 1959, now costs about $4.37, an increase of 665%, for an average annual increase of just over 12% per year.
Now let’s look at gold. Even though we had a general level of price inflation from 1980 on, as we always do, the price of gold plunged from a high of $850 in 1980 to a low of $255 in 2000.
In other words, it deflated as the stock market inflated wildly during that time.
And, now, gold has some catching up to do. Just to regain its 1980 high, it needs to shoot to $2,331.75. And it most assuredly will.
Keep in mind the above figures are based on the government’s conservative, politically manipulated Consumer Price Index. As we all know, it vastly understates inflation.
The bottom line: There are several.
First, yes, we have, and pretty much always will have, a base level of inflation in our economy. It’s the natural state of things.
Second, inflation will at some point in the future move even higher. But don’t expect hyperinflation.
Third, and perhaps most importantly, gold does not need any further inflation to move higher. It’s undervalued right now. And it will probably fall even a bit further.
That’s how markets work. They go from overbought and overvalued, to underbought and undervalued.
Thing is, the more undervalued an asset becomes, the greater the profit potential. That’s precisely why I am more interested in gold now than I’ve been since my initial “buy” signal way back in 2000. The profit potential is simply enormous.
Best wishes,
Larry
– See more at: http://www.swingtradingdaily.com/2013/06/17/the-truth-about-inflation/#sthash.POVscBdf.dpuf

 The traditional meme of
 risk sellers financial advisers is to recommend that clients hold a higher component of their savings in stocks and stock mutual funds in order to sustain desired income withdrawals through retirement. In fact this math is not sound: in reality the price that we pay for securities purchased dictates everything about the sustainability of the capital and the long-term income it is able to yield.
The time to sober up is before more capital losses hit.
Read Danielle’s the whole comment HERE


……and what Bond King Bill Gross is Buying Now..
Rising star of the independent investment commentators Mike Swanson explains why he has just been buying gold and silver stocks. It’s a contrarian view with a recovery from the lows of the recent crash in gold and silver prices. Undervalued sectors offer the best investment opportunities, not chasing momentum.
The real risk out there for investors is the bubble building in US stocks, think Nasdaq crash in 2000, not missing the US economic ‘recovery’ that is about to tank. How will gold and silver stocks fare in a crash? Well they simply do not have anything like the downside of other stocks right now, and if gold comes back as a defender against monetary inflation then the shares will deliver a multiple to the upside of the gold price, and silver will do much better…
….readd more great articles at Arabianmoney.net:
 WHAT IS BOND KING BILL GROSS BUYING NOW
Co-chief investment officer of Pimco, one of the world’s largest investment funds, Bill Gross is widely watched both for what he says and does.
MD Sass Associates Chairman and CEO Martin Sass discusses bonds with Adam Johnson on Bloomberg Television’s ‘Lunch Money’…
……go to this page to view interview
ONE MORE RALLY FOR BONDS THIS SUMMER AS EQUITIES TAKE A VERTICAL PLUNGE?
The recent volatility in the Japanese stock market and red lights showing an economic slowdown in China are the harbinger of a much bigger crash coming soon in global equity markets and a last rally…
.…….read more HERE

-
I know Mike is a very solid investor and respect his opinions very much. So if he says pay attention to this or that - I will.
~ Dale G.
-
I've started managing my own investments so view Michael's site as a one-stop shop from which to get information and perspectives.
~ Dave E.
-
Michael offers easy reading, honest, common sense information that anyone can use in a practical manner.
~ der_al.
-
A sane voice in a scrambled investment world.
~ Ed R.
Inside Edge Pro Contributors

Greg Weldon

Josef Schachter

Tyler Bollhorn

Ryan Irvine

Paul Beattie

Martin Straith

Patrick Ceresna

Mark Leibovit

James Thorne

Victor Adair