
Gold & Precious Metals

While ending lower in today’s session due to a drop in shares of gold and energy producers, the U.S. Federal Reserve’s support for monetary stimulus helped Toronto’s main index post its biggest weekly gain in more than seven months.
The S&P TSX Composite index eased Friday after recording gains in the previous four sessions and hitting a one-month high earlier in the day. All told, the index ended the week up a very healthy 2.7%.
Also driving Toronto forward was the price of crude oil as WTI rose to near US$106 a barrel Friday, supported by continuing tensions in Egypt and a sharp drop of U.S. crude stockpiles.
Benchmark crude oil for August delivery gained $1.04 to $105.95 a barrel on the New York Mercantile Exchange. Despite the Thursday’s pullback of $1.60 a barrel, the price of oil rose $2.73 this week and is up nearly 10% this month alone.
Oil has risen from around $97 on July 1, mainly for a couple of reasons. Traders are concerned that unrest in Egypt could affect oil shipments through the Suez Canal, a key shipping lane. And U.S. supplies of oil and gasoline have dropped dramatically in the past two weeks, signaling a rise in demand in the world’s largest economy. Throw in some decent signals in regards to a continuing (but modest) U.S. recovery and you have a recipe for strong crude prices.
Brent crude gained $1.08 to $108.81 on the ICE Futures exchange in London. The spread between WTI and Brent oil pricing has narrowed considerable this year, particularly in the past month.
The improvement in North American oil pricing should help benefit a number of Canadian/U.S. service companies in the second half of 2013. The sector faced a number of headwinds at the start of 2013 including reduced E&P capital budgets and a wet Q2.
Bernanke’s Balloons
Federal Reserve Chairman Ben Bernanke said on Wednesday that the U.S. central bank must keep a stimulative monetary policy in place due to weak inflation levels and a high unemployment rate.
It may seem counterintuitive that comments that imply a feeble economy should spark a rally, but that is just the reality (short-term thinking) that we are dealing with today. Those comments sparked a rally in global equity markets and caused a 1.5% jump in Toronto stocks on Thursday.
What it appears Bernanke is trying to do by floating trial balloons and then backpedaling is making sure the slow decrease in stimulative monetary policy is an orderly process and not a crash. He is essentially saying not to confuse us taking the foot off the gas pedal with putting the foot on the brake.
But three weeks prior, Mr. Bernanke’s comments had the opposite effect. On June 19, he rattled Wall Street with words that investors translated as “the end is near” for that economic stimulus. Specifically, he laid out a more elaborate plan for reducing the pace of the Fed’s asset purchases or in stimulative monetary policy.
Welcome to the new, more transparent Federal Reserve – and to the challenge of describing a policy outlook that’s both murky and not very easy to digest.
The problem with this more “transparent” Fed is an affliction we write about on a daily basis. There are those in the market that have become entirely short-sighted. All breeds of short-term traders prey on this type of information to help them create the volatility they need to survive. With this volatility, they prey on weak hands or inexperienced investors who panic and sell or buy at inopportune times with short-term outlooks.
The way to rise above this is simple. Forget the day-to-day noise of “trading.” Pick a basket of great cash flowing companies and “invest” in them with a 1-5 year time horizon.
Keep it simple my friends – this is the key to long-term market success.
 Exclusive Money Talks Radio Offers
……..Read More
KeyStone’s Latest Reports Section

Dow Jones surges to a new all time closing high of 15,460.92 as many market commentators literally never learn! And there is a reason for this.
Bull markets do one thing, and one thing only, they resolve to NEW bull market highs, as that is what ultimately defines what a bull market is, and so the market that I have traded for near 30 years, the DJIA stock index has once more resolved to a new bull market ALL Time High.
My expectations at the time of the May rally were to reduce stock market exposure ahead of a correction to once more accumulate into – 22 May 2013 – Dow, FTSE, Stock Market Panic, Euphoria, Irrational Rally Continues, What I am Doing
Ed Note: More analysis and charts like this interesting one below HERE
……read more HERE

 Over the past 3 or 4 years I have watched with keen interest (and participated) in the ups and downs of the American and Canadian real-estate markets. Recently published stats have fueled a bit of media frenzy which has become an interesting study in conflicting market noise.
In the Canadian market there are those pointing to sustained or increased property values and a market that is bloated with high unaffordable prices ripe for a correction and the other side that says sales are sustaining and even growing and we are and there should be no correction on the horizon.
The
Bull
Case Shiller composite index of 20 metropolitan areas climbed 10.9 percent year over year, beating expectations for 10.2 percent.
Institutions like the Blackstone Group have spent more than $4billon for 24k homes in the U.S housing market that it plans on renting out.
A recent analyst forestry report cited housing starts that are 29% above year ago level and inventories of new homes for sale near 50yr lows and is predicting a cumulative housing deficit of 2.8M units in 2014
Last year, Realogy Holdings Corp who is a franchisor of six of the most recognized brands in the real estate industry:, CENTURY 21®, Coldwell Banker®, Sotheby’s International Realty® etc. (NYSE:RLGY) had revenue of $4.7 billion and a gross profit of $1.0 billion. In the first quarter of this year compared to last year and EBITDA was up 34%.
The Keller Group, an engineering specialist, has reported a near doubling of full-year profits as it benefited from an improvement in the
Bear
The Federal Reserve housing affordability index has declined 13% since the beginning of the year. And about 22 million Americans may lack enough home equity to move, keeping property listings tight and limiting sales as the housing market recovers.
Shadow inventory John Burns Real Estate Consulting, estimates approx. 10.0M housing units have negative equity and an estimated 53% are keeping their mortgage payment current,
Lender prosessing services reports in May 2013 over 9% of outstanding mortgages in the us were either delinquent or in forclosure.
According to the Campbell/Inside Mortgage Finance Housing Pulse Tracking Survey, the average American Joe isn’t participating in the
A recent IPO filing of American Homes 4 Rent provided some interesting information on the market: total
Some companies are hedging both sides of the market a recent IPO American Residential Properties (NYSE:
Which to believe?
My view based on these stats is that these is still the start of a long recovery…..If you have a longer time horizon of 5 – 10 years then enter at any time. If you want to try and time the market then there “may” be a short-term pullback over the next 3 – 12 months, but trying to time the bottom and the extent of a pullback is risky and one could miss the opportunity altogether. Do your research and know your marker….not just compared to other home or real estate in that area, but also the macro trends that creates an environment where the market you invest in should outpace the greater real estate market.
Chad Wasilenkoff is the CEO of Fortress Paper and a regular contributor to MoneyTalks
Signs Of The Times
“We don’t have time for a meeting of the Flat Earth Society.”
– Barack Obama, June 24
Well, anyone who is not on Planet Liberal is a “Flat-Earther”.
On any issue.
Anyhow, he was mocking the growing number of folk who are skeptical of the theories about Anthropogenic Global Warming. And his timing was remarkable. Made the declaration when a huge high-pressure area drove temps up on the Western side of North America.
The chart of the Sunspot number remains low as the unusually weak Solar Cycle 24 peaks. This following link provides a review of Livingstone and Penn’s work on diminishing solar activity.
http://cbdakota.wordpress.com/2012/01/28/forecasting-cycle-25-livingston-and-penn-method/
Probably his next grandiose scheme will be to re-unite the Continental Divide.
FRIDAY, JULY 12, 2013
BOB HOYE PUBLISHED BY INSTITUTIONAL ADVISORS
The following is part of Pivotal Events that was published for our subscribers July 4, 2013.
“Gold’s price carnage threatens small mines ‘In A Dire Condition’.”
– Financial Post, June 27
“Forget Gold Altogether”
– BNN, June 27
“Gold Bears Eye Fall Towards $1,000 Level”
– Financial Times, June 28
“A record amount of money poured out of exchange-traded and mutual bond funds in June. Nearly double the amount at the height of the financial crisis in October 2008.”
– TrimTabs, July 2′
Perspective
One can’t help but note that comments on gold are virtually opposite to those on lower- grade bond markets in April. Ironically, both conditions have something to do with ambitious government. The first has been critical in helping fund the experiment in unlimited government. The second with gold providing independent adjudication of extreme policymaking.
The key is extreme policymaking and extreme swings in bonds and stocks on the upside and precious metals on the downside. Financials, including Utility stocks, reached measurable excesses in April.
As noted, this was an outstanding set up for a dramatic reversal in May.
This also set up an important philosophical issue. Was the bond crash due to Bernanke’s mutterings about “tapering” the bond-buying program?
Or was it the natural consequence of excessive speculation going into another fateful May? It worked for us in the summer of 1998 as well.
Our view as our indicators soared in April was that “Mother Nature would preempt the Fed’s decision”. This has been the case and the Fed’s only option has been a flimsy attempt to look “in charge” during a bond crash that, by one measure, was worse than the 2008 example.
Interventionist policymaking truly is the theatre of the absurd.
Stock Markets
The big Rounding Top is still on.
The high for the S&P was 1687 set on May 22nd and there has been descending highs and lows since. The panic in bondland got overdone a couple of weeks ago and the overall relief has popped the S&P to the 1626 level. The previous high was 1654, and the June low was 1560.
Generally markets could be somewhat positive into July and the S&P could trade above the 1654 level. Breaking below 1560 is probable and would be important. It would formally mark the end of the cyclical bull market that began as the crash ended in March 2009.
It is worth emphasizing that corporate management and earnings reports, central banks and their cheerleaders are all subject to market forces. The May convulsion is another reminder that credit spreads and the yield curve force change in the stock markets, and once again history has shown that at crunch time the Fed has little influence on spreads and the curve.
Continue to sell the rallies.
Commodities
Crude oil jumped to 102 on yesterday’s “Coupe” in Egypt. This did not break to the Upside on the “Big Triangle” chart. Independent of this, Ross has a chart that has been looking for a high in first part of July.
Important gains in oil reserves and increases in production due to fracking will continue. Other than lowering the real costs of petroleum products it will reduce the premium of Middle East Risk. Diminishing revenue will reduce the ability of Islamists to spread their version of radical utopianism.
In the Western World it will also reduce the ability of governments to impose their versions of radical utopianism. Wind turbines and solar panels–anything but something provided by evil oil companies has been a mania. Not to overlook the mania against nuclear power.
Technically, the remarkable zoom to 147 in 2008 registered a Weekly Upside Exhaustion in the third week of that fateful June. We noted that it indicated the possibility of a cyclical bear. Also noted was that if the action continued to the end of the month and registered on the Monthly it would indicate a secular bull market had completed and a secular bear would follow. The spike ended at 147 on July 11.
The slump into the April low touched 30 on the Daily RSI. The rally could top in the first part of this month and the last two weeks has been outstanding. The RSI is up to 68 and perhaps 70 would end it.
The latest rally has been assisted by the end of the mini-panic in the credit markets.
Then crude oil prices will be facing the prospect of the next credit crisis that could become evident in September. Over time, it will also be facing an increase in production and pricing presures similar to that recorded by natural gas.
Unresponsive to Middle East problems, other commodities declined with the mini-panic. Base metals (GYX) slipped to 323, which extended the bear that started at 502 in early 2011. However, relief in credit markets has prompted a rally. Relief could run for a few weeks more.
The decline in the grains (GKX) took out the low of 281 set last June just as the drought was starting. Technically, this sets the cyclical bear that started at 382 in March 2011.
Relief in the credit markets could allow a rally for a few weeks.
Link to July 5, 2013 ‘Bob and Phil Show’ on TalkDigitalNetwork.com:
http://talkdigitalnetwork.com/2013/07/jobs-up-again-gold-tanks/
BOB HOYE, INSTITUTIONAL ADVISORS
E-MAIL bhoye.institutionaladvisors@telus.net
WEBSITE: www.institutionaladvisors.com
Sunspot Number
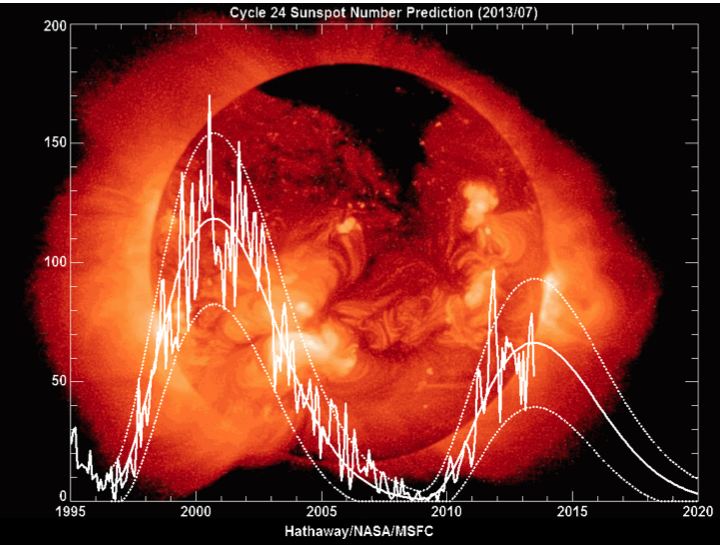
Livingstone and Penn expected diminished solar activity.
This shows up in the sunspot number.
The recent minimum was the lowest since 1913.
Solar cycle #24 has been the weakest in over one hundred years.
This is the main reason why there has been no increase in temperatures over the past 16 years.
Sunspot counts in the 1960s and 1970s reached the highest in 1,000 years. Global temperatures have not yet been as high as recorded with the Medieval
Optimum that ended in the early 1300s.

-
I know Mike is a very solid investor and respect his opinions very much. So if he says pay attention to this or that - I will.
~ Dale G.
-
I've started managing my own investments so view Michael's site as a one-stop shop from which to get information and perspectives.
~ Dave E.
-
Michael offers easy reading, honest, common sense information that anyone can use in a practical manner.
~ der_al.
-
A sane voice in a scrambled investment world.
~ Ed R.
Inside Edge Pro Contributors

Greg Weldon

Josef Schachter

Tyler Bollhorn

Ryan Irvine

Paul Beattie

Martin Straith

Patrick Ceresna

Mark Leibovit

James Thorne

Victor Adair