
Gold & Precious Metals
Short term strength has provided an opportunity to take profits this week in a wide variety of economic sensitive sectors.
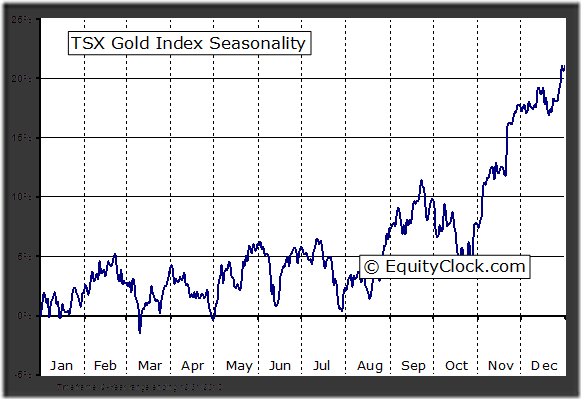
Selected sectors with favourable seasonality in the summer are starting to outperform the S&P 500 Index including gold, biotech and utilities.
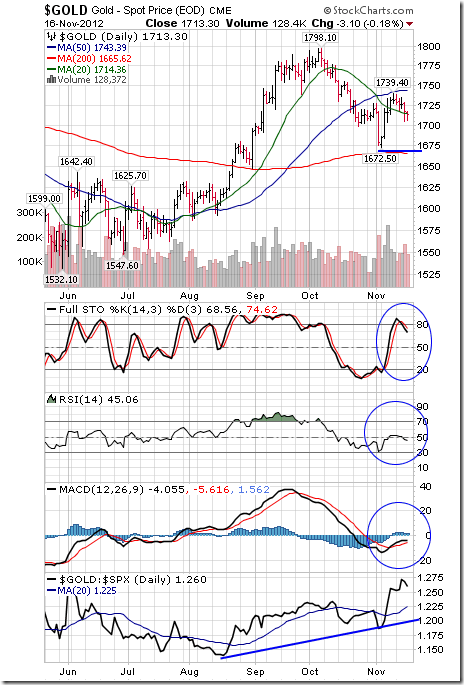
Gold gained added $64.90 per ounce (5.35%) last week. Trend changed from down to up on a move above 1,267.00. Gold moved above its 20 day moving average. Strength relative to the S&P 500 Index remains negative, but showing signs of improvement. Technical score increased from 0.0 to 2.0 out of 3.0. Short term momentum indicators are trending up. ‘Tis the season for strength between July 12th and October 9th
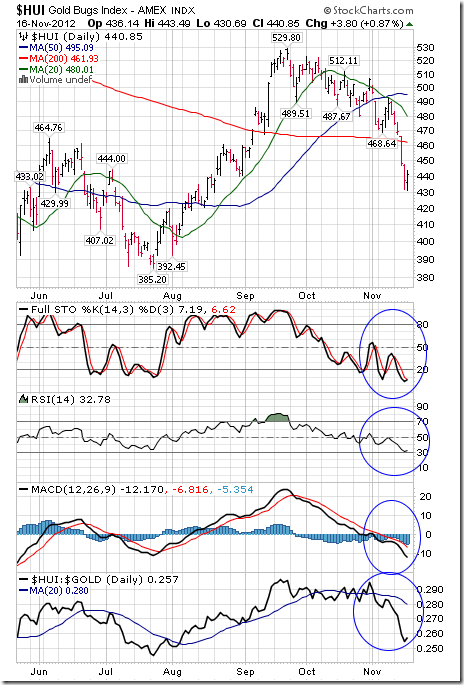
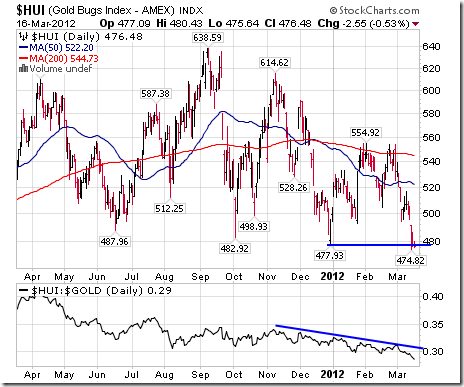
The AMEX Gold Bug Index gained 9.14 points (4.23%) last week. Trend remains down. The Index remains below its 20, 50 and 200 day moving averages. Strength relative to Gold and the S&P 500 Index remains negative. Technical score remains at 0.0 out of 3.0. Short term momentum indicators are trending up.
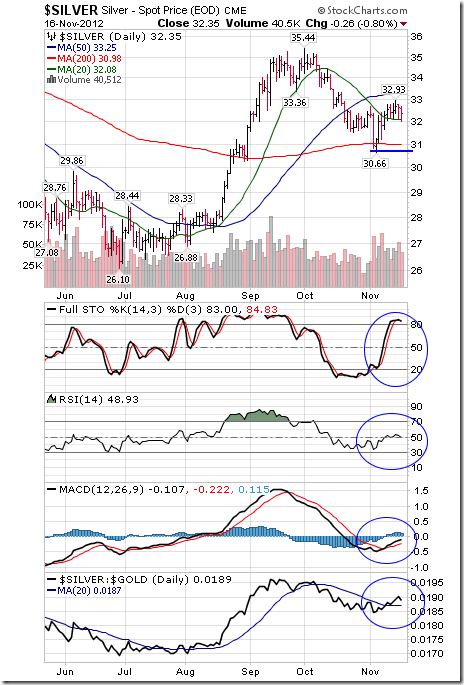
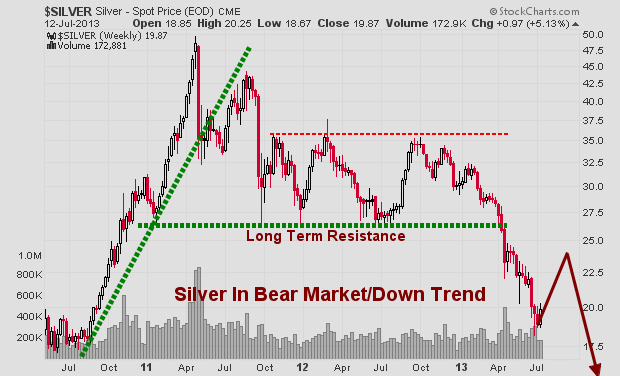
Silver gained $1.05 per ounce (5.60%) last week. Trend changed from down to up on a move above $20.08. Silver briefly moved above its 20 day moving average, but closed below that level on Friday. Strength relative to Gold and the S&P 500 Index improved from negative to neutral. Technical score improved from 0.0 to 1.5 out of 3.0. Short term momentum indicators are trending up.
Platinum gained $80.50 per ounce (6.07%) last week. Trend remains down. Platinum moved above its 20 day moving average. Strength relative to Gold remains positive and strength relative to the S&P 500 Index improved from negative to neutral.
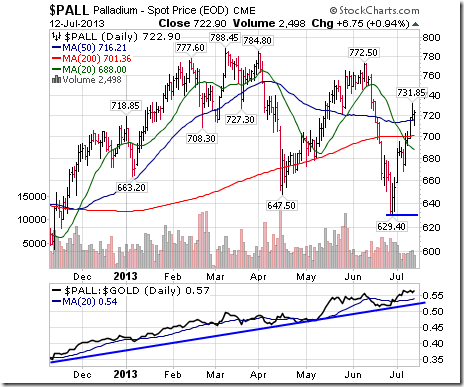
Palladium added $45.35 per ounce (6.69%) last week. Palladium moved above its 20, 50 and 200 day moving averages. Strength relative to Gold remains positive.
The TSX Metals & Mining Index gained 25.43 points (3.71%) last week. Trend changed from down to up on a move above 710.49. The Index moved above its 20 day moving average. Strength relative to the S&P 500 Index is improving, but remains negative. Technical score improved from 0.0 to 2.0 out of 3.0. Short term momentum indicators are trending up.
…..much more commentary and 40 more charts & categories in Don’s great monday report HERE

Market Psychology has taken a wild round trip since May 22…when Bernanke first frightened the market with talk about tapering…to this past week when the major American stock indices closed at new All-Time-Highs. The US stock market was at All-Time-Highs May 22 before Bernanke’s tapering comments…it fell ~8% to the June 24 lows…as Market Psychology worried that the Fed was going to “take away the punch bowl”…but then it changed dramatically…tapering worries were thought to be “overdone”…and Fed spokesmen everywhere, including Bernanke himself, made the case that “accommodation” was going to continue…so…the market roared back with the Dow up nearly 1000 points in 12 trading days. Where do stocks go from here? Higher is the easy answer, but the bond market may be signaling caution.
It’s tempting to speculate why Bernanke “changed his tune.” On May 22 and again on June 19 he clearly gave the market a signal that the Fed was going to cut back on “accommodation”…but then on July 10 he gave a completely opposite signal. Did he underestimate the impact his initial remarks would have on the market…or is this “give and take” part of a process to prepare the markets for inevitable cutbacks?
US Stock Market: I called May 22 a Key Turn Date…but as far as the US stock market is concerned May 22 was just a day when Market Psychology began a modest correction…the market had probably been “too bullish” after a 6 month run from the November 16, 2012 KTD and it needed a little correction and now…less than 2 months later…the correction has run its course and we’re back making new All-Time-Highs…the correction was obviously just another “Buy The Dip” opportunity, courtesy of your local Central Bank.

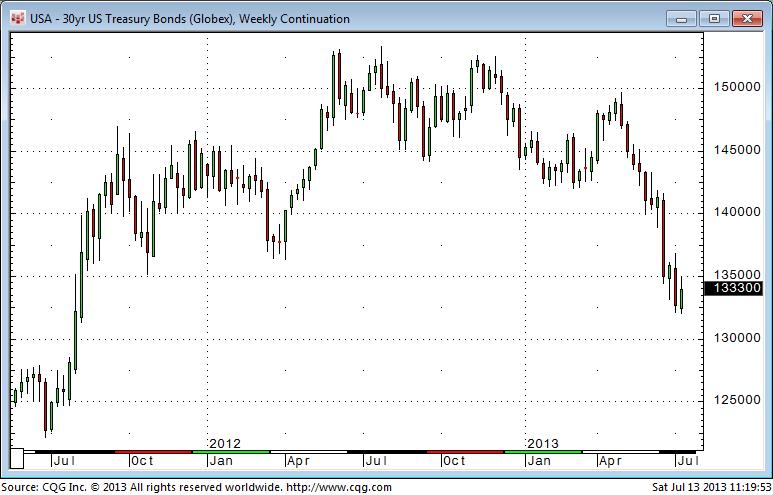
But the US bond market tells a different story. Since May 22 bond prices have fallen to 2 year lows while the yield curve has steepened dramatically. Most of the time it’s a safe bet that the bond market is “smarter” than the stock market…and in this case bonds may see Fed tightening ahead…while stocks see clear sailing.
Gold is now down over $100 since May 22…although it has rallied back $100 from the 3 year lows it hit at the end of June. ETF sales continue, but the large speculative short positions on Comex may provide fuel for a further rally. As noted in this blog 2 weeks ago I’m net long gold.
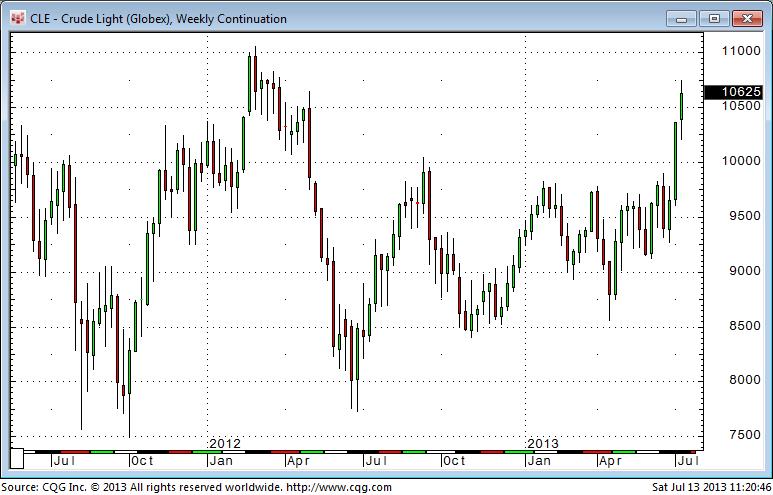
WTI crude oil is up more than $10BBL from its May 22 levels…to its best levels in over a year. Obviously rising Mid-East geo-political risk has put a bid into the market…but is real demand also adding a bid…despite growing domestic supplies? I don’t know, but you’d have to be really well informed…or just plain “feeling lucky” to want to short a market that looks like this:
The currency markets have been a puzzle. The US dollar Index was at 3 year highs on May 22 but then FELL (??) for 3 weeks as the markets believed that the Fed would begin to taper…the fall was mainly against the Euro while the US$ rallied against nearly all other currencies (there were huge short positions against the Euro and that may have accounted for its rally…and/or maybe European banks have been calling in overseas loans and repatriating capital home to shore up their balance sheets.)
On June 19 when Bernanke made his second “taper” comments the US$ soared against all currencies, including the Euro, with the US$ Index hitting new 3 year highs this week before Bernanke “sang a different tune” on July 10 and the US$ plunged against all currencies. This past week saw the US$ Index create a Weekly Key Reversal Down…following a Weekly Key Reversal Up 4 weeks ago…the currency markets are “choppy” on hourly, daily and weekly time frames! Yikes! But the Big Picture trend since the May 2, 2011 Key Turn Date has been up.

What to make of it all? Two weeks ago I wrote that I expected the US stock market rebound from the June 24 lows to “peter out” and the market to roll over and make new lows…which would mean that the May 22 highs were indeed a Major Key Turn Date. HOWEVER, I also wrote that if the market was able to rally back through the June 19 highs (the date of Bernanke’s second taper scare) then new all-time-highs were likely to follow. (You have to respect the bullish momentum created as the US stock market rallied over 100% from its March 2009 lows.)
If Bernanke would have stayed consistent with his May 22 and June 19 signals during his July 10 Q+A session then I doubt that stocks would be making new highs…but he didn’t…and they are. Once again we have evidence that this market is trading on the anticipation of Central Bank policy…nothing much else matters.
Trading Themes:
For my short term trading accounts:
I have zero conviction as to where the US stock market goes from here. The market feels toppy to me…and even though Fed officials have stated that accommodation will continue it seems as though some tapering is inevitable. My currency theme remains that the US dollar gets stronger. My interest rate theme remains that we’ve seen the lows and higher rates lie ahead. With respect to gold…I’m net long a small position of gold as of two weeks ago and still have that position. But it’s summer holiday time and I’m happy to be mostly in cash and on the sidelines…it’s more important to me to maintain my capital and my sanity for future trading opportunities rather than thrash around in these markets. There are important elections coming in Japan in July, Germany in September and while the markets seem to be churning right now some good trading trends may come from all this chop. Best wishes for good health and good trading.
Futures and futures options are the best way to trade currencies, metals, stock indices and many other financial and commodity markets. Call 604 664 2842 to talk with a futures broker.

Is it a revolt?” Louis XVI asked the Duke de La Rochefoucauld.
“No, sire, it is a revolution.”
We are already at the Ides of July. More than half of the year is already behind us.
Friday, markets were flat. Neither gold nor stocks did anything worth reporting.
July 21 is statistically the hottest day of the year in the Northern Hemisphere. And it’s already smokin’ hot in Baltimore. The forecast calls for 98 degrees Fahrenheit today. More than 100 later in the week. We’re glad we’re not there. We lived through 48 summers in Baltimore, more than enough for any man.
Sometimes, in the summer months, the TV meteorologists might as well go on vacation. Day after day, the same forecast: hazy, hot, humid… with a chance of afternoon thundershowers. It can go on like that for weeks. Or even months.
It’s hot here in Normandy too. But every hell hath its own heat. It’s Normandy’s version of hot, not Maryland’s version. Yesterday, the temperature must have gotten up into the low 80s here.
When the weather is nice in Normandy, it’s very nice. But sometimes, a whole year can go by with only a few weeks of really nice weather. The good weather here began only very recently. A couple of weeks ago, we were wearing sweaters and jackets and lighting fires in fireplaces. Now the days are sunny and warm. The nights are cool and clear.
It’s finally summer in France… the way it oughta be.
France’s Minsky Moment
Yesterday was Bastille Day.
The French celebrated with fireworks, as usual. On more than one occasion over the years, we asked what they were celebrating. Never did we get a good answer.
“It was the beginning of the revolution,” one said. “But I don’t know why we would celebrate that.”
“It marks the beginning of the French Republic and the establishment of the Rights of Man,” said another, grandly.
And yes, the Republic and the proclamation of the Rights of Man did happen after the Bastille was stormed. But neither depended on it. The Bastille was irrelevant. It held only seven prisoners. Two counterfeiters. Two mental cases. One pervert. It would have held another famous pervert, the Marquis de Sade, but he had been transferred 10 days before.
But in the summertime, things can get hot…
Temperatures had begun to rise in France long before the Bastille was taken.
France had enjoyed a fair period of growth and stability under the Louis. Modern France was put together under them.
By the 18th century, the king was supposed to have a divine right to rule. He was supposed to be an “absolute” monarch. But each Louis found that – to hold onto power – he had to give up a little bit more of it… a little privilege here and there… a right to do this or that… a sinecure… a pension.
Over time, as Professor Mancur Olson explained, groups get together to push programs that benefit them – at the expense of the general welfare. They hire lobbyists. They solicit favors. They get monopolies and set up trade barriers. He did not say so, but they become what we call “zombies.”
“Stability causes instability,” was how Hyman Minsky described it. The accumulation of special favors weakened the authority of the king.
The Power of Talk
And God didn’t seem to help him much.
The clergy had its own lands… and its own government.
The aristocrats insisted on making their own rules too and, importantly, on having the right to approve the taxes Louis laid upon them.
And then, even the Third Estate – the common people – wanted its privileges too.
By the time the 16th Louis came along, the tinder was dry. And a warm wind of revolutionary ideas blew through Paris. In the Palais-Royal, for example, a public meeting continued almost around the clock. All of sudden, talk seemed to matter.
You could talk to each other about how to improve the world. You could talk about giving more food to the poor, for example. You could even set up an assembly of the people’s representatives at which they could talk too.
You could talk about liberty… about justice… And why not about redistributing the lands of the church? And why not a zombie uprising… so everybody got what he wanted?
If you could say something… you could do it, too.
In the summer of 1789, sparks flew. Soon, the dry tinder was lit. Crowds began looting stores and attacking the king’s military bases. Muskets were seized. Revolutionary groups were formed. The proletariat was hot now… and it saw no limit to its power or its prospects. Surely, it could pass laws too… and make itself rich.
Even many of Louis’ soldiers were talking about it… and taking the proles’ side.
Then, on July 14, a mob of about 1,000 people attacked the Bastille. Nearby troops did nothing to aid the small garrison of the fortress. The mob routed the defenders and murdered the Bastille’s governor, Bernard-René de Launay. De Launay’s head was sawed off and put upon a pike that was paraded around Paris.
Louis XVI was executed, by guillotine, on January 21, 1793.
Regards,
Bill
Market Insight:
If This Is a New Bull Market,
Why Are Stocks So Expensive?
by Chris Hunter
Cliff Asness, a former Goldman Sachs “quant” and co-founder of hedge fund AQR Capital Management, has calculated that the prospective returns from a typical stock and bond portfolio (with 60% in stocks and 40% in bonds) is 2.4% per year – the worst predicted return in 112 years.
The problem is stocks and bonds are expensive. And money is made in the markets “in the buying.” In other words, buying low and selling high… not the other way around.
One way to measure how expensive stocks are is by using the cyclically adjusted price to earnings ratio, or CAPE. Unlike the normal P/E ratio, which looks at just 12 months’ worth of earnings or forecast earnings, the CAPE compares share prices to average inflation-adjusted earnings over the previous 10 years.
This smoothes out any anomalies created by unusually high or unusually low earnings over a 12-month period. And it has been a good guide to long-run returns.
At today’s CAPE of 24.6, history suggests returns of less than 1% over the next decade for buying and holding the S&P 500.
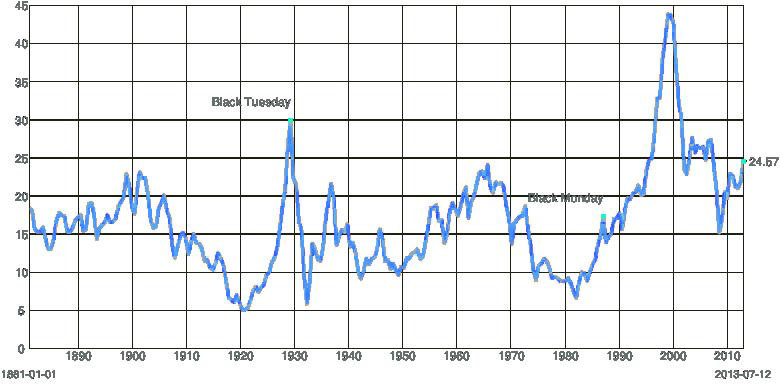
This is a problem for the bull case for US stocks. Because it suggests stocks have not yet reached their final secular bear market bottom – where valuation levels are low enough to give above-average returns.
This usually happens with the CAPE in single digits… not far above the historic average, where it sits today.
History suggests we’ll see one last big fall in stocks before the next secular bull begins.

Chris Hunter
Investment Director
Bonner & Partners Family Office

During the recent weeks we have seen commodities especially precious metals continue to drop in value. Market participant sentiment has become more bearish on commodities and couple that with a rising dollar it’s no wonder why we continue to see commodities as a whole fall in value.
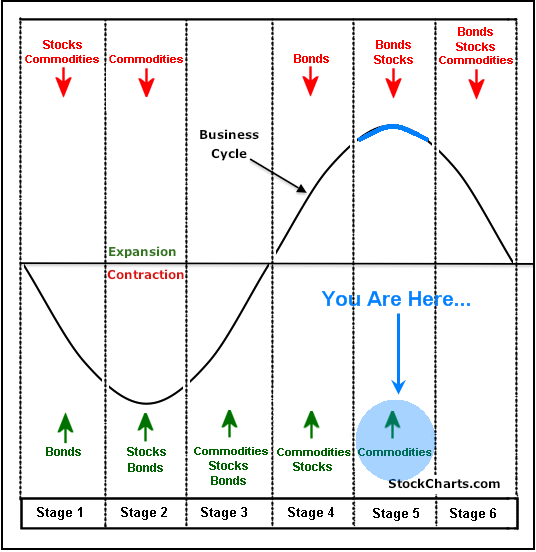
Money has been flowing out of bonds at record levels this summer telling us most of market participants are feeling bullish on the stock market. This shift in sentiment of the masses are typical as they move their money from the risk on safer assets (bonds & commodities) and rotate into risk-on assets like stocks. While this is a bearish (contrarian sign) stocks could easily continue to rally for an extended period of time and possibly several more months before they actually top out.
LET’S TAKE A LOOK AT THE FINANCIAL MARKET BUSINESS CYCLE DIAGRAM:
Bond prices have been falling for months and they typically lead the stock market lower. I feel we are starting to enter the phase where stocks will soon top and head lower also. Once this starts money will naturally flow into safer assets that are more tangible like commodities.
Keep in mind this cycle is very slow moving and rotation from one phase to another takes months. This is a process not an event but it is still very tradable.
Precious Metals
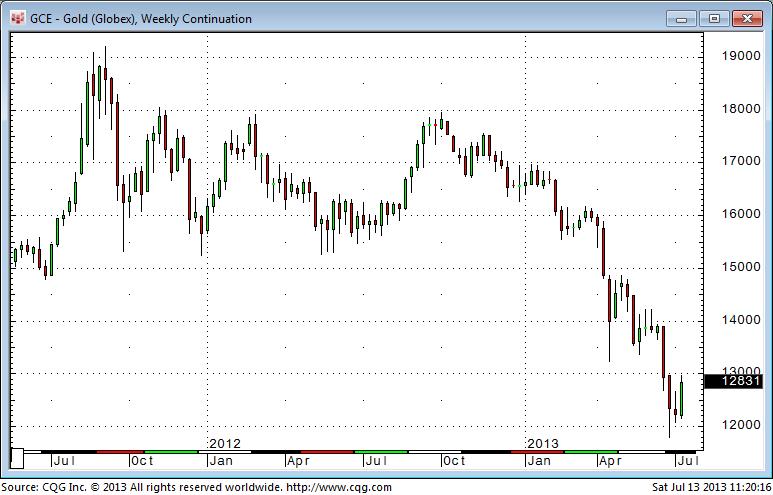
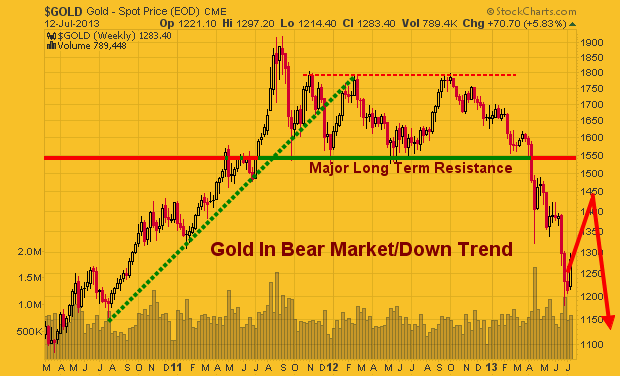
Now let’s fast forward to precious metals both gold and silver are likely to do in the next couple months. If you review the charts below you will see gold and silver bullion prices are looking primed for a bounce/rally from these deep oversold levels.
GOLD WEEKLY PRICE
SILVER WEEKLY PRICE
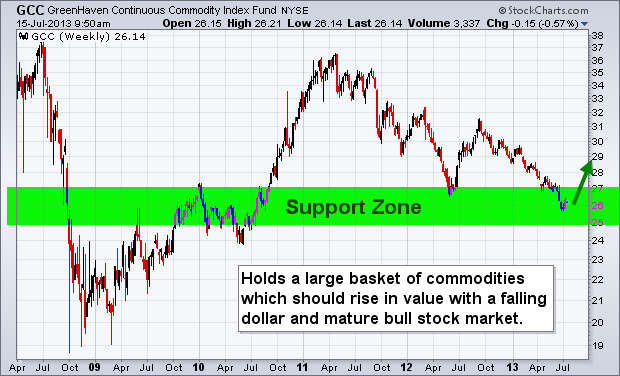
TAKE A LOOK AT A BASKET OF COMMODITIES THROUGH THE GCC ETF.
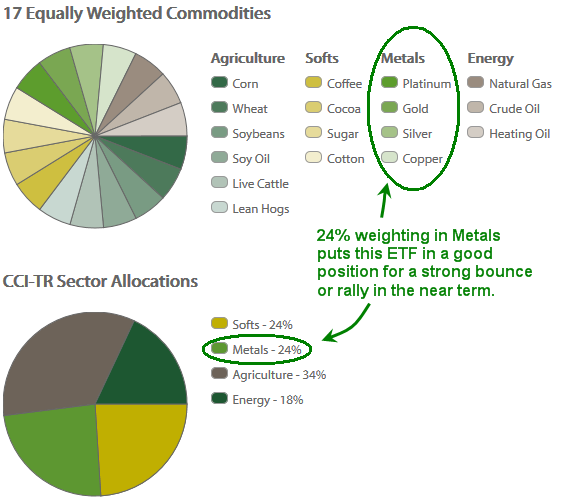
GreenHaven Continuous Commodity Index Fund (GCC) is an Exchange-Traded Fund (ETF) that provides an innovative and efficient way to deliver broad based, diversified commodity exposure. It aims to achieve this by using futures contracts to track the Thomson Reuters Equal Weight Continuous Commodity Total Return Index (CCI)†. The CCI-TR is an equal weighted index of 17 commodities plus an additional Treasury Bill yield. Because of the equal weighting, GCC offers significant exposure to grains, livestock, and soft commodities and a lower energy weighting than many of its peers. In addition, GCC is rebalanced every day in order to maintain each commodity’s weight as close to 1/17th of the total as possible.
So, knowing metals are 24% of the index it bodes well for a bounce in the overall commodity index. Keep in mind this report is only focusing on precious metals, but many other commodities look ready to rally also like natural gas.
GCC – CONTINUOUS COMMODITY INDEX FUND WEEKLY TRADING CHART
The chart below shows a very bullish 4 year chart pattern. At the very minimum a bounce to the $29 is highly.
COMMODITY BASKET TRADING CONCLUSION:
In short, commodities as a whole remain in a down trend. Until they show signs of real strength I will not be trying to pick a bottom. Several commodities are starting to look oversold and ready for a bounce like sugar, coffee, copper and natural gas.
Last month I talked about how a major market top is likely to unfold during the second half of this year. I still believe this to be true. But keep in mind these major market tops which only happen every few years are a MAJOR PROCESS. They take time to form and often we will see a series of new highs followed by quick sell offs as the market gets more people long as they big money distributes their shares/contracts into the new money rotating into the market.
If you want more reports and trade ideas join me at www.GoldAndOilGuy.com
Chris Vermeulen

 In the full interview below, Don Coxe, chairman of Coxe Advisors LLP answers Michael’s penetrating questions about not only what is driving markets, but also how to interpret the big changes afoot and profit from them.
One of the reasons Michael likes Don so much as a strategist and investor, is that he has been engaged at the senior level in global capital markets through every recession and boom since the onset of stagflation in 1972. Indeed Don was interpreting markets well before the 34 year Bull Market in Bonds began, the Bull market in Bonds that he thinks recently topped and entered into a Bear Market.
Don begins answering Mike’s questions with an analogy, comparing Battlefield surgeons use of heroin on serious injuries with the Fed’s use of Quantative easing. This interview is only 19 minutes long really fascinating, particularily the last 4-5 minutes:
{mp3}mtjuly132013hour2{/mp3}

-
I know Mike is a very solid investor and respect his opinions very much. So if he says pay attention to this or that - I will.
~ Dale G.
-
I've started managing my own investments so view Michael's site as a one-stop shop from which to get information and perspectives.
~ Dave E.
-
Michael offers easy reading, honest, common sense information that anyone can use in a practical manner.
~ der_al.
-
A sane voice in a scrambled investment world.
~ Ed R.
Inside Edge Pro Contributors

Greg Weldon

Josef Schachter

Tyler Bollhorn

Ryan Irvine

Paul Beattie

Martin Straith

Patrick Ceresna

Mark Leibovit

James Thorne

Victor Adair