
Energy & Commodities

Invest in Cost Effective Curb Appeal Home Upgrades
Remodeling magazine’s 2012-13 Cost vs. Value report, which measures how much of the costs of remodeling projects are recouped in a home’s resale value, showed that exterior replacement projects are the most valuable upgrades for homeowners. These types of home improvement jobs accounted for six of the top 10 most cost- effective midrange projects and eight of the top 10 upscale projects.
– Steel entry door replacement
– Wood/composite deck addition
– Garage door replacement
– Wood/vinyl window replacement
– Fiber cement/vinyl siding replacement
Additionally, many experts may tell you that major projects, such as a kitchen or master bedroom remodel, are great ways to add value to your home. But the reality is that, although they do add value, much of the cost of such renovations is oftentimes not recouped in the sales price. On the other hand, Remodelingmagazine’s annual Cost vs. Value report shows that small-to-mid scale projects, namely maintenance, repair and replacement jobs, have proven very cost effective for homeowners.
Invest in a Home alarm system
Installing a quality home alarm system is one of the best ways to increase your home’s value. In a country where a burglary is committed every 15 seconds, it’s no surprise homeowners have come to place a high premium on home security.
Of course, the actual value it adds will vary depending on your geographic location, the type of system you install and other factors. Generally, up-to-date professionally monitored wireless systems with comprehensive protection will add more value than traditional, hard-wired systems.
Nowadays, you’ll find that high-quality wireless systems are affordable for most homeowners. For example, ADT is currently offering monitored protection for around just $9 per week. Take a look athttp://www.securitychoice.com/ if you’re interested in finding out more.
Create Curb Appeal
You know what they say, “first impressions last forever.” This age-old adage has plenty of merit when it comes to real estate. Since your front yard will make the first impression on a potential home buyer, it’s essential that it’s a good one. Keep your lawn well-maintained, shrubs/hedges trimmed and sidewalks/driveway clean. Additionally, make sure flower beds are filled with vibrant, colorful plants and not overrun with weeds. A beautiful front yard is the essential first step in reeling in a potential buyer, so make sure your first impression is a good one.
Related Article: Should I Invest in the Market or Pay Off Bills?
About Zantrio
Zantrio was founded in November 2007. Our aim is to inform and educate the world about trading, investing, and finance. Whether you’re an active day trader, a casual investor, or a college student looking to learn the basics of personal finance, Zantrio was built for you! Take a look around, and let us know what you think!

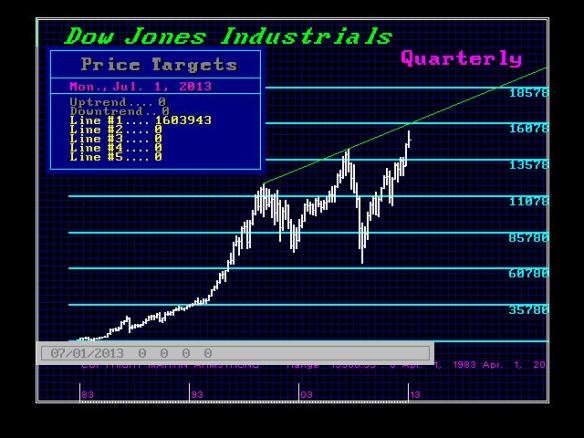
The Dow Jones Industrials are approaching the major top of the up uptrend channel. which stands at the 16000 level for the 3rd quarter. We have a turning point in September. The real question is will we breakout and move into a Phase Transition going into 2015.75? This depends entirely how we interact with this technical resistance projection. We can exceed it, and then fall back to retest it from above. Holding this projection then becomes the springboard for a Phase Transition to the upside.
The second pattern would be to peak at this projection in September, fall back as retest support holding the Weekly Bearish Reversals generated from that high, and then resume the uptrend to blast through to the upside. in 2014.
Many question have been coming in regarding seminars and a forecasting report for the share markets. We have these under consideration right now. The maximum target for the Dow Jones Industrials by 2015.75 is actually 43,390. This becomes a viable target depending upon all markets and how they set up for September aft er the ECM mid-point target of August 7th.
Fed Minutes Show 50% of Board Want QE To End by Year-end
The minutes of the Fed meeting are showing that we may not be talking about tapering the Quantitative Easing, we may be looking at its end. Bernanke is leaving because the Fed has no room to manipulate the economy no less interest rates. This is perhaps the greatest dissent within the Fed we have every seen. QE is going to die and Bernanke is leaving. So say Hello to the next 2 years.
Where will Capital Go After 2015.75?
QUESTION: When the capital flows change direction after 2015.75, . . . .. If the inflows come to the USA after Japan & Europe implode, where does capital go after 2015.75??????
ANSWER: ….read & view it all HERE
Europe’s debt-crisis strategy is near collapse. The Wheels Are Coming Off the Whole of Southern Europe. The long-awaited recovery has failed to take wing. Debt ratios across southern Europe are rising at an accelerating pace. Political consent for extreme austerity is breaking down in almost every EMU crisis state. And now the US  Federal Reserve has inflicted a full-blown credit shock for good measure. None of Euroland’s key actors seems willing to admit that the current strategy is untenable. They hope to paper over the cracks until the German elections in September, as if that is going to make any difference. A leaked report from the European Commission confirms that Greece will miss its austerity targets yet again by a wide margin. It alleges that Greece lacks the “willingness and capacity” to collect taxes. In fact, Athens is missing targets because the economy is still in free fall…and that is because of austerity overkill. The Greek think-tank IOBE expects GDP to fall 5pc this year. It has told journalists privately that the final figure may be -7pc. The Greek stabilisation is a mirage.
Portugal pushed closer to the brink
Portugal’s borrowing costs have spiked dramatically after key political parties failed to agree on a national salvation front, raising the risk of a snap election and an anti-austerity revolt.
Yields on 10-year Portuguese bonds jumped more than 100 basis points to 7.85pc in a day of turmoil, kicked off by a government request to delay the next review of the country’s EU-IMF Troika bail-out until August.
….more by Evans-Pritchard HERE
OECD fears jobless threat to social fabric
The unemployment gap between the US and eurozone states will reach the highest levels in modern history next year, according to a report by the OECD
While the US jobless rate will continue falling to 6.7pc by the end of 2014 as recovery takes hold, the rate for the EMU currency bloc will rise to a fresh record of 12.3pc with large pockets of extreme distress.
A trans-Atlantic gap of 5.6 percentage points is unprecedented in modern times and appears to reflect the starkly different policies pursued by the two major blocs since the Lehman crisis.
….more by Evans-Pritchard HERE
The Dow just made another post-financial crisis rally high. To provide some further perspective to the current Dow rally, all major market rallies of the last 112 years are plotted on today’s chart. Each dot represents a major stock market rally as measured by the Dow with the majority of rallies referred to by a label which states the year in which the rally began. For today’s chart, a rally is being defined as an advance that follows a 30% decline (i.e. a major bear market). As today’s chart illustrates, the Dow has begun a major rally 13 times over the past 112 years which equates to an average of one rally every 8.6 years. It is also interesting to note that the duration and magnitude of each rally correlated fairly well with the linear regression line (gray upward sloping line). As it stands right now, the current Dow rally that began in March 2009 (blue dot labeled you are here) would be classified as well below average in both duration and magnitude. However, when compared to the most recent post-major bear market rally (i.e. the rally that began in 2002), the current rally is significantly greater in magnitude and accomplished this feat in less time.
Notes:
Where’s the Dow headed? The answer may surprise you. Find out right now with the exclusive & Barron’s recommended charts of Chart of the Day Plus
Quote of the Day
“Bulls markets have no resistance-bear markets have no support.” – anonymous
Events of the Day
August 05, 2013 – PGA Championship begins (ends August 11th)
Stocks of the Day
— Find out which stocks investors are focused on with the most active stocks today.
— Which stocks are making big money? Find out with the biggest stock gainers today.
— What are the largest companies? Find out with the largest companies by market cap.
— Which stocks are the biggest dividend payers? Find out with the highest dividend paying stocks.
— You can also quickly review the performance, dividend yield and market capitalization for each of theDow Jones Industrial Average Companies as well as for each of the S&P 500 Companies.
Mailing List Info
Chart of the Day is FREE to anyone who subscribes.
To ensure email delivery of Chart of the Day, add mailinglist@chartoftheday.com to your whitelist.
Sign up HERE to Free Chart of the Day


-
I know Mike is a very solid investor and respect his opinions very much. So if he says pay attention to this or that - I will.
~ Dale G.
-
I've started managing my own investments so view Michael's site as a one-stop shop from which to get information and perspectives.
~ Dave E.
-
Michael offers easy reading, honest, common sense information that anyone can use in a practical manner.
~ der_al.
-
A sane voice in a scrambled investment world.
~ Ed R.
Inside Edge Pro Contributors

Greg Weldon

Josef Schachter

Tyler Bollhorn

Ryan Irvine

Paul Beattie

Martin Straith

Patrick Ceresna

Mark Leibovit

James Thorne

Victor Adair