Timing & trends

A few reasons to cover the gold shorts

The U.S. Comex gold futures (COMEX:GCU13) surged 3.33% on Monday, the highest percentage change since June 29, 2012. On Wednesday morning in Asia, the gold futures rose further and traded above $1,340. The Dollar Index fell about 0.8% this week to 81.945 on Tuesday. The S&P 500 index was flat in the past two days while the Euro Stoxx 50 Index rose 0.25%.

A Floor to China’s Growth

The gold market has been adjusting to the expectations of the Fed’s tapering. A Bloomberg poll shows that 50% of those surveyed expects that the U.S. Fed will reduce its bond purchases to $65 billion a month in September. The market also takes comfort from the news that the Chinese government will put a floor of its GDP growth at 7% because China needs to become a moderately wealthy society by 2020. The July flash China PMI came in weaker at 47.7 compared to an expected 48.2. China has also started to liberalize its interest rates by removing the lower limit of the financial institutions’ lending rates. The next important step in China’s structural reforms will be the liberalization of the deposit rates.

Support for Gold Prices

The surge in gold has been accompanied by a weaker U.S. dollar. In June, the existing home sales in the U.S. fell to 5.08 million on an annualized basis compared to the median forecast of 5.26 million and 5.14 million in May. On July 22, the gold futures closed above its 50-day moving average for the first time in eight months. Physical demand has been robust in Asia as evidenced by the persistent premiums. The dwindling Comex gold inventory has raised concerns of default by the Comex. Gold traders are increasingly covering their shorts as physical gold delivery is getting a little harder each day. The CFTC data shows that during the week of July 16, the net short positions in gold by speculators fell 10.82% to 121,305 contracts while the net combined positions surged a whopping 47.72%. On the negative front, India has further restricted gold imports by requiring the importers to set aside 20% at the customs warehouses for re-exports. The gold will be made available to jewelers and bullion dealers only. The All India Gems and Jewellery Trade Federation expects the gold imports to drop 63% in the second half of this year, further pressuring gold prices.

Gold scrap supply to drop up to 25% as sales decline

…..read it all HERE


About the Author

AustinKiddle-resize-100x100Austin Kiddle

Austin Kiddle is a director of the London-based gold broker Sharps Pixley Ltd.


As an investor, you probably get a lot of advice and don’t know which to follow: there are conflicting reports, Fed announcements, figures that tell only half the story. In this interview with The Gold Report, Ralph Aldis, senior mining analyst with U.S. Global Investors, helps investors parse these many information streams, explains what seasonal gold pricing patterns could mean for investors who await greater leverage to a gold price recovery.

The Gold Report: The CEO of U.S. Global Investors, Frank Holmes, recently told gold investors to “keep calm and invest on.” I hope you have the T-shirt royalties for that. What advice do you have to help investors do that?

Ralph Aldis: We like this phrase because it reminds investors not to let their emotions get the best of them. Instead, investors need to plan an investment strategy and make sure it includes all their assets. Investors need to think about what the weightings are in those assets, track quarterly performance numbers to make sure assets aren’t correlated with each other, make sure there is diversification and rebalance the portfolio every year.

TGR: What’s a good asset allocation mix through at least the end of the year?

RA: The asset mix will be a function of age, investment objectives and how soon liquidity is needed. Generally, a maximum of 5–10% in gold and gold stocks, 50% in equities, 30% in fixed income and the balance in some other asset, such as real estate or home value.

TGR: U.S. Global Investors recently reported that gold has 30% upside potential over the next 18 months. What do you believe will specifically move the gold price?

RA: A 30% rebound is well within the normal volatility swings of gold for a given year. Right now, we have the seasonal rally in the gold market. Buyers, like jewelry manufacturers, return to the market usually in late July or August and start restocking to get gold into the pipeline.

Another factor is the employment data that recently came out. It beat expectations, and people got excited. But most of the gains came from part-time jobs, which were up 360,000, and we lost 240,000 full-time jobs. The full U6 unemployment rate actually climbed to 14.3%, up from 13.8% in May. The quality of the employment numbers was dismal, but people saw the headline number and thought “Woohoo, go long equities!” Macquarie Research released a study on July 11 that said the Federal Reserve tapering is much further out than expected—Q4/16 not Q4/14.

TGR: Can a climbing gold price and a strong U.S. economy coexist?

RA: Yes. Some economic growth and a little inflation could get the gold price and the economy growing in sync. But you need the dollar to weaken, which is a function of U.S. interest rates going down. The Federal Reserve doesn’t want a rising interest rate because that stifles some of the economic activity and makes the U.S. debt burden greater.

TGR: What about central bank buying by emerging market countries? If their economies are stronger, will some of the spoils go into gold?

RA: We’ve had seven months in a row of central banks buying gold. The U.S. dollar isn’t as significant to official holdings as it used to be. It has lost a lot of influence, and emerging markets don’t feel they need to own dollars instead of gold.

TGR: But if the American economy is rolling, chances are the global economy is doing well. If these emerging market economies buy more gold, won’t that put pressure on the gold price?

RA: That would be the hedge that I would want to be making, too, trying to diversify some of that risk as some countries, like China, probably have way too many dollars in their official reserves.

TGR: What are some signs for investors that it’s safe to return to the precious metals sector?

RA: We look at the year-over-year changes in the gold price to indicate whether the price has moved up two standard deviations from its mean, which means that gold may soon correct, or whether the metal has moved down two standard deviations from its mean, in which case, gold is due for a rally.

Also, look for the exhaustion of money flows out of the gold sector, which is happening now. We’re just beginning to see positive money flows come into some of our gold funds now.

We’re also seeing gold analysts capitulate. These people get paid to love stocks, and they capitulated. When analysts do that, I believe it’s a sign to buy.

TGR: Has the slide in precious metals prices and the recent selloff exposed some of the flaws in precious metals exchange-traded funds (ETFs)?

RA: If you’re a U.S. citizen, the biggest drawback is a tax liability issue. The SPDR Gold Trust ETF  is taxed as a collectible, so if you recently sold and made a gain, you actually have to make twice as much than you would on a gold stock investment. It’s liquid and gives you exposure, but it’s just not tax efficient.

TGR: You said investors should have 5–10% of their portfolios in gold and gold equities. Why should they hold Canadian or American gold equities versus gold futures or gold ETFs?

RA: Tax efficiency is a consideration. Plus gold equities can move two to three times the magnitude of the underlying metal price. And our research has found that a small weighting of gold stocks in a portfolio of U.S. companies historically increased return with the same amount of risk.

TGR: But some of the names you’re following have limited liquidity. How do investors deal with that?

RA: Sometimes people look at our mutual fund holdings and marvel that there are 150 names there. But we want to have enough liquidity to adjust positions. Maybe we’d like to have a bigger position, but if investment conditions change for that particular stock, you could compromise your liquidity. If we can build a portfolio out of 10 or 20 junior names that meet our criteria, then we’re insulated from some of the extreme price moves.

TGR: What is price leadership?

RA: We look at price performance over a period of time and for statistical significance of outperformance relative to others in that model. When the market knows more than you do, you can see it through price leadership. Ask why a stock is outperforming and see if it makes sense.

TGR: Do you have some parting thoughts for us, Ralph? Maybe something to bolster the hopes of the retail crowd?

RA: Gold investors are seeing two newer trends in gold. One has to do with a move out of paper gold to the physical holding of gold. Chinese gold imports from Hong Kong have more than tripled since 2012 and premiums for gold physical delivery in Shanghai jumped above $30/oz. In addition, the U.S. Mint suspended sales of its smallest American Eagle gold coin after it sold off its entire inventory.

The second trend is the extreme pessimism toward gold, with speculative short positions hitting a record level. As of the beginning of July, the number of outstanding gold short contracts was close to 140,000. I think investors will see some higher gold prices later this year.

TGR: Thank you for your insights.


Ralph Aldis, CFA, rejoined U.S. Global Investors as senior mining analyst in November 2001. He is responsible for analyzing gold and precious metals stocks for the World Precious Minerals Fund (UNWPX) and the Gold and Precious Metals Fund (USERX). Aldis also works with the portfolio management team of the Global Resources Fund (PSPFX) to provide tactical analyses of base metal, paper, chemical, steel and non-ferrous industries. Previously, Aldis worked for Eisner Securities, where he was an investment analyst for its high net-worth group and oversaw its mutual fund operations. Before joining Eisner Securities, Aldis worked for 10 years as director of research for U.S. Global Investors, where he applied quantitative skills toward stocks, portfolio tilting, cash optimization and performance attribution analysis. Aldis received a master’s degree in energy and mineral resources from the University of Texas at Austin in 1988 and a Bachelor of Science in geology, cum laude, in 1981, from Stephen F. Austin University. Aldis is a member of the CFA Society of San Antonio.


DISCLOSURE: 
1) Brian Sylvester conducted this interview for The Gold Report and provides services to The Gold Report as an employee or as an independent contractor. 
2) Streetwise Reports does not accept stock in exchange for its services or as sponsorship payment.
3) Ralph Aldis: I was not paid by Streetwise Reports for participating in this interview. Comments and opinions expressed are my own comments and opinions. I had the opportunity to review the interview for accuracy as of the date of the interview and am responsible for the content of the interview. 
4) Interviews are edited for clarity. Streetwise Reports does not make editorial comments or change experts’ statements without their consent. 
5) The interview does not constitute investment advice. Each reader is encouraged to consult with his or her individual financial professional and any action a reader takes as a result of information presented here is his or her own responsibility. By opening this page, each reader accepts and agrees to Streetwise Reports’ terms of use and full legal disclaimer. 
6) From time to time, Streetwise Reports LLC and its directors, officers, employees or members of their families, as well as persons interviewed for articles and interviews on the site, may have a long or short position in securities mentioned and may make purchases and/or sales of those securities in the open market or otherwise.

Streetwise – The Gold Report is Copyright © 2013 by Streetwise Reports LLC. All rights are reserved. Streetwise Reports LLC hereby grants an unrestricted license to use or disseminate this copyrighted material (i) only in whole (and always including this disclaimer), but (ii) never in part.

Streetwise Reports LLC does not guarantee the accuracy or thoroughness of the information reported.

Streetwise Reports LLC receives a fee from companies that are listed on the home page in the In This Issue section. Their sponsor pages may be considered advertising for the purposes of 18 U.S.C. 1734.

Participating companies provide the logos used in The Gold Report. These logos are trademarks and are the property of the individual companies.


The Launch Pad: 1,700 in sight for the S&P, Europe reacts positively to PMI data

24 hour chart

Today

market data new
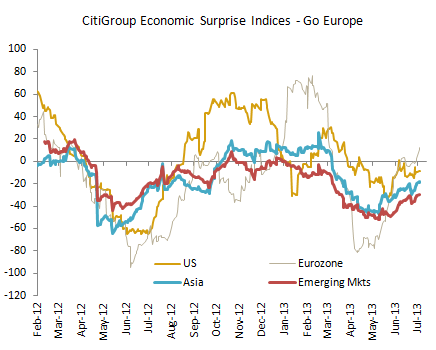
Is the European recession over?  Some are placing their bets that it is.  Quarterly GDP will not be released for another 3 weeks, but we are seeing predictions that the streak of economic contraction, which has lasted the past 6 quarters, will come to an end.  Business Insider’s Joe Weisenthal has put together a few of the arguments.

It is notable that the Euro Stoxx index has risen 22% since the December 2011, when the streak of negative GDP started, and was down 20% for the period of Sept 2009 through Dec 2011 when GDP was positive.  Leading indicator indeed…

Today, Euro shares are powering forward to the tune of 1.2% today following a flat session in the A-Pac region.  Gains are broad based across the zone and led by the banks with 3% days for SocGen and BNP Paribas.  Bond yields are pushing higher as well – particularly in Germany where the 10 year is higher by 6 basis points.  With the German 10 year still only yielding 1.61%, it remains as one of the few sovereigns that hasn’t had a significant correction this summer.

Manufacturing data was strong in Europe and soft in China, say what?  Yes, the HSBC preliminary PMI data for China came in at 47.7 which was below estimates and last month’s reading of 48.2.  A reading below 50 is contraction.  Meanwhile in Europe, PMI came in at 50.3 which was better than the 49.2 estimate and better than last month’s 48.6.  An interesting turn of events.  Germany, as usual led the way in Europe, but other nations had surprising survey results as well.  One of the main drivers is that vehicle demand is on the rise, especially the luxury variety. Bloomberg has more.

The wave of bank preferred share resets continues.  First BNS, then TD, and now BMO is joining the fray as the BMO series 16 preferred shares (BMO.PR.M) are being reset on August 26th to 165 basis points over the 5 year bond (if that was today, the new rate would be 3.40%) for the next 5 years.  This is a significant haircut from the 5.20% dividend it now carries.

Remember, holders have the choice to convert to a series which floats at 165 basis points over the 3 month treasury bill (for a current 2.65%), resetting every quarter.

No surprise here – we are currently using 200 basis points as the line below which banks will extend vs. call in the fixed resets.

Believe in the US housing recovery?  Recent data shows California foreclosures are down 55% year-over-year.  DataQuick provides the hard data city by city on the numbers (sourced, as usual, via Calculated Risk – McBride’s quote: ”It looks like this will be the lowest year for foreclosure starts since 2005, and also below the levels in 1997 through 1999 when prices were rising following the much smaller housing bubble / bust in California”)

We should probably expect more lawsuits like this one surrounding the LIBOR price fixing scandal is coming forth.  The city of Houston is suing a group of banks, citing specific instances where manipulation of LIBOR negatively affected municipal finances.  Bloomberg has more.

The tech sector looks especially strong today thanks to Apple, beating estimates.  Some analysts still can’t shake their doubts about the depth of the current rally, Market watch has even gone so far as to call it the zombie market.  

Remember the two big worries at the beginning of the year;  the fiscal cliff followed by the sequester.  Each of these represented the next big crisis for the markets and both seem to have faded into distant memories as U.S, markets continue to make record highs.  The Washington post took a look at the real effects of the sequester, and of course there is both good and bad news.

The latest MBA Mortgage Applications results are in and it looks like mortgage application have decreases slightly as mortgage rates have been creeping higher. Here are some excerpts from the Latest Weekly Survey

The Refinance Index decreased 1 percent from the previous week driven by a 12 percent drop in the Government Refinance index while the Conventional Refinance index rose by 2 percent. The Refinance Index is at the lowest level since July 2011. The seasonally adjusted Purchase Index decreased 2 percent from one week earlier.

The refinance share of mortgage activity remained unchanged at 63 percent of total applications.

The average contract interest rate for 30-year fixed-rate mortgages with conforming loan balances ($417,500 or less) decreased to 4.58 percent from 4.68 percent, with points decreasing to 0.40 from 0.42 (including the origination fee) for 80 percent loan-to-value ratio (LTV) loans.

The long awaited saga of the Dell buyout should reach its conclusion today.  The story has been mostly between iconic businessmen Michael Dell and Carl Icahn.  There have been endless headlines detailing the public spat with each trying to influence the public opinion in their favour to gain a few extra percentage points in the vote. Just as political elections are determined by precisely who comes out to vote, so it may be with Michael Dell’s proposed $24.4 billion buyout of the computer maker he founded 29 years ago. The investor participation and the know parties against the move to have Dell go private don’t’ bode well for having the deal approved.

Diversion:

Never having seen a forest fire, this video is a rely eye opener as to how fast they can move.

The Speed of Fire

Company News

There is tons of company news this morning.  Let’s begin with the biggie.  Apple reported $7.47 in earnings for Q3 which was better than the $7.30 estimate.  This was down from the same quarter last year but given the lineup of older products, the expectations were pretty low.  Shares are up almost 5% in the pre-market.  Sticking with good news, lots of other tech names are higher this morning.  VMWare is up a whopping 13% after Q2 beat on both earnings and sales plus the company that helps manage server loads, raised their year end view.  EMC is up 4% on solid earnings.  Beyond technology, Eli Lilly posted Q2 of $1.16 above the $1.01 consensus and raised full year guidance range by about 15 cents.  Shares are up 3%.  Boeing reported $1.67 above the $1.58 estimate and reported a record backlog of $410 billion.    Ford reported Q2 of $0.45 which was better than the $0.37 estimates.  The company also raised its pretax profit guidance for 2013. 

There is some bad news, Broadcom is down 9% after reporting a miss on revenue.  Caterpillaris down 2% after reporting $1.45 which was below the $1.68 consensus.  The company also cut its earnings forecast for the year. 

Canadian Pacific reported roughly inline revenue at $1.5B but earnings of $1.43 was below the $1.50 estimate.  Floods appeared to be a problem.  Canadian Natural Resources is buying $223m worth of energy assets from Barrick Gold.   Cenovus Energy reported earnings of $0.34 which appears light with consensus sitting at $0.49.  Rogers reported $0.96 which is a penny below estimates, while subscriber growth was much stronger at 98k vs. 74k estimates.  Encanareported $0.34 compared to estimates of $0.17 and sees year end cash flow at the high end of previous guidance. 

Commodities

Commodities are down a bit this morning with oil off $0.50 and gold down $8.    We will see some US inventories later today at 10:30, expectations are for a 2.8m draw in crude.  Gold has put together a number of decent days yet we still see daily net selling of gold ETFs.

Fixed income and economics

Treasury yields continue their grind higher for a consecutive day, buoyed mostly on risk taking from stronger PMI readings out of Europe. Both German (+50.3) and French (+49.8) purchasing manager index readings improved in July to bring aggregate Eurozone PMI to +50.1 this month. The renewed prospects for an economic turnaround in the beleaguered region are helping markets shrug off a Chinese manufacturing update overnight that reported a drop in their index to 47.7 — a second straight month of contractionary signals. Risk aversion is being pushed to the wayside with stronger corporate earnings out of Apple and Ford as well, with 10 and 30 year Treasury benchmark returns up by nearly 8 basis points (to 2.57% and 3.64%) since the close last Friday. Note the lack of a steepening move in the latter part of the yield curve with the 10-30 spread actually narrowing by 4 basis points over this period. We noted last month that there appeared to be some exhaustion in the long bond with inconclusive Fed tapering talk acting as a ceiling on yield movement (an assertion on low inflation expectations also acted as a barrier). Markets instead moved up the curve and turned the 10 year benchmark into a tug of war with volatility in middle duration Treasuries nearly outpacing their 30 year counterparts. In fact, if you go back just two weeks we’ve seen a yield boundary of more than 25 bps in 10’s versus just 16 bps in the long bond. Expect this to continue until we get more clarity on timing from the Fed’s buyback program.

A quiet session north of the border thus far today with Canada bond benchmarks underperforming Treasury markets slightly. Yields on the US 10 year have not relinquished their lead from late June that saw their returns surge past our domestic benchmark, and despite trading patterns that have more or less remained in lockstep since, we continue to see a lower yield despite higher overnight rates. The lack of steepening in our curve has been notable these past few months as markets are clearly gearing expectations for a more bullish US economy. A $3.3B two year Canada bond auction will be taking place at noon today, but results are likely to be overshadowed by the US $35B 5 year sale at 1PM. We’ll be hoping for a result in our sale that is as strong as the US Treasury department’s from yesterday — the $35B in 2 year notes managed a 3.08 bid to cover with a high yield draw of just 0.336% (both stronger metrics from prior).

Chart of the day

chart o day

Quote of the day

“One of the painful things aboutour time is that those who feel certainty are stupid, and those with any imagination and understanding are filled with doubt and indecision”

– Bertrand Russell (1951)


© 2013 Macquarie Private Wealth Inc.

Macquarie Private Wealth Inc., or their associates, officers or employees may have interests in the financial products referred to in this information by acting in various roles including as investment banker, broker, lender or advisor. Macquarie Private Wealth Inc. or their associates may receive fees, brokerage or commissions for acting in these capacities. In addition, Macquarie Private Wealth Inc. or their associates, officers or employees may buy or sell the financial products as principal or agent. The comments and opinions expressed in this presentation are, except as otherwise noted, the comments and opinions of the Author and may differ from the opinion of Macquarie Private Wealth Inc. (“MPW”) and should not be considered as representative of MPW, belief, opinion, or recommendations. The statements and statistics contained herein have been prepared by sources we believe to be reliable but we cannot represent that they are complete and accurate. This material is published for general information only. MPW and the Author assume no liability for financial decisions based on this information. Readers should obtain professional advice before applying any ideas mentioned to their own personal situation to ensure their individual circumstances have been properly considered. Insurance Products are available through Macquarie Insurance Services Ltd. Links to other websites or references to products, services or publications other than those of Macquarie Private Wealth Inc. (MPW) on this website do not imply the endorsement or approval of such websites, products, services or publications by MPW. MPW makes no representations or warranties with respect to, and is not responsible or liable for, these websites, products, services or publications.

No entity within the Macquarie Group of Companies is registered as a bank or an authorized foreign bank in Canada under the Bank Act, S.C. 1991, c. 46 and no entity within the Macquarie Group of Companies is regulated in Canada as a financial institution, bank holding company or an insurance holding company. Macquarie Bank Limited ABN 46 008 583 542 (MBL) is a company incorporated in Australia and authorized under the Banking Act 1959 (Australia) to conduct banking business in Australia. MBL is not authorized to conduct business in Canada. No entity within the Macquarie Group of Companies other than MBL is an authorized deposit-taking institution for the purposes of the Banking Act 1959 (Australia), and their obligations do not represent deposits or other liabilities of MBL. MBL does not guarantee or otherwise provide assurance in respect of the obligations of any other Macquarie Group company.

Macquarie Private Wealth Inc. is a member of the Canadian Investor Protection Fund and IIROC.

Commodity ETF Flows: Energy Funds Gain; GLD Bleeding Slows; Solar ETFs Outshine

Chart of the Day

For some perspective on the post-financial crisis rally, today’s chart illustrates how much of the downturn that occurred as a result of the financial crisis has been retraced by each of the five major US stock market indexes. For example, the S&P 500 peaked at 1,565.15 back in October 9, 2007 and troughed at 676.53 back on March 9, 2009. The most recent close for the S&P 500 is 1,692.39 — it has retraced 114.3% of its financial crisis bear market decline. As today’s chart illustrates, each of these five major stock market indices has recouped all losses incurred during the financial crisis (i.e. all are above 100% on today’s chart). However, it has been the often overlooked S&P 400 (mid-cap stocks) that has been the star performer. The S&P 400 has recouped over 160% of its financial crisis decline — a very impressive performance.

Notes:
Where should you invest? The answer may surprise you. Find out right now with the exclusive & Barron’s recommended charts of Chart of the Day Plus.

20130724

Quote of the Day
“What is past is prologue.” – Shakespeare

Events of the Day
August 05, 2013 – PGA Championship begins (ends August 11th)

Stocks of the Day
— Find out which stocks investors are focused on with the most active stocks today.
— Which stocks are making big money? Find out with the biggest stock gainers today.
— What are the largest companies? Find out with the largest companies by market cap.
— Which stocks are the biggest dividend payers? Find out with the highest dividend paying stocks.
— You can also quickly review the performance, dividend yield and market capitalization for each of the Dow Jones Industrial Average Companies as well as for each of the S&P 500 Companies.

Mailing List Info
Chart of the Day is FREE to anyone who subscribes.
To ensure email delivery of Chart of the Day, add mailinglist@chartoftheday.com to your whitelist.

Subscribe to – Chart of the Day

test-php-789