
Stocks & Equities
Ahead of a week full of data and central banks, it is likely unsurprising that volumes were dismal and protection/hedging was sought. Once again we saw dips bought with a rush to get markets green (after the collapse in Asia overnight weighed very modestly on Europe and US markets) but once a few people realized the impact of the Treasury’s latest refunding data (must read) stocks did sell off into the close.
…..read more HERE


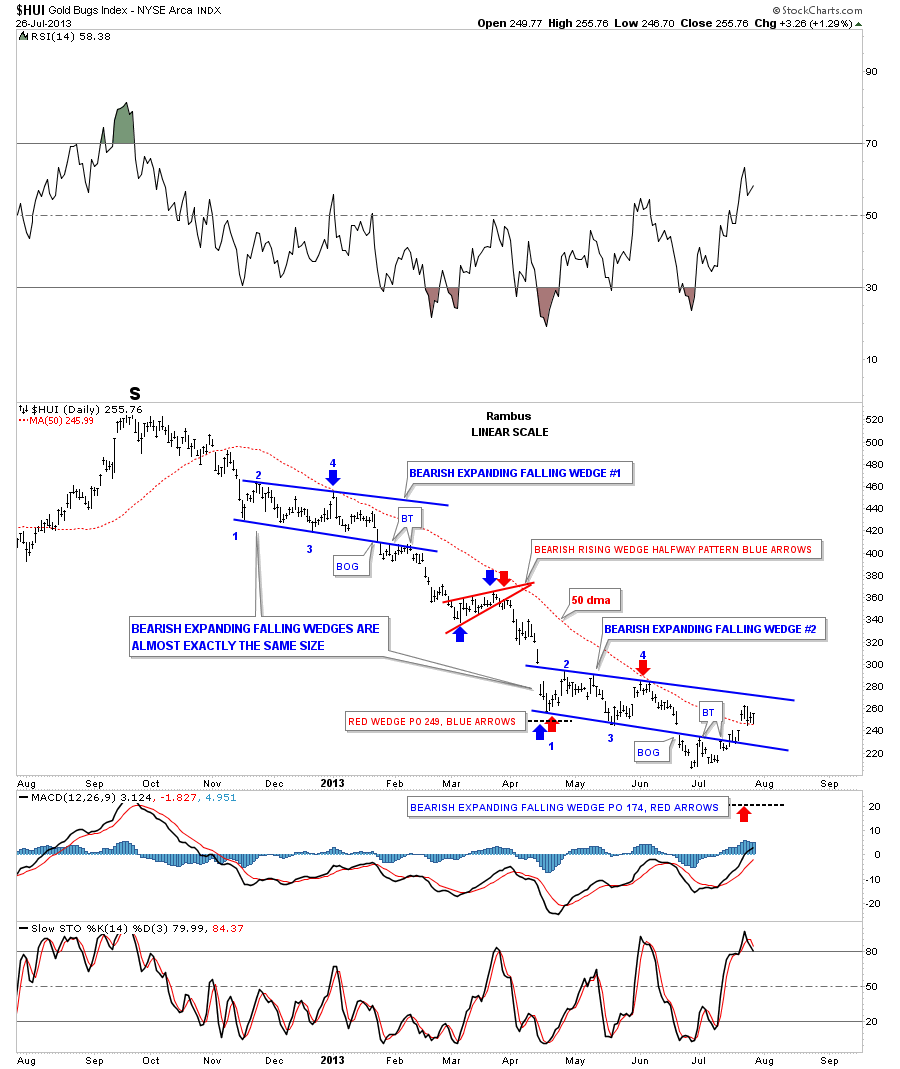
In this Weekend Report lets take an unbiased look at the HUI, gold and silver to see if there are any big changes taking place to upset the apple cart so to speak. Emotions can turn on a dime in the markets, as you are all well aware of, from bearish to bullish or the other way around in a heart beat. That’s what the markets thrive on. Being open to change and not being married to a position is critical to survival when you put your hard earned capital to work in the markets.
Lets start by looking at a daily linear chart for the HUI that shows the decline that started back in September of last year that formed the right shoulder of the massive H&S top pattern that most staunch gold bugs still can’t see. There are three chart patterns I’m going to show you that formed off the right shoulder high to the current low at 205. First I want you to look at the two blue bearish expanding falling wedges labeled #1 and #2. Those two patterns are almost exactly the same in time and height. For those that want to see what I mean just set your chart to linear scale and go back a little over a year. Draw in the top blue expanding falling wedge, as you see on the chart below, and grab your top rail and pull it on top of where the lower blue wedge is forming. Then do the same thing with the bottom rail of blue wedge #1 and take it down to bottom of blue wedge #2. I’ve added two thin black rectangles that shows your how closely they are to each other in time and height, labeled one through four. There is a lot of information on this chart so I’ll post it right here so you can see how similar these two patterns actually are. Then I will post this same chart with some more information that is relevant to our most recent low.
…..read much more HERE

Seasonality refers to particular time frames when stocks/sectors/indices are subjected to and influenced by recurring tendencies that produce patterns that are apparent in the investment valuation. Tendencies can range from weather events (temperature in winter vs. summer, probability of inclement conditions, etc.) to calendar events (quarterly reporting expectations, announcements, etc.). The key is that the tendency is recurring and provides a sustainable probability of performing in a manner consistent to previous results.
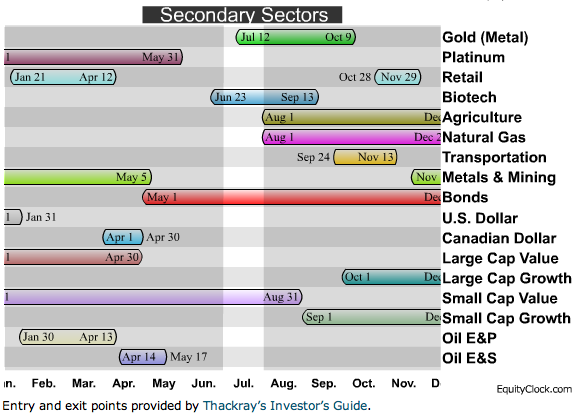
Identified below are the periods of seasonal strength for each market segment, as identified by Brooke Thackray. Each bar will indicate a buy and sell date based upon the optimal holding period for each market sector/index.
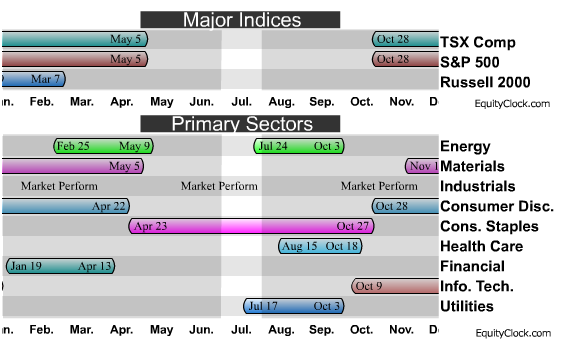
A seasonality study preferably uses at least 10 years of data. Most of our studies use 10-20 years of data, however, data may not always be available for periods greater than 10 years in length. Studies using less than ten years of data can be used, but they tend to be less reliable. Results of shorter term studies have a higher chance of being skewed by a single data point.
About Equity Clock
Equity Clock is a division of the Tech Talk Financial Network, a market analysis company that provides technical, fundamental and seasonality analysis on a daily basis via TimingTheMarkets.com andEquityClock.com. Equity Clock’s mission is to identify periods of reoccurring strength among individual equities in the market using methodologies presented by some of the top analysts in the industry, including that of Don Vialoux, author of TimingTheMarkets.com.
Feel free to use any of the content or seasonality studies (charts, timelines, or otherwise) presented as long as a link-back to this site at EquityClock.com is provided.
For further information on indicators used in reports presented on this site, please visit our reference page.
Horizons AlphaPro Seasonal Rotation ETF (HAC)
Interested in the methodologies and strategies presented by Tech Talk? The Horizons AlphaPro Seasonal Rotation ETF (trading on the Toronto Stock Exchange under symbol HAC) uses a proprietary, seasonal rotation investment strategy developed by research analysts Don Vialoux and Brooke Thackray. The strategy’s core position consists of broad markets at seasonally favourable times of the year and money market securities at seasonally unfavourable times of the year. The strategy allocates from the core portfolio to various sectors when those sectors offer favourable opportunities. Rotating a portfolio in anticipation of these opportunities is designed to deliver returns that are superior to a static investment in broad markets. As seasonal periods are never the same, this investment strategy is supported by additional fundamental and technical analysis.
For more information, Click Here.

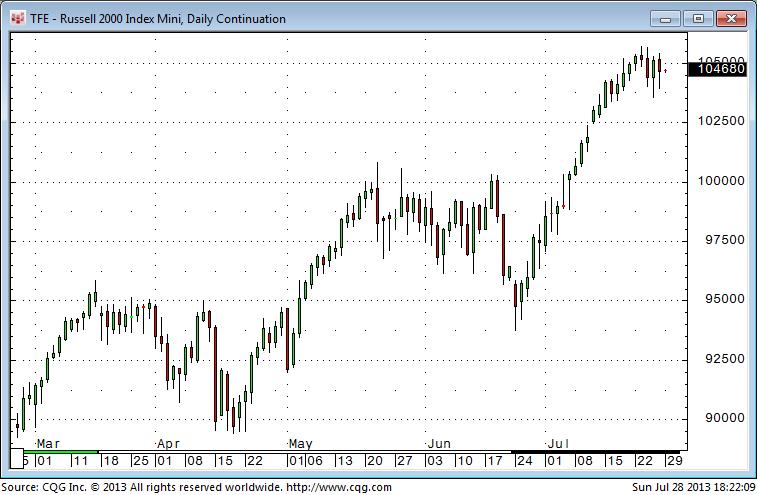
The American stock indices have been the strongest in the world over the past several weeks…and the more speculative American indices (The Nasdaq, the Russell 2000 etc.) have been the strongest of the lot. The American stock indices are now above their May 22 levels, when Bernanke first frightened the markets with hints of “tapering” …however the major European, Canadian, Emerging and Global stock indices are still below their May 22 levels…I view this as “further evidence” that the stock market is getting toppy…despite Central Bank “printing.”
My Stock Market Trading Theme: I’m Anticipating lower prices…I’m just waiting for a confirmation that it’s time to get short.
The S+P 500 benchmark index is now above its May 22 levels:
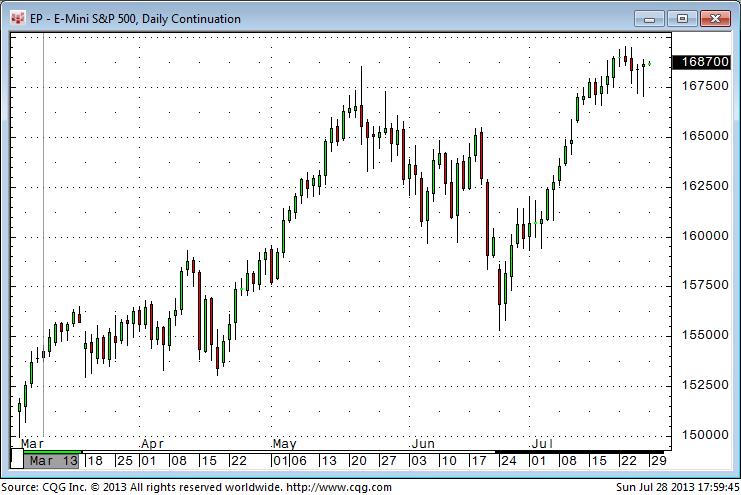
The more speculative Russell 2000 (smaller cap stocks) is well above its May 22 levels and is probably one of the hottest stock indices in the world. My feeling is that when you have the more speculative markets leading the parade, whether it’s in stocks or real estate, you are getting close to a downturn…at least in terms of time, if not in terms of price!
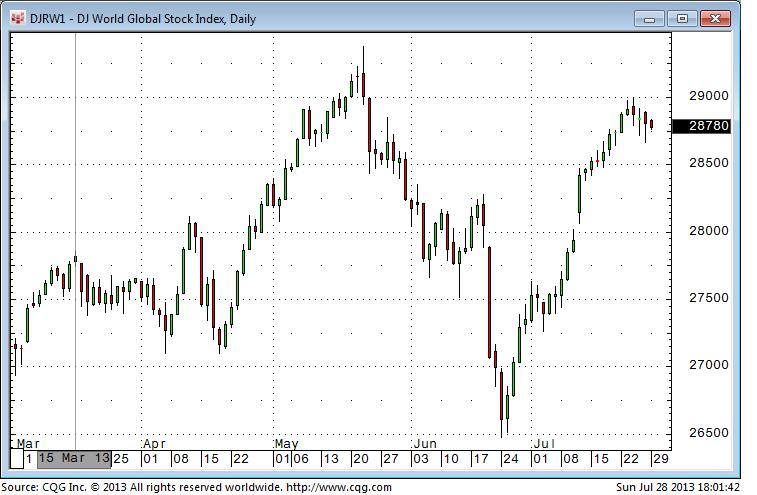
The Dow Jones Global Stock Index (and the benchmark stock indices of the major developed countries) are still below their May 22 highs. This relative strength divergence (and other technical indicators) actually led me to take a small short position in the S+P last week…the position was small because I didn’t really have a confirmation that it was time to manifest my bearish attitude with a short position…I covered the trade with a small profit because I didn’t like the price action and I wanted to be flat ahead of going on the road for a week. Looking at this chart I have to think that May 22 really was a Key Turn Date, despite the rally to new highs in the US markets.
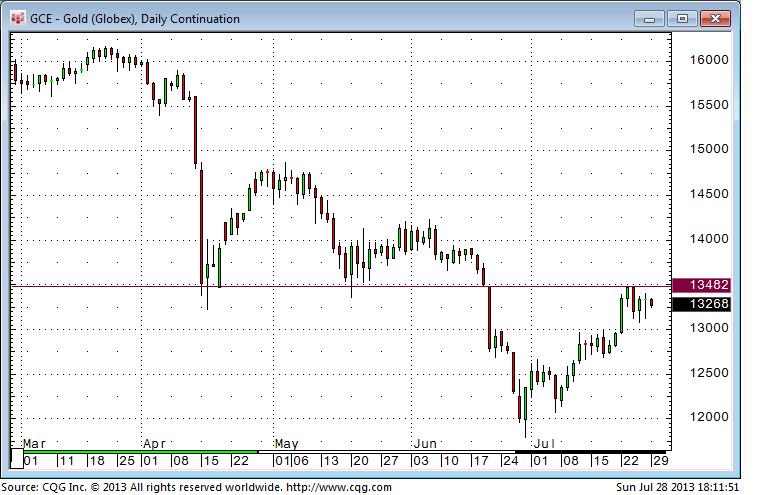
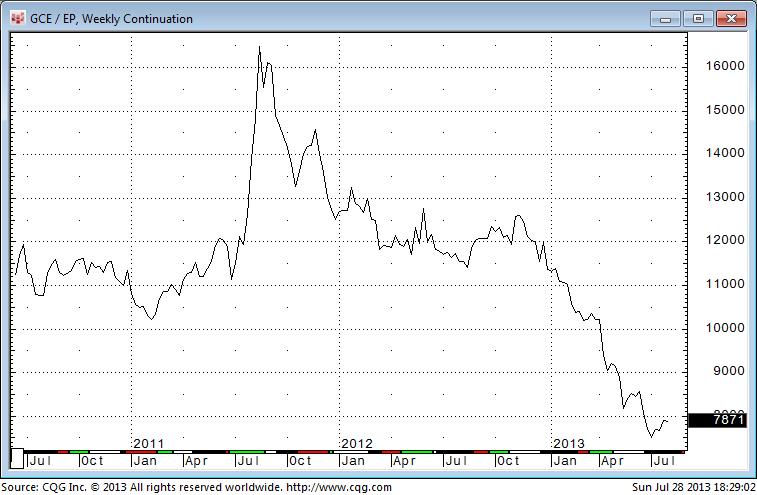
Gold: I bought gold in late June when it was getting extremely oversold…I usually don’t buy a market that is falling…It usually works out better to buy a rising market…but I sold the position Tuesday of last week for a decent profit. I had been concerned about heavy resistance around the $1350 level (gold had sold off hard in April but found a floor around $1350, bounced, then found a floor again around $1350 in May, bounced again, but broke through that floor dramatically in June…in technical analysis once a level that had been a floor is breached…then that floor becomes a ceiling.) After gold rallied through $1300 last Sunday afternoon on the Abe election story it quickly ran into overhead resistance (the ceiling) around $1345 – 50 so I sold out and went to the sidelines.
My Gold Trading Theme: I think the gold rally over the past month was a corrective rally from an extremely oversold condition…I don’t think we’ve found THE bottom of the decline from the Sept 2011 all-time-highs. However…if gold can soon get decisively above $1350 resistance then the next major resistance is nearly $200 higher around $1530 (although $1400-1425 could be a tough hurdle.) If the market now turns lower I think there’s a good chance it will make new lows…BUT…at some point I’m anticipating that Market Psychology will turn bullish on gold…relative to cash and to other assets…especially the stock market.
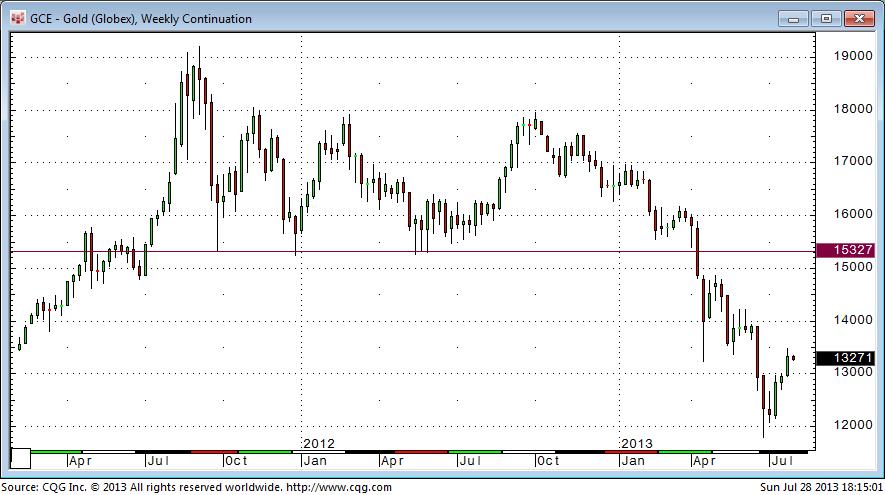
Gold Vs. the Stock Market: Gold fell ~36% in US$ terms from its September 2011 All Time Highs to its June 2013 lows…making a 3 year low…BUT… during the same time period Gold fell even harder in terms of the S+P 500…down ~55% to 5 year lows. I’m watching this ratio closely for a Confirmation that it has turned …I’m Anticipating a buying opportunity here, perhaps as early as this fall.
It’s a short blog this week as I’m taking a summer vacation. I’m currently on the sidelines in my short term trading accounts. There are lots of trading opportunities shaping up in the markets I watch… I’m sure I’m going to miss some of them…and wish I hadn’t…but you gotta take a break now and then and…as a good friend says, “There’s a rumor going around that the markets are going to be open again next week!” Best wishes for good health and good trading!
Futures and futures options are the best way to trade currencies, metals, stock indices and many other financial and commodity markets. Call 604 664 2842 to talk with a futures broker.

-
I know Mike is a very solid investor and respect his opinions very much. So if he says pay attention to this or that - I will.
~ Dale G.
-
I've started managing my own investments so view Michael's site as a one-stop shop from which to get information and perspectives.
~ Dave E.
-
Michael offers easy reading, honest, common sense information that anyone can use in a practical manner.
~ der_al.
-
A sane voice in a scrambled investment world.
~ Ed R.
Inside Edge Pro Contributors

Greg Weldon

Josef Schachter

Tyler Bollhorn

Ryan Irvine

Paul Beattie

Martin Straith

Patrick Ceresna

Mark Leibovit

James Thorne

Victor Adair