
Currency
Applications for unemployment insurance payments declined by 19,000 to 326,000 in the week ended July 27, the fewest since January 2008, from a revised 345,000 the prior week, the Labor Department reported today in Washington

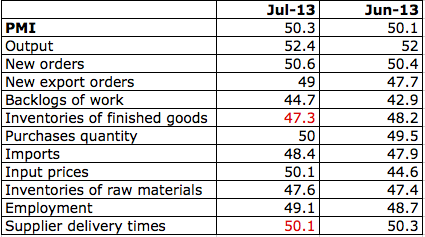
Manufacturing in the U.S. expanded at the fastest pace in more than two years as orders and production jumped, indicating more factories were growing optimistic about the second half of the year.
The Institute for Supply Management’s factory index increased to 55.4, the strongest since June 2011 and exceeding the highest projection in a Bloomberg survey of economists, after 50.9 in the prior month, the Tempe, Arizona-based group’s report showed today. Readings above 50 indicate expansion, and the median forecast of 84 economists surveyed by Bloomberg called for an advance to 52.
….read more HERE

The Bloomberg Consumer Comfort Index rose to minus 27 in the period ended July 28, the strongest reading since January 2008, from minus 27.3 a week earlier. The margin of error for the headline figure is 3 percentage points. Measures of personal finances and buying climate were also little changed.
….read more HERE

Was the March 2009 low the end of a secular bear market and the beginning of a secular bull? Without crystal ball, we simply don’t know.
One thing we can do is examine the past to broaden our understanding of the range of possibilities. An obvious feature of this inflation-adjusted is the pattern of long-term alternations between up-and down-trends. Market historians call these “secular” bull and bear markets from the Latin word saeculum“long period of time” (in contrast to aeternus“eternal” — the type of bull market we fantasize about).
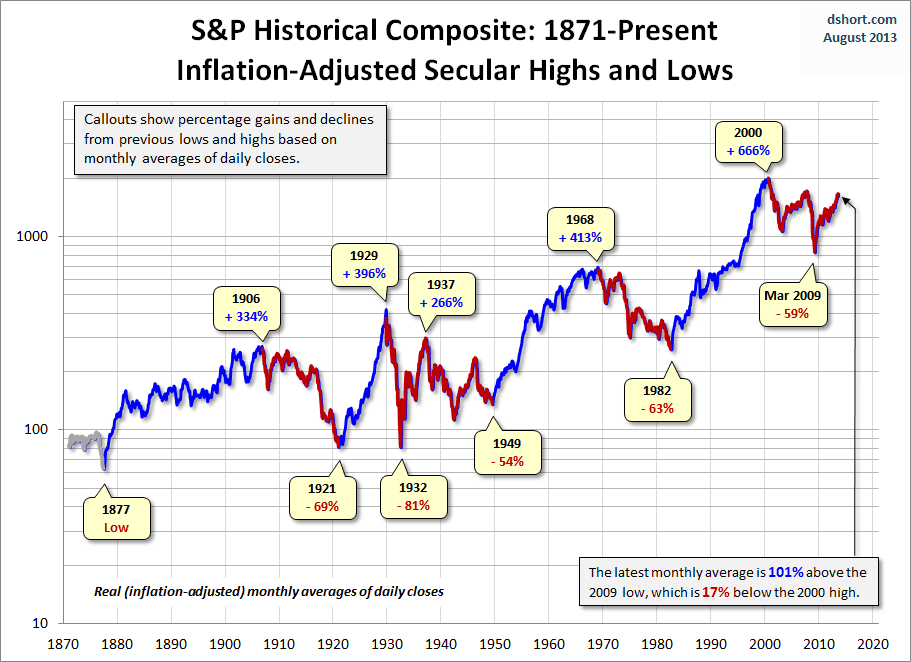
The key word on the chart above is secular. The implicit rule I’m following is that blue shows secular trends that lead to new all-time real highs. Periods in between are secular bear markets, regardless of their cyclical rallies. For example, the rally from 1932 to 1937, despite its strength, remains a cycle in a secular bear market. At its peak in 1937, the index was 29% below the real all-time high of 1929. For a scholarly study of secular bear markets, which highlights the same key turning points, see Russell Napier’s Anatomy of the Bear: Lessons from Wall Street’s Four Great Bottoms.
If we study the data underlying the chart, we can extract a number of interesting facts about these secular patterns (note that for the table below I am including the 1932-1937 rally):
….read more HERE

-
I know Mike is a very solid investor and respect his opinions very much. So if he says pay attention to this or that - I will.
~ Dale G.
-
I've started managing my own investments so view Michael's site as a one-stop shop from which to get information and perspectives.
~ Dave E.
-
Michael offers easy reading, honest, common sense information that anyone can use in a practical manner.
~ der_al.
-
A sane voice in a scrambled investment world.
~ Ed R.
Inside Edge Pro Contributors

Greg Weldon

Josef Schachter

Tyler Bollhorn

Ryan Irvine

Paul Beattie

Martin Straith

Patrick Ceresna

Mark Leibovit

James Thorne

Victor Adair