Stocks & Equities

Marc Faber, the author of “The Gloom, Boom & Doom Report,” says investors need to brace for a drop of 20% or more by the time 2013 closes, predicting a market fallout similar to what was seen in 1987.

“In 1987, we had a very powerful rally, but also earnings were no longer rising substantially, and the market became very overbought,” Faber said Thursday on CNBC. ”The final rally into Aug. 25 occurred with a diminishing number of stocks hitting 52-week highs. In other words, the new-high list was contracting, and we have several breaks in different stocks.”

He noted that during a two-day period this week, as the S&P 500 nears an all-time high of 1,709, there have been 170 new 52-week lows. That means just a relatively few companies are driving the market higher.

….read more HERE

Gold and the Tapering Disconnect

Reflections on “Paper Reserves” of Central Banks; Gold and the Tapering Disconnect

 
In Fed Balance Sheet vs. Stock Market; Will QE Cause Inflation? I posted an interesting chart by reader Tim Wallace of the stock market vs. Fed asset holding (repeated below for convenience).
 
Fed Balance Sheet vs. Stock Market
 
(Click HERE or on chart for larger view)
Stock Market vs Fed Balance Sheet


But what about foreign central bank assets, especially China and Japan?

Reflections on “Paper Reserves” of Central Banks 

Hugo Salinas Prices covers the topic in an excellent article Some Thoughts on ‘International Reserves’

 International reserves, excluding gold, as reported by Bloomberg, courtesy of Doug Noland at www.prudentbear.com on July 26, 2013, stood at $11.167 Trillion dollars.

International reserves, excluding gold, are mainly made up of dollar and euro holdings.

On August 1, 2011, holdings amounted to $10.063 Trillion dollars. One year later, holdings had increased to $10.450 Trillion dollars, an increase of $387 billion dollars.

In the most recent twelve months, holdings have increased by $717 billion dollars, to the present level of $11.167 Trillion dollars.

paper reserves1

International reserves increase when importing countries cannot pay for their imports with exports; in other words, when the importing countries have “trade imbalances” and make up the trade imbalance by sending (mainly) either dollars or euros to the exporting countries.

The increase in “International Reserves Excluding Gold” from 1971 to the present – 42 years – has been spectacular.

It is important to note that “International Reserves” are invested in diverse Bonds, prima facie evidence that trade imbalances have not been settled since 1971. Settlement happens when a debt is paid. If a country owns Bonds, it is a holder of debt and has not been paid. Had the trade imbalances been settled, International Reserves would be not much different from what they were in 1971.

“International Reserves” thus represent credit which the exporting countries of the world have granted to the importing countries which use dollars and euros as money; when these countries tender dollars or euros in “payment”, they are not settling any debt; they are simply running up more debts with the exporting countries. $11.167 Trillion dollars and counting. The Reserves earn interest – they are invested in Bonds – and so the Reserves must also grow, as interest earned accumulates.

When and how will this increase in the debt of the importing countries to the exporting countries find a limit?

10 days, 10 weeks, 10 months, 10 years – nobody knows. But this game is going to end, someday, and its ending will be painful. When the dust settles, a whole new world will replace the present one. We have no idea what it will look like, but it will be here, populated by humanity who will not cease to wonder: “What were they thinking?”

Gold and the Tapering Disconnect

It should be crystal clear this “game” cannot possibly continue forever. Yet, the doves on the Fed, notably Janet Yellen (who amazingly is even more dovish than Bernanke), act and talk as if it can.

Is any “tapering” is going to occur? Certainly the Fed is not going to hike rates, even if some small amount of tapering does occur.

This setup should be good for gold, but it sure hasn’t.

Curiously, the stock market acts as if no tapering is coming, but gold acts as if the Fed is actually about to tighten, not just taper.

As with perpetually rising trade deficits, this disconnect will not go on forever, but I cannot say when it ends, and nor can anyone else.

For more on the balance of trade problem and how to permanently fix it, please see Hugo Salinas Price and Michael Pettis on the Trade Imbalance Dilemma; Gold’s Honest Discipline Revisited

Mike “Mish” Shedlock
http://globaleconomicanalysis.blogspot.com
Read more at http://globaleconomicanalysis.blogspot.com/2013/08/reflections-on-paper-reserves-of.html#akDpoy3qUXx0Ammm.99

The History of Gold & Short Term Analysis

“the chart below inspired by the great work of my late friend, Terry Laundry, shows that the gold market still has quite a bit of work to do to confirm a bottom and a renewed uptrend. The blue line represents the 150 day moving average in conjunction with what Terry referred to as ‘Adaptive Channels’. Yes, we have hit the lower channel and we may have seen the lows, but until we begin to track above the blue line we run the risk of seeing another washout. This comment has little to do with short-term market moves – only longer-term moves. Also, below is an updated chart of Gold seasonality courtesy of my friends Don and Jon Vialoux. Seasonally, we’re right in the time frame for a low in gold. In theory, this could result in a rally well into Winter. This chart is based on twenty years of data and should only be viewed as a complementary indicator in conjunction with other tools including my own VR analysis.”

VRGoldchart

Ed Note: The chart & comment above as well as the remarkable quote below is from Mark Leibovit’s VR Gold Letter that he sends out once a week to subscribers. The comment below is one of 25 that Mark seeks out once a week and includes in his VR Gold Letter, along with his own VR analysis, comments, charts and portfolio updates. You can subscribe HERE

“According to data released by the Shanghai Gold Exchange, the amount of gold contracts settled for physical delivery on its exchange reached a staggering 1,098 metric tonnes year-to-date as of the end of June. 

This is an astoundingly large amount of physical gold. For perspective, 1,098 tonnes represents approximately 40% of the entire estimated global gold mine production in 2013. It also represents roughly 1/8th of the US Treasury’s official gold reserves, and over 100% of China’s stated official gold reserves. If the rate of physical delivery on the Shanghai Gold Exchange continues at current levels, it will deliver the equivalent of over 100% of global mine production by the end of this year… all through one exchange. In contrast, the COMEX futures exchange in New York, where the bulk of US gold futures are traded, saw a measly 160.7 tonnes of physical delivery requests over the same period (year-to-date to June).”

History-of-Gold

Ever since the dawn of civilization gold has been a most highly desired commodity. Whether it is
sought after as an attractive shiny metal, for perceived medical benefits, industrial uses, coinage,
or protection against government created inflation, gold has been in high demand since its discovery.

Gold and The Ancient World

Ancient civilizations discovered gold and it immediately became highly valued for ornamentation,
rituals, and even coinage. Gold is mentioned throughout the Bible. Gold is mentioned at the very
beginning of the Bible, identifying the location of gold deposits when describing the geography of
the Garden of Eden (Genesis 2:11). The Egyptians describe gold in hieroglyphics dating back over
4500 years. The first known map, more than 3000 years old, maps an area of Egypt used to quarry
stones, but includes a gold mine as well. Gold became very popular around the world with gold coins
appearing in Lydia (modern day Turkey) and in China by the 6th century. It entered its own “industrial”
era when Romans began using a crude form of hydraulic mining to extract gold in 25 BC in Spain and
later in Romania. Gold production then shifted to Mali in Africa. With Columbus’s discovery of the
America’s, the vast gold deposits of Central and Southern America opened up, resulting in the vast
wealth of the Spanish Empire and inflation in Europe as the money supply, which was based on the
gold standard, rose to record levels. That gold standard survived for the most part until 1971, bringing
us to today’s floating rate currency system.

The first and most well known use for gold is as jewelry. Again, the Bible mentions gold being used
as jewelry as far back as the time of Abraham. The ancient Egyptians wore gold jewelry and often
buried important people with gold jewelry and masks. Gold is also known to have been used as
jewelry in ancient Sumeria, Crete, Greece, England, and China. It is commonly accepted that gold
was in fact used to make jewelry everywhere it was available. The metal was in high demand in
ancient times and continues to this day for its intrinsic beauty both shiny and colorful. Additionally,
like diamonds and platinum today, gold is also an assertion of wealth and status. Pure gold is very
soft, making it an easy metal to work with to create intricate piece of jewelry. As a result of gold’s
softness, it is usually mixed with other base metals to increase its hardness. Fortunately, gold
alloys are easy to melt down to recover the original pure gold, adding further to its value.

In ancient times, gold was also believed to have healing powers. Stories have it that Cleopatra
maintained her beauty by sleeping in a gold face mask. In ancient Rome, the wealthy treated skin
problems with gold salves. Possibly the most famous ancient cure-all, the Philosopher’s Stone,
was said to be able to turn any metal into gold and create the ÒElixir of LifeÓ, establishing the link
between gold and health forever. No less than Sir Isaac Newton, possibly the greatest scientist in
history, believed in the Philosopher’s Stone and attempted to create it.

The Modern Era

In modern days, gold is in fact used medically in specific instances. Some gold salts are used to
treat arthritis and other similar ailments due to its anti-inflammatory properties. More well known,
gold is often used as crowns and bridges in dentistry. Some cultures consider gold teeth to be
symbols of wealth, as in Central Asia, or just “cool” as in America’s hip-hop culture. Additionally,
gold-198 is sometimes used to treat cancer. In much more recent times, gold has found a number
of industrial uses, mostly in electronics. Gold is a great conductor of electricity and does not corrode,
making it ideal for transmission for use in wires, optical and semi conductors. High end stereo
equipment and cables are known for using gold connectors. Gold is even used as the reflective
layer on some high end CDs. Being extremely malleable, gold can be hammered into very thing
sheets and the resulting  gold leaf is used in artwork or book edge gilding. Gold leaf, flakes, or
dust are sometimes added to food or drinks to show wealth or as a marketing gimmick, such as
in Goldschlþger, Gold Strike, and Goldwasser.

Gold as an Investment

As a trader gold has been utilized as a means to protect ones portfolio against inflation, market
and currency instability. Gold coins have a long history going back thousands of years but more
recent history has seen gold currency replaced by paper currency. Even when most countries
were still on the gold standard, people found it impractical to carry gold with them and instead
carried gold certificates in their wallets. Gold certificates enabled people to deposit their real
gold in the bank in exchange for a piece of paper that was much easier to transport. It also enabled
the bank to lend out the deposited gold and charge interest on that loan while keeping a small
percentage of the gold in reserve for demand deposits, thus creating fractional banking. Today,
gold coins are a type of bullion and not generally used for transactional purposes. The face value
on a gold coin has little relationship to the gold’s real value. However, many find owning gold coins
more practical than owning bullion due to their mass production by government mints, making them
more liquid, with tighter spreads, more easily recognized, and their weights guaranteed by the
minting government. Popular gold coins include the American Gold Eagle, Canadian Gold Maple
Leaf, Australian Gold Kangaroos, and South African Krugerrand. Others prefer using gold bars for
their larger sizes. Additionally, gold futures are settled in gold bars and not coins.

Mining Gold

The high price of gold is caused by supply and demand. While demand for gold is high for the
many reasons mentioned above, supply is limited by the high cost required to extract it in a select
number of locations where the metal can be found in sufficient quantity and quality. During the
age of gold prospecting, individual prospectors flocked to new gold finds. Think of the 1849ers
who went to California in droves to strike it rich. And that was followed by the Klondike Gold Rush
in the 1890s after gold was discovered in Alaska. In those days, prospectors came prepared with
a pickaxe and pan. But with obvious finds used up, the gold mining industry has turned to
technology to find gold.

Gold is now much more difficult to find and extract. Current gold mining yields just 1 to 5 grams of
gold for each 1000 kilograms. Furthermore, gold is only visible to the naked eye at concentrations
of 30 grams per kilograms, requiring advanced technology to find gold deposits. Today, corporations
with major funding use seismic, gravitational, or magnetic tests to search for high concentrations of
gold within the ground. Samples are then taken by digging trenches or drilling down. This is a major
expense and often results in a find with no or little gold.

Once a gold deposit is found, the difficult task of extraction begins. Most often, a method known as
gold cyanidation is used. Tons of earth is dug up and mixed with a cyanide solution. The gold dissolves
within the cyanide, enabling easy collection of the gold-cyanide solution. The gold can then be
collected out of the solution. The current method is to collect the gold using a porous carbon matrix.
Further refining and smelting is then done to remove any other metals still mixed with the gold, such
as silver, copper, mercury, and iron. The cost of this process varies widely, depending mostly on the
concentration of gold within the earth. On April 2, 2009, AngloGold, the third- biggest producer of gold,
said it will produce between 4.9 and 5 million ounces at an average cost between $435 and $450 an
ounce in 2009.

Total gold production was 2500 tons in 2007, the most recent year for which data is available. It is
estimated that 158,000 tons of gold has been mined throughout history is 158,000. If melted and
reformed into a cube, each side would measure 20.2 meters (66 feet).

Economics of Gold

For most of human history, gold has had no “price” since gold was the currency of choice and other
goods were priced in terms of gold. Adam Smith, in The Wealth of Nations, argued that gold indeed
had a price and that all goods and services including gold should be priced in terms of units of labor.
The problem with this, of course, is that each countries labor costs and thus its gold production costs
were different. Still, gold continued to be used as the standard of pricing. However, starting with
modern economic history in the early 1700s, the world gradually shifted to paper currency, at first
backed by gold and later backed by “the full faith and credit” of the issuing government.

In “recent history,” the US adopted the gold standard in 1834 with gold fixed at a price of $20.67 per
troy ounce. This Dollar standard survived until 1933 when President Franklin Roosevelt devalued the
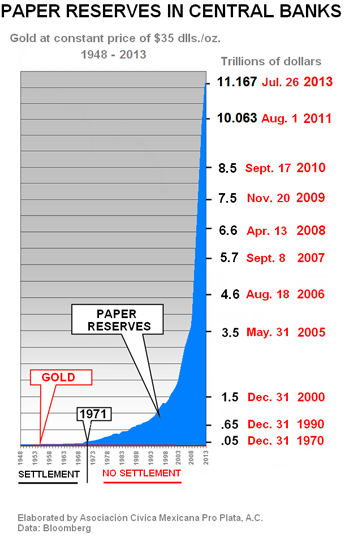
Dollar to $35 per troy ounce of gold in 1933. In 1971, after foreign governments demanded gold in
exchange for their Federal Reserve Notes, draining the US of its gold bullion, the US finally ended
its tie to the gold standard. Without a gold standard and the Federal Reserve free to print money and
expand credit, the United States saw a surge in inflation and gold prices rose dramatically. By 1980,
gold had risen to $850, twenty-four times its price from just nine years earlier. After that bout of extreme
inflation, the US Central Banks went into an anti-inflation mindset that drove the rate of price inflation
down from 15% to near zero and gold fell by 70% to $250 as of 1999. But memories are short and the
Federal Reserve started worrying about defilation in the recession and market crash of 2000-2003.
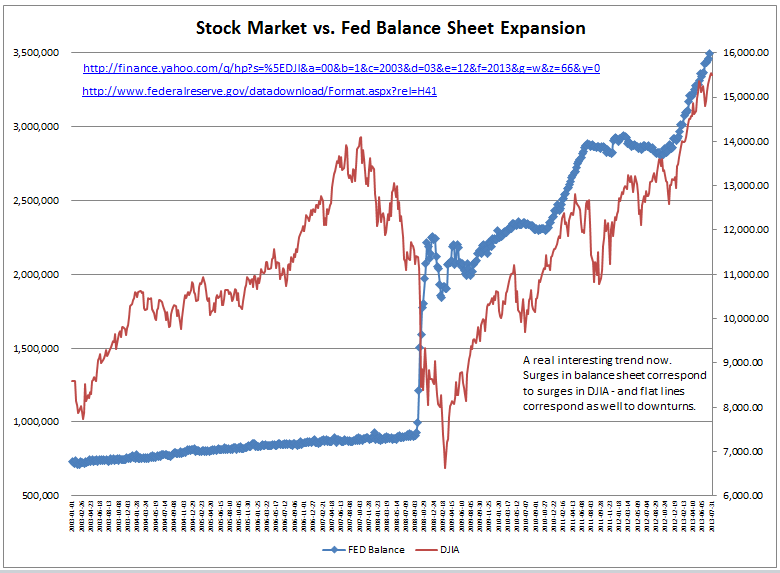
The Fed again started expanding credit, creating a huge real estate bubble. When the bubble burst,
the Fed attempted to fix the problem with an even greater expansion of credit. As a result of this record
breaking credit expansion, gold set a new record high of $1,023 in 2008.

Rumors and Truth

Fort Knox is said to be the most impregnable vault on Earth: built out of granite, sealed behind a
22-tonne door, located on a US military base and watched over day and night by army units with
tanks, heavy artillery and Apache helicopter gunships at their disposal.

Since its construction in 1937 the treasures locked inside Fort Knox have included the US Declaration
of Independence, the Gettysburg Address, three volumes of the Gutenberg Bible and Magna Carta.
A month after President Nixon resigned over the Watergate affair Congress demanded to inspect
the contents of Fort Knox but the trip to Kentucky was dismissed by critics as a photo opportunity.
Three years earlier Mr. Nixon brought an end to the gold standard when France and Switzerland
demanded to redeem their dollar holdings for gold amid the soaring cost of the Vietnam War.

Ron Paul, the Texas Congressman and former Republican presidential candidate, is concerned
how much gold remains stored there and who owns it. He is worried that no independent auditors
appear to have had access to the reported $137 billion stockpile of brick-shaped gold bars in Fort
Knox since the era of President Eisenhower. Mr Paul has so far attracted 21 co-sponsors for a
Bill to conduct an independent audit of the Federal Reserve System – including its claims to Fort
Knox gold. Many gold investors suspect that the US has periodically attempted to flood the market
with Fort Knox gold to keep prices low and the dollar high – perhaps through international swap
agreements with other central banks – but facts remain scarce and the US Treasury denies that
any such meddling has gone on for at least the past decade. The website of the US Mint says
that the 147.3 million troy ounces of gold in Fort Knox Òis held as an asset of the USÓ.
It does not elaborate.

Paul Craig Roberts was Assistant Secretary of the Treasury in the Reagan administration. He is
coauthor of ÔThe Tyranny of Good IntentionsÕ writes: “If incompetence in Washington, the type
of incompetence that produced the current economic crisis, destroys the dollar as reserve currency,
the “unipower” will overnight become a third world country, unable to pay for its imports or to sustain
its standard of living. How long can the US government protect the dollar’s value by leasing its gold
to bullion dealers who sell it, thereby holding down the gold price? Given the incompetence in
Washington and on Wall Street, our best hope is that the rest of the world is even less competent
and even in deeper trouble. In this event, the US dollar might survive as the least valueless of the
world’s fiat currencies.”

Conclusion

Today, there is heightened interest in gold again as a “store of value,” a way to hedge your investments
against government induced inflation and an unstable stock market. Gold did not become the de facto
currency of the world by a singular event and no government law can remove the demand to
own and use gold.

Through the free market, individuals found that using gold, and silver to a lesser extent, enabled
transactions to occur between two parties regardless of the goods they traded. Various cultures and
peoples have tried to use other items for currency throughout history: shells, grains, tobacco, precious
gems, works of art and paper, for short periods without success. Gold however, continues to create
marketsdue to its relative scarcity in addition to the worlds demand for it in modern technologies and
in jewelry. The United States may enjoy the world’s highest credit rating as the largest economy, most
powerful military, and its 220 year history of continuous representative government. However, the value
of its currency has come under scrutiny today. The history of gold currency however, goes back
thousands of years through the ancient civilizations of the Egyptians, Sumerians, and Chinese, through
multiple world wars and continues today reflected in the worlds gold reserves. Gold is a survivor in this
test of time and, in these unstable economic times gold reemerges as a time tested tool for asset
protection. Gold has never gone to zero as has the value of securities ranging from sovereign debt
(the debt of nations) to individual companies. It is indeed THE store of value for all recorded history!


Possible Short-Term Top; No Bear Market on the Horizon

We are starting to see weakening in breadth data that is suggestive of a possible short-term correction in the market. With the highly anticipated upcoming September 17-18 FOMC meeting, we could be in store for some volatility and market weakness.

While it is highly anticipated that the Fed will begin to taper its quantitative easing (QE) program next month, what the market is uncertain about is by how much and at what pace. This uncertainty will likely keep the market’s near-term upside potential limited and may open up a small correction or consolidation.

Once we have the uncertainty behind us the markets are likely to head to new highs given how robust the market currently is (excluding short-term divergences) as well as having an accelerating economy, as seen by the sharply rising service and manufacturing PMIs that were released last week.

One negative divergence I am seeing is the 200-day moving average (200d MA) for the daily NYSE advance-decline line, which is diverging with the S&P 500, as is the 20d SMA of the NYSE percent new highs minus new lows. While we are seeing some negative divergences in the two indicators below, they remain in positive territory and we would need to see dips into negative territory before even remotely considering the potential for a major market top.

(Click HERE or on image for larger view)

01-Divergences


….2 more charts & read more HERE


RelatedJeff Saut: The Market Is Overbought – Raise Some Cash

Related: Martin Armstrong: Dow May Double by Late 2015

Stock Market Action Alert Bull….But


….IF SPX 1685 IS BROKEN, THE RISK OF A 5% TO 10% DIP IMPROVES.

Screen Shot 2013-08-09 at 2.04.14 AM

Applying some ‘guerilla tactics’ for VRtrader Platinum subscribers, having purchased inverse ETFs on yesterday’s opening, I decided to ‘ring the register’ when equities sold off midday and when it became apparent that 1685 support in the S&P 500 held. The impact of ‘Turnaround Tuesday’ and ‘Weird Wollie Wednesday’ may now be behind us setting the stage for a further bounce during the upcoming Options Expiration week. For the short-term, I believe Thursday’s lows holding are the key. That said, there is no guarantee we’re going to surge to new highs right away, nor that we’ve eliminated the risk of a further correction during August. We also have to keep an eye out for the potential perils of September and October.

Recall, my original forecast or 2013 was for a positive (bullish) year to be followed by weakness during 2014 and possibly 2015. The party is not quite over YET, so long as Central Bankers feel the way to nirvana is via the printing press.

Equities began the session with modest gains after upbeat data from China helped ease some concerns regarding the pace of global growth. The Middle Kingdom reported an increase in exports (+5.1% actual, +3.0% expected) and imports (+10.9% actual, +2.1% forecast) while its trade surplus narrowed to $17.82 billion from $27.10 billion.

The slide in equities and dollar/yen was halted shortly after the first hour of action. Stocks then returned to their highs but the S&P was unable to reclaim the 1,700 level.

In Thursday’s economic data, the initial claims level increased from an upwardly revised 328,000 (from 326,000) for the week ending July 27 to 333,000 for the week ending August 3. The Briefing.com consensus expected the initial claims level to increase to 340,000. Even though the claims level increased this week, the headline number is actually a strong positive sign for the labor market. Throughout July, the initial claims data were distorted by seasonal adjustment problems from the motor vehicle industry. The Department of Labor announced that this week’s claims data were unaffected by seasonal biases. That means the initial claims, which were around 350,000 prior to the distortions, actually improved throughout July.

Today, June wholesale inventories will be reported at 10:00 ET.

Here are the new AAII Survey (Sentiment) results for this week:

Bullish: 39.5%
Neutral: 33.9%
Bearish: 26.6%

Change from Last Week:

Bullish: +3.9
Neutral: -5.5
Bearish: +1.6

Long-Term Average:

Bullish: 39.0%
Neutral: 30.5%
Bearish: 30.5%

Note: The AAII survey is based on a 6-month outlook. AAII voting is open all week to its members. At the AAII Website, you can download a spreadsheet which contains historical sentiment survey results back to 1987.
——————————————- 
Following a three-day decline, the Dow Industrials were up 27.65 at 15498.32. A ‘Key Reversal’ pattern was formed to the upside so Thursday’s intraday low of 15418.60 now becomes important support. VRtrader Platinum subscribers bought and sold the inverse ETF for the DJ (DOG) earlier in the session. As you know, the DJ traded at a new record high at 15658.43 on Friday. Once the rally resumes the next big upside target in VR analysis would place the DJ into the 16000.00 to 16250.00 range. Support at 15150.00.
——————————————–
The S&P 500 was up 6.57 at 1697.48 – once again holding important support at 1685.00 intraday. That is the reason VRtrader Platinum subscribers were instructed to traded the DOG (mentioned above) along with the PSQ (the inverse ETF for the Nasdsaq 100). Once the rally resumes, unfulfilled upside targets include 1730, 1757.00 and potentially 1805.00. Support lies at 1685 and then 1659.00. A new record high was posted on August 2 at 1709.67.
——————————————–
The Dow Transports were up 52.08 at 6521.29. The Transports touched 6686.86, a new record high on August but were since negatively diverging as other major indexes rallied. We have to wait for a breakout here to give the bulls more ammunition. The next big technical target is 6900.00. On a bigger picture basis, a ‘theoretical’ bullish reverse ‘head and shoulders’ pattern has formed pointing to potentially 8900.00 in the Transports. There is no time associated with that projection. Downside support lies at 6180.00.
——————————————
The Russell 2000 was up 5.13 at 1049.47. The Russell raded at a new record high intraday Monday at 1063.52. 
——————————————
The Nasdaq Composite was up 15.11 at 3669.12. A Leibovit Negative VR was posted on Tuesday confirming a short-term top and following a seven day consecutive advance that pushed to a new record high at 3694.19 intraday on August 5 – a high 100 points away from my still unfulfilled technical target fo 3800. VRtrader Platinum subscribers successfully traded PSQ (the inverse ETF for the Nasdaq 100 on Thursday). 
—————————————-
The CBOE Volatility Index (VIX), which measures the cost of using options as insurance against declines in the S&P 500 (i.e., the higher the number, the more fear in the marketplace) was .25 at 12.73. The VIX touched 21.91 intraday on Monday, June 24 – the highest high since the March 15 low of 11.21 – the lowest level since February 2007. It was unchanged at on Friday. The higher we go in the VIX, the more likely a bear cycle is upon us.
—————————————– 
Eight of the nine market sectors were higher on Thursday: 
XLB +1.48% Materials
XLE +0.55% Energy
XLF +0.24% Financial
XLI +0.46% Industrial
XLK +0.33% Technology
XLP +0.53% Consumer Staples
XLU +0.38% Utilities
XLV +0.00% Health Care
XLY +0.67% Consumer Discretionary
———————————————
NYSE Advance/Decline 2719/1294.
NASDAQ Advance/Decline 1482/1026.
NYSE UP volume to DOWN volume was 3 to 1.
NASDAQ UP volume to DOWN volume was 3 to 2.
——————————————–
From the VRtrader.com website here is a link to World Market Indices: 
http://www.vrtrader.com/vr_free/worldmarkets/index.asp
——————————————- 
ECONOMIC CALENDAR: 
(Courtesy of Don Vialoux):

Canadian July Housing Starts to be released at 8:30 AM EDT on Friday are expected to slip to 190,000 from 191,000 in June.

Canadian July Employment to be released at 8:30 AM EDT on Friday is expected to increase 6,000 versus a decline of 400 in June. The July Unemployment Rate is expected to remain unchanged from June at 7.1%.

Ed Note:This is a single comment isolated from a one of of the 4 Email Alerts Mark sends out every day for his VRPlatinum Newsletter Service. You can sign up for Mark’s Special Trial Offer

Here is the Special Trial Offer:

Use this month to kick our tires. Pay 50% for the first 30 days (No refund) and sample our Silver or Platinum service and then decide what works best for you. If you aren’t 100% ready to move forward, simply email us to cancel one week before your 30 day 50% off trial subscription ends and it will be canceled and you will not be charged ANY FURTHER, no questions asked. Just send an email to mark.vrtrader@gmail.com or call 928-282-1275 to cancel. You will receive an emailed confirmation of your cancellation at that time.