Bonds & Interest Rates

There is more evidence that the Federal Reserve is falling out of love with asset purchases.

Economists at the San Francisco Fed Bank released a paper on Monday estimating that asset purchases, also known as quantitative easing, add only “a moderate  boost” to economic growth.

And that boost itself is dicey, as it really depends on the central bank promising not to raise short-term interest rates, the study found.

The economic letter, written by Vasco Curdia and Andrea Ferrero, senior economists at the San Francisco regional bank, focused on the Fed’s second round of asset purchases: $600 billion of long-term Treasurys purchased between November 2010 and June 2011. The economists said the purchases added about 0.13 percentage point to real GDP growth.

And without the guidance from the Fed that  rates would be held close to zero, QE2 would only have added 0.04 percentage point to growth, the economists found.

There was no discussion of the cost of QE2 in the paper.

The Fed is currently buying $85 billion a month in Treasurys and mortgage related assets. It has signaled it wants to pull back the stimulus. Charles Evans, the president of the Chicago Fed, estimated that the central bank will buy $1.2 trillion of assets once the third round of the program is completed.

The study fits with the view of some monetary policy experts who argue that asset purchases are really just “earnest money,” or a signal to markets that the Fed is going to keep interest rates low for longer. In other words, while the Fed is buying assets, it won’t be raising rates.

According to this view, once the Fed starts to taper asset purchases, the market will quickly turn its attention to when the Fed will hike rates.

The study itself concludes:  ”Communication about when the Fed will begin to raise the federal funds rate from its near-zero level will be more important than signals about the precise timing of the end of QE3.”

U.S. stocks turned lower on Tuesday, with the S&P 500 extending losses into a third session, after retail sales rose less than estimated in July.

A report released by the Commerce Department ahead of the open had retail sales rising 0.2% last month after a 0.6% gain in June that was larger than initially estimated.

“Consumers are still spending, although limited income growth appears to also be holding spending increases in check,” Jim Baird, chief investment officer at Plante Moran Financial Advisors, wrote in emailed research.

Gold: The Hidden Agenda Behind the Bear Raid

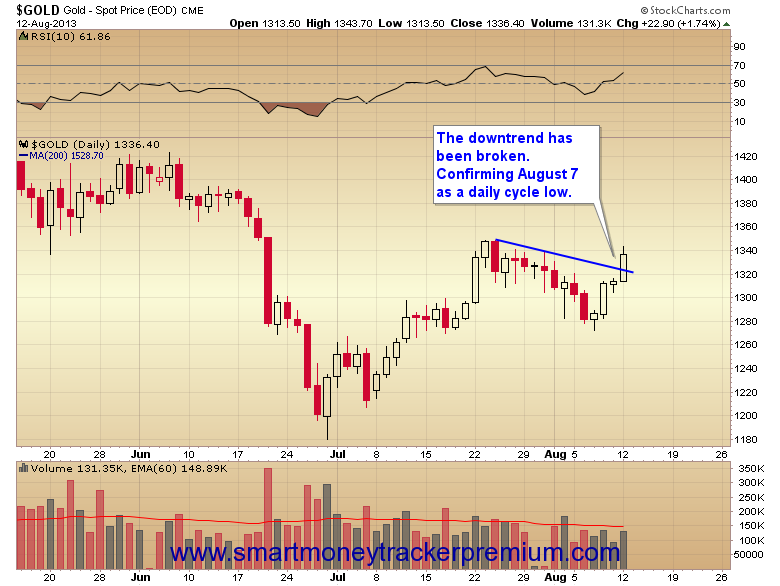
First off let’s go over the key cyclical points from today’s action.

Today gold broke above the cycle downtrend line, thus confirming August 7 as a daily cycle low.

gold-trend-line-break
  
…..read & view 8 more charts HERE

China’s real estate bubble

China’s economy has become the second largest in the world, but its rapid growth may have created the largest housing bubble in history.

imagesDuring the global consumer credit bubble from 2002-2007, China received an unprecedented surge of cash flow from our “dumb” consumer levered-spending across the developed world. What did they do with all that suddenly found wealth? What most humans do in such circumstances: they made a bunch of bad and unproductive spending choices. In 2008 when the cash flow bubble from exports finally burst, the Chinese government responded with more bad decisions, levering up to try and reignite hyper-growth in the economy. Now 5 years later, western cash flow has not come back, and the Chinese economy is slumping neck deep in a domestic debt bubble of its own making. While it was the country that rolled out the relatively largest stimulus package during the 2008 Great recession, China is not now able to rescue the global economy in the next leg of the post-credit bubble recession.

  1. The technical outlook for gold, silver, and mining companies continues to improve. Please click here now . That’s the daily gold chart, and it looks excellent.
  2. First, note the position of my stokeillator (14,7,7 Stochastics series), at the bottom of the chart. The lines are touching, and close to generating a key buy signal.
  3. Furthermore, this potential buy signal is occurring with the lead line near the 50 level, which is where powerful momentum-based price rallies can begin.
  4. Note the action of the moving averages (MA). For intermediate term moves, I like to focus on the 50,5 MA series. A moving average sell signal occurred last fall, with gold trading near $1700.
  5. Finally, over the past two days, a moving average buy signal has been generated.
  6. There is powerful sell-side HSR (horizontal support & resistance) in the $1320 – $1350 area, but these technical buy signals are beginning to attract the attention of analysts at major banks. The technical “fuel” to move gold above $1350 is now in the market.
  7. Silver is a particularly interesting commodity right now. The April & June declines took silver below where it was trading before quantitative easing began.
  8. The Fed has been very clear that it remains committed to stimulus and to a low interest rate environment. In my professional opinion, the price of silver should not be trading now, below where it was when QE started. I think silver traders overreacted to “taper time” talk, and a sizable rally is very likely.    
  9. Please click here now . You are looking at the daily chart for silver. My stokeillator is flashing a strong buy signal, and so is the 50,5 MA (moving average series). 
  10. Silver and gold stocks can be good leading indicators for the gold price. Over the past two days, silver has traded well above its July highs. 
  11. The July highs in the $20.50 area have now become buy-side HSR.Momentum-oriented traders will likely be taking note of the improving technical situation for silver, and placing buy orders.
  12. There is no free ride in markets, and gold is no exception to that rule. Please click here now . That’s a daily chart of the US dollar versus the Indian rupee. Unfortunately, the dollar has surged to another new high.
  13. India’s government and central bank have enacted very tough gold import rules, to combat the strength of the dollar, but so far, that’s not working. 
  14. The Indian government blames gold imports for the CAD (current account deficit), because gold is bought with US dollars rather than with rupees. There are rumours that stronger rules are coming, and those rules could also extend to the silver market, to prevent substitution.
  15. I think it will take about a year for the Indian current account deficit to stabilize. QE tapering is likely already factored into the gold price by most institutional traders, so the rupee chart is the only really negative factor that I see for gold, at least for the next few months. In the intermediate term, the bulls seem ready to dominate the bears.
  16. The daily T-bond chart is slightly concerning, but only on a very short term basis. Please click here now . That’s the daily T-bond chart. I don’t think Ben Bernanke has “lost control” of the bond market at all. If he had lost control, the dollar wouldn’t be drifting lower. It would be crashing. Bonds would also be crashing, and that’s not happening.
  17. Take note of the 136 level on the T-bond chart. If bond prices can move above that, it could help gold surge towards $1400. The T-bond stokeillator looks good, and the stock market is entering “crash season” (September – October), after a multi-year advance that has attracted a number of retail investors. 
  18. A bond market rally is very probable in this environment, as “smart money” institutional managers look to lock in stock market profits. 
  19. There’s more good news for commodity bulls. Reuters News reports this morning that China’s gold buying exceeded 700 tons in the first six months of the year, which is an increase of about 50% over last year. 
     
  20. Also, the nation recently stunned most analysts, with the release of commodity demand statistics for July. Instead of falling, Chinese demand for oil went to an all-time high. 
  21. Clearly, the industrialization of China continues, and that’s great news for commodity investors.
  22. Please click here now . That’s the GDXJ daily chart, and it’s arguably the most exciting chart in the metals sector right now. Since the highs in the $100 area occurred last September, no GDXJ rally could exceed a previous minor trend high. That situation changed yesterday, with the move to $45. Good volume accompanied the price surge. The red downtrend line has been penetrated, which is bullish.
  23. A lot of investors are looking for “the bottom” in gold stocks. Unfortunately, I don’t think that’s a very profitable approach to the market. A rally seems likely here, and it’s arguably already underway, but as 2014 (and real QE tapering) approaches, bank analysts could turn very negative on commodities, and particularly on gold.
  24. It’s very dangerous to assume that precious metal assets will never trade below certain levels in your lifetime. From their recent lows, many junior gold stocks are already up 50% – 100%. Professional investors are booking profits now, while amateurs begin to draw arrows to price targets that are surreal, but emotionally satisfying. If you were able to buy into the recent gold stock carnage, even in a tiny way, it’s important to have a profit-booking mindset now, as price goes higher!

Aug 13, 2013
Stewart Thomson
Graceland Updates
website: www.gracelandupdates.com
email for questions: stewart@gracelandupdates.com 
email to request the free reports: freereports@gracelandupdates.com

Graceland Updates Subscription Service: Note we are privacy oriented. We accept cheques. And credit cards thru PayPal only on our website. For your protection we don’t see your credit card information. Only PayPal does.

Subscribe via major credit cards at Graceland Updates – or make checks payable to: “Stewart Thomson” Mail to: Stewart Thomson / 1276 Lakeview Drive / Oakville, Ontario L6H 2M8 / Canada