
Timing & trends

As strategists, economists, and commentators assess the economic fallout from the temporary shutdown of the U.S. federal government, a consensus of opinion is now pushing out the “Taper” of QE3, the Fed’s policy of printing money, to March.
There is a general belief that the data will not support a Taper at either of the two last Federal Open Market Committee (FOMC) meetings chaired by Ben Bernanke. And, it would certainly be a surprise to see Janet Yellen push for a Taper at the first FOMC meeting that she chairs in January (Yellen may be self-conscious of her reputation as a Super Dove and may try for dramatic gesture in an attempt to counter that, but I think that it would only be a small probability).
March will represent ten months of lapsed time from Bernanke’s first mention of a possible Taper. When he first began climbing down from that suggesting, I had a sense that he wanted to communicate some sort of conclusion to a market that had become addicted to the notion that QE would continue indefinitely. A while after his initial comments, Bernanke went to great lengths to tell us that a decision to Taper would be “data dependent.”
The real question is “how amazing good will the data have to be in order to initiate Tapering?” The economy is never perfect and it is very common to have a few concerns here and there regarding employment and economic growth. There is a sense that the Fed is looking for “Goldilocks” data. With that in mind, it will always be possible to find enough grey clouds in the data to forestall Tapering.
We know that the temporary Band-aids applied to the government shutdown and debt ceiling are set to come off in January and February respectively. So, there will be more threats to employment and economic growth to contend with in the New Year. And, as 2014 is a mid-term election year in the U.S. and since the Fed has traditionally avoided major policy announcements in the run-up to elections so as not to favor one party over another, the window of opportunity for a Taper may end at the June FOMC meeting.
Although consensus expectations are focusing on the March FOMC meeting as the beginning of the Taper, it may very well be the April or June meetings. And, if not those meetings, they we might be looking out to the December 2014 meeting. There is a possibility that it could happen. And if it does, total money printed from all the QE policies going back to November 2008 will total $4.5 trillion.
The one upshot of all this is that at least stocks will benefit from the new “Yellen Put” which will replace the Bernanke Put, which succeeded the Greenspan Put. The upside for stocks may be limited by anemic earnings growth. But, at least the downside might be limited by the continuation of QE3.
The opinions expressed in this report are the opinions of the author and readers should not assume they reflect the opinions or recommendations of Richardson GMP Limited or its affiliates. Assumptions, opinions and estimates constitute the author’s judgment as of the date of this material and are subject to change without notice. We do not warrant the completeness or accuracy of this material, and it should not be relied upon as such. Before acting on any recommendation, you should consider whether it is suitable for your particular circumstances and, if necessary, seek professional advice. Past performance is not indicative of future results.
Richardson GMP Limited, Member Canadian Investor Protection Fund.
Richardson is a trade-mark of James Richardson & Sons, Limited. GMP is a registered trade-mark of GMP Securities L.P. Both used under license by Richardson GMP Limited.

“This trade agreement is an historic win for Canada,” said Prime Minister Harper. “It represents thousands of new jobs for Canadians, and a half-billion new customers for Canadian businesses.”
This is the biggest, most ambitious trade agreement that Canada has ever reached. It covers most aspects of the Canada-EU bilateral economic relationship, including trade in goods and services, investment, and government procurement. It also grants the flexibility to include areas of mutual interest beyond those that have traditionally been included in Canada’s trade agreements, such as regulatory cooperation.

As a general rule, the most successful man in life is the man who has the best information
Vancouver BC is undoubtedly one of the greatest mining centers in the world and British Columbia should be a mining powerhouse, consider:
- Excellent geology
- Good transportation system
- Competitive tax rates
- Strategic location with respect to Asian markets. Two modern ports, Vancouver – Canada’s largest and the Port of Prince Rupert which is the closest of any of North America’s West Coast ports to Asia – up to 58 hours of sailing time shorter
- High quality and easily accessible geological data
- Mining friendly provincial government
- Communities receptive to resource extraction as a livelihood
- Attractive exploration incentives
- BC is the third largest generator of hydro electricity in Canada – one of the lowest power costs in North America. Natural gas is plentiful, cheap and resources are growing
- Some of the most modern education and telecommunications infrastructure in the world
Many of the world’s largest mining companies used to have a strong presence in British Columbia – they left in the 1970’s after the political landscape changed. In the wake of the electoral collapse of the New Democratic Party (NDP) the Gordon Campbell led Liberals won an overwhelming majority in the 2001 provincial election. Since then the Liberal government has been trying to remake B.C. into an investable and attractive place for the mining industry to do business again. Are they succeeding?
Mining Facts from the Mining Association of B.C. (MABC)
- Gross mining revenues for the BC mining industry were $9.2 billion in 2012
- In 2012, the BC mining industry made total payments to the government and government agencies of $504 million
- British Columbia’s mining industry pre-tax net earnings for 2012 was $1.8 billion
- Hiring requirements for all mining sectors in BC, over the next 10 years, are projected to be 16,770 workers under a baseline scenario
- The number of people working in BC’s mining industry in 2012 increased to 10,419 up from 9,310 in 2011
- Average employee earnings rose to $98,200 in 2012, up from $93,900 in 2011
- Capital expenditures fell to $2.7 billion in 2012 from $2.9 billion in 2011
- Vancouver is the world’s leading centre of expertise for mineral exploration.
- Some 1,200 exploration companies are located in British Columbia, most in the greater Vancouver area
- Exploration and development expenditures by survey participants, was $680 million in 2012 compared with $463 million in 2011
- Lead and lead concentrate revenue totalled $194 million in 2012
- Shipments of metallurgical coal rose to 24.2 million tonnes in 2012
- Coal accounts for 39% of the total volume handled at the Port of Vancouver, which moves shipments to China, Japan and other Asian markets
- Metallurgical coal continued to dominate BC’s mining sector in 2012, representing 44% of revenues, followed by copper concentrates at 19%, silver at 10%, zinc and zinc concentrates at 9% and gold at 4%
- Copper concentrate revenue rose to $1.5 billion in 2012 and copper shipments rose to 787,000 tonnes
- Gold: net mining revenues rose significantly in 2012 to $275 million, up from $154 million in 2011
- Molybdenum: net mining revenues in 2012 were $248 million
- Total mining expenditures rose to $9.2 billion in 2012. Mining companies spent more on items such as production materials and supplies, energy and fuels, outward transportation, and machinery, equipment and construction materials
- Zinc and zinc concentrates revenue in 2012 fell slightly to $685 million from $693 million in 2011
- Silver: net mining revenue for 2012 was $760 million
- Cash flow from BC operations in 2012 was $2,230 million
In November of 2010, with a dismal popularity rating as low as nine percent, Premier Campbell announced his resignation. On February 26, 2011, Christy Clark was elected as the party’s new leader and became the 35th Premier of British Columbia.
In September of 2011 Clark introduced her jobs plan, “Clark’s $300-million jobs plan, which she introduced last week after a province wide tour, includes promises of eight new B.C. mines by 2015 and nine upgrades to existing mining operations.
She didn’t name any of the new mines, but spoke glowingly of the economic rewards and family-supporting jobs mines bring to B.C. communities, citing the recently reopened Copper Mountain copper mine at Princeton in the B.C. Interior.
“We need more Princetons,” said Clark about the mine that now employs 10 per cent of the community’s workers.” CBC, Mining industry sees gold with Premier Clark’s plan
Clark is on record promising her jobs plan will return $1.6-billion per year of additional revenue for the government and provide 1,800 new jobs.
Below is a 24 month mining update report published in September 2013 by the Liberals.
Two new mines are operating:
- New Afton Mine, near Kamloops
- Mt Milligan Mine, near Prince George
Five more are under construction or permitted:
- Red Chris Mine, near Dease Lake
- Roman Mine, near Tumbler Ridge
- Quintette Mine, near Tumbler Ridge
- Bonanza Ledge Mine, near Barkerville
- Treasure Mountain Mine, near Hope
Major expansions have been approved for six existing mines:
- Highland Valley Mine, near Ashcroft
- Huckleberry Mine, near Houston
- Quinsam Mine, near Campbell River
- Elkview Mine, near Sparwood
- Endako Mine, near Fraser Lake
- Gibraltar Mine, near Williams Lake
The Notice of Work backlog has been reduced by 80 per cent and the Notice of Work application average turnaround time has been reduced from 110 days to 63 days.
In 2012, more than 30,000 people were working in B.C.’s mining, mineral exploration, and related sectors, more than double the number working in 2001.
The production value of mining in 2001 was $2.8 billion. In 2012, it was $8.3 billion.
Mining is big business
Teck Resources Ltd. (Canada’s largest diversified miner) and Teck Highland Valley Copper Corp. (in which Tech Resources holds a 97.5 percent interest) gave $222,400 to the Liberals – just $62,500 to the NDP.
Teck Resources operates the first six largest (out of the ten largest) mines in B.C.:
- Fording River in Elkford – coal, 2012 revenue $1.45b
- Elkview in Sparwood – coal, 2012 revenue $1.05b
- Highland Valley Copper – copper & moly, 2012 revenue $1.01b
- Greenhills in Elkford – coal, 2012 revenue $845mm
- Line Creek in Soarwood – coal, revenue in 2012 $566mm
- Coal Mtn. – coal, revenue in 2012 was $436mm
Teck was number two on the BCBusiness 100 Biggest Companies in 2013 by Revenue. Out of the top ten revenue producing mines in B.C. eight are coal mines.
Business Vancouver has published a list of the biggest mining companies in B.C. in 2012, the list may be accessed here.
“The mining industry is a cornerstone of our provincial economy.” former BC Premier Gordon Campbell

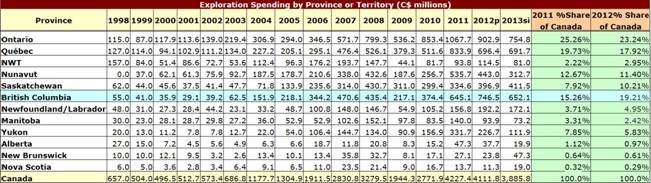
As you can see from the above graphs exploration spending under a Liberal government has exploded from a not so awe inspiring $29.1mm in 2001 under the NDP to an estimated plus $650mm in 2013. Well over two billion dollars worth of exploration (expenditures include exploration and deposit appraisal) have been spent in the province of British Columbia just over the last three years!
Sixty per cent of Canadian exploration companies are based in BC, and 69 per cent of TSX and TSX-V stock exchange listed companies based in BC are involved in the mineral exploration and mining sector.
Junior v Senior
It’s a fact in the mining world that most discoveries are made by junior mining companies and old time individual prospectors. Juniors, not majors, own the worlds future mines and juniors are the ones most adept at finding these future mines. They already own, and find more of, what the world’s larger mining companies need to replace reserves and grow their asset base.
Why are the juniors so successful at making discoveries and finding mines? Well, the good ones are lean mean boots on the ground exploration and development companies run by people who have been out there and know what it takes. They know how to raise money from the suits and they know how to get the story out to the retail investor.
They are not tied up in bureaucratic red tape and can make the important decisions without commissioning a six month study or running it up through 12 layers of pencil pushers and then sitting on their butts waiting for an answer while somebody else scoops the prize. They can and do make up their minds very quickly and can execute immediately on plans.
Old time prospectors are independent minded, bush savvy and, geologically speaking, very knowledgeable. Unfortunately for them they lack the wherewithal to advance their discovery and most often option their property, or project if you will, to a junior they hope will raise money and develop it to the point where a more senior company wants to get involved, or perhaps take it over outright.
It’s hard to invest in a prospector, fortunately if you want to invest in a potential discovery or the building of something of value – be in on the discovery of a mineral deposit and be there as the company moves it down the development path towards a mine there are quality junior companies, both private and public, to choose from. There are enormous opportunities to back excellent management teams with your investment money.
Conclusion
A junior resource companies place in the food chain is to explore for, find and develop, to a certain point, the world’s future mines and nowhere are juniors more important to mining then right here in British Columbia, a vast and under explored treasure trove of minerals.
B.C.’s Liberals say they are committed to opening up the province to free enterprise and that they realize that the exploration for and development of natural resources is a cornerstone of the provincial economy. The terrific rise in exploration dollars being spent in the province says to me many believe what they are saying and trust them to keep their word.
There’s no doubt mining brings a great deal of revenue to the province, but let’s remember one important point – juniors find the deposits and prove them up to the point where a major would step in and buy them. Consider another point – when was the last time you heard of a major mining company making a discovery?
Today the relationship between juniors and majors is so inextricably linked that it’s doubtful a major mining company could replace its mined reserves, let alone grow them, without keeping a close eye on junior’s activities and a check book handy.
Perhaps the importance of junior resource companies in the exploration and mine development food chain should be on all our radar screens but especially so for our dear liberal leaders. Are they on yours?
If not, they should be.
Richard (Rick) Mills
Richard is the owner of Aheadoftheherd.com and invests in the junior resource/bio-tech sectors. His articles have been published on over 400 websites, including:
WallStreetJournal, USAToday, NationalPost, Lewrockwell, MontrealGazette, VancouverSun, CBSnews, HuffingtonPost, Londonthenews, Wealthwire, CalgaryHerald, Forbes, Dallasnews, SGTreport, Vantagewire, Indiatimes, Ninemsn, Ibtimes, Businessweek, HongKongHerald, Moneytalks and the Association of Mining Analysts.
If you’re interested in learning more about the junior resource and bio-med sectors, and quality individual company’s within these sectors, please come and visit us at www.aheadoftheherd.com
If you are interested in advertising on Richard’s site please contact him for more information, rick@aheadoftheherd.com
***
Legal Notice / Disclaimer
This document is not and should not be construed as an offer to sell or the solicitation of an offer to purchase or subscribe for any investment.
Richard Mills has based this document on information obtained from sources he believes to be reliable but which has not been independently verified.
Richard Mills makes no guarantee, representation or warranty and accepts no responsibility or liability as to its accuracy or completeness. Expressions of opinion are those of Richard Mills only and are subject to change without notice. Richard Mills assumes no warranty, liability or guarantee for the current relevance, correctness or completeness of any information provided within this Report and will not be held liable for the consequence of reliance upon any opinion or statement contained herein or any omission.
Furthermore, I, Richard Mills, assume no liability for any direct or indirect loss or damage or, in particular, for lost profit, which you may incur as a result of the use and existence of the information provided within this Report.

 Michael points out that its important to understand what the politicians in the United States have agreed upon, and how it will impact us in Canada.
{mp3}mcbuscomoct18front{/mp3}

“The National Budget must be balanced. The Public Debt must be reduced; the arrogance of the authorities must be moderated and controlled. Payments to foreign governments must be reduced, if the Nation does not want to go bankrupt. People must again learn to work, instead of living on public assistance.” …..Marcus Tullius Cicero (+/- 55 BC).
The current correction in gold started in August 2011 and has now gone on for 112 weeks – (it most likely bottomed on June 28th).
This has been the longest correction since the current bull market started in 2002. The correction of 2006 lasted 71 weeks before a new high was reached. There followed then a 50% price rise, (+85% from bottom to the next top).
The correction of 2008 took 77 weeks before a new high was reached. The gold price then advanced by 80%, (+325% from bottom to next top).
The expectation is for gold to advance by more than 50% as in 2006-2008, and more than 80% as in 2008-2011 during this next ‘leg up’, because of the depth of the current pullback. Because of blatant manipulation of the gold price by large traders dumping oversized lumps of futures contracts during hours when trading is usually sparse; the price of gold is starting this next rally below its normal starting point. This is likely to cause the price to act in slingshot fashion, and may very well surprise a lot of people.
The US debt ceiling has just been pushed upward for the 79th time since 1960, and right after the last raise in 2011, the price of gold rose +17% between August 1st ($1620), and August 22nd ($1898) – that was +17% in just three weeks! A similar reaction by gold at this time could result in price rising quickly from $1281 to $1498.
Here is the gold chart that records the beginning of the current bull market, along with three upside breakouts and the expectation for the next breakout, marked by arrows. (Charts courtesy www.stockcharts.com unless indicated).
The RSI (at top of chart) is ready to rise, the CCI (at upper bottom) is rising from oversold conditions, and the A/C line at the lower bottom is still in uptrend after merely leveling out.
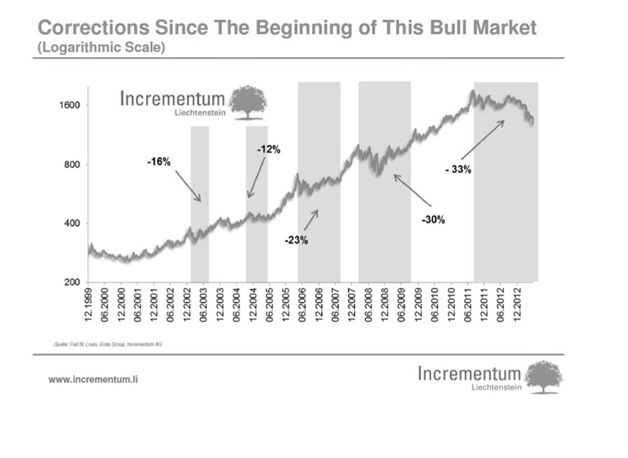
This chart courtesy Incrementum.li shows us that the current correction in the gold price is not unusual, if we accept the principle that the higher the price, the larger the pullback.
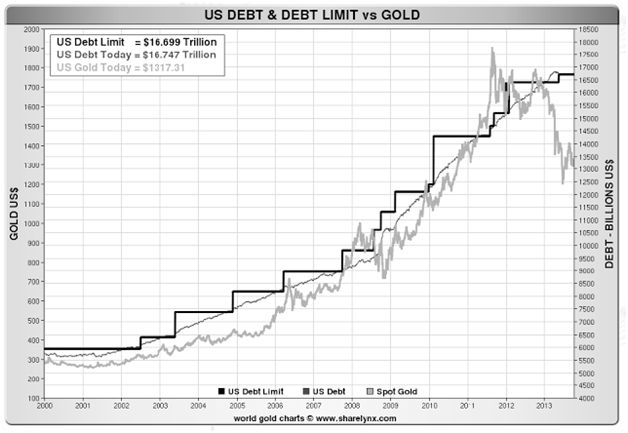
This chart courtesy Sharelynx.com shows a gap that has opened up between the US debt limit and the price of gold. Unless we expect the debt limit to be lowered, (how likely is that), we better prepare our portfolio for a rise in the price of gold, as the rubber band effect takes hold.
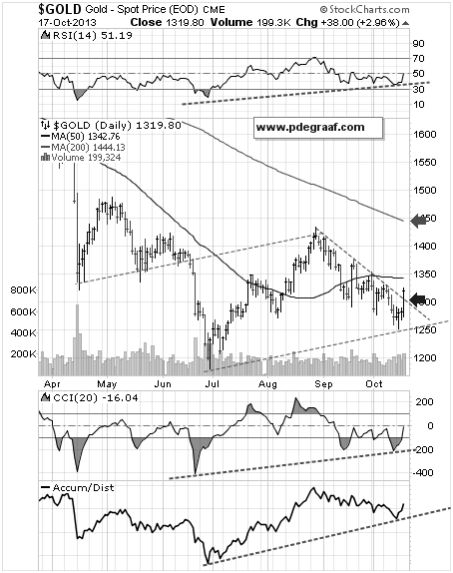
Featured is the daily gold chart. Price is carving out a rising channel that is anchored by two upside reversals (June 28th and Oct 15th). On Oct. 17th price broke out from beneath three months of resistance, with a target at the 200DMA. The three supporting indicators have all turned positive, including the Accumulation/Distribution line. The Gold Direction Indicator (for details www.pdegraaf.com), turned bullish at 55%, compared to 44% on Wednesday.
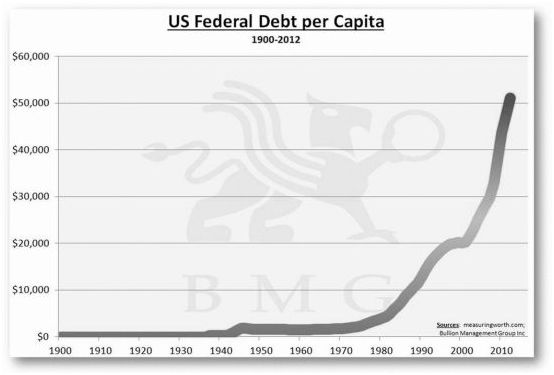
This chart courtesy BMGBullion.com shows the US Federal Debt on a per capita basis. This debt cannot be paid off – it will be inflated away. Gold and silver will be sought as protection against this inflation.
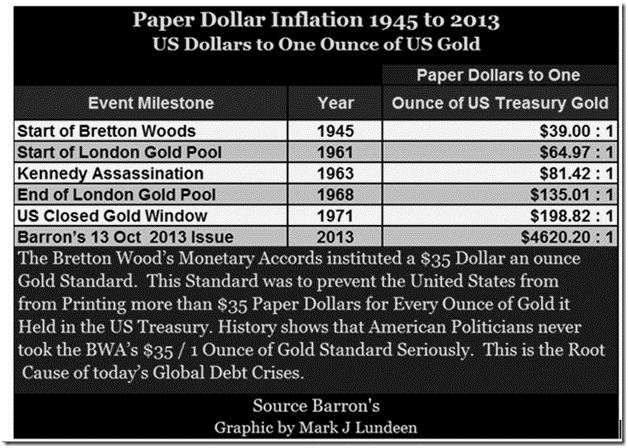
This chart courtesy Mark J. Lundeen shows the number of US dollar bills in circulation, compared to the number of ounces of gold supposedly stored at Fort Knox. (These gold ounces have not been audited since 1953).
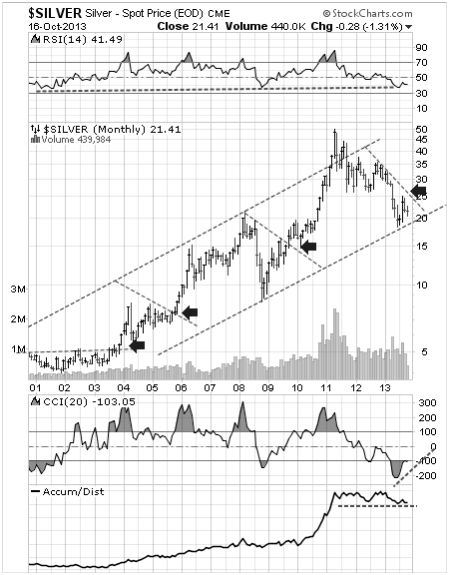
Here is the long-term chart for silver, along with the breakout points after a correction takes place, marked with arrows, including the expectation for the next breakout. The three supporting indicators are beginning to rise up from support levels.
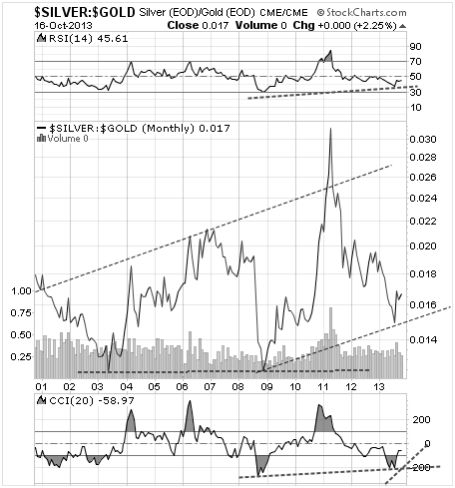
Featured is the index that compares silver to gold. Since the second leg in the double bottoms of 2003 and 2008, the trend has favored silver over gold. The two supporting indicators are turning positive. The target for the current bounce is at the top of the blue channel.
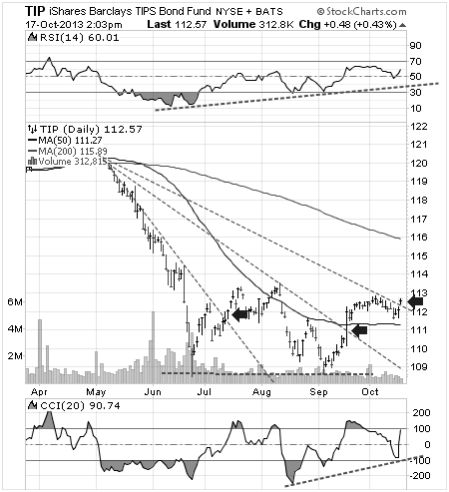
Featured is the daily bar chart for TIP the bond fund that is indexed for inflation. Price dropped sharply in May and June when it was thought that the FED might reduce its bond purchases (TIPs are bonds after all). Recently however the people who buy TIPs are sniffing the first whiffs of price inflation, and the arrows point to breakouts while the supporting indicators are positive. Price inflation is the delayed result of monetary inflation and a source of energy for gold and silver to rise.
“The truly Unique Power of a Central Bank, after all, is the power to create money, and ultimately the power to create is the power to destroy.” …..Paul Volcker, US FED Chairman 1979 – 1987.
*******
Peter Degraaf is an online stocks and bullion trader, with over 50 years of investing experience. He produces a daily report for his many subscribers, in 17 different countries. For a sample copy of a recent report contact him at itiswell@cogeco.net or visit his websitewww.pdegraaf.com
DISCLAIMER: Please do your own due diligence. Peter Degraaf is not responsible for your trading decisions.

-
I know Mike is a very solid investor and respect his opinions very much. So if he says pay attention to this or that - I will.
~ Dale G.
-
I've started managing my own investments so view Michael's site as a one-stop shop from which to get information and perspectives.
~ Dave E.
-
Michael offers easy reading, honest, common sense information that anyone can use in a practical manner.
~ der_al.
-
A sane voice in a scrambled investment world.
~ Ed R.
Inside Edge Pro Contributors

Greg Weldon

Josef Schachter

Tyler Bollhorn

Ryan Irvine

Paul Beattie

Martin Straith

Patrick Ceresna

Mark Leibovit

James Thorne

Victor Adair