
Bonds & Interest Rates
U.S. employers added far fewer workers than expected in September, suggesting a loss of momentum in the economy that would likely add to the Federal Reserve’s caution in deciding when to trim its monthly bond purchases.
Nonfarm payrolls increased 148,000 last month, the Labor Department said on Tuesday. While the job count for August was revised to show more positions created than previously reported, employment gains in July were the weakest since June 2012.
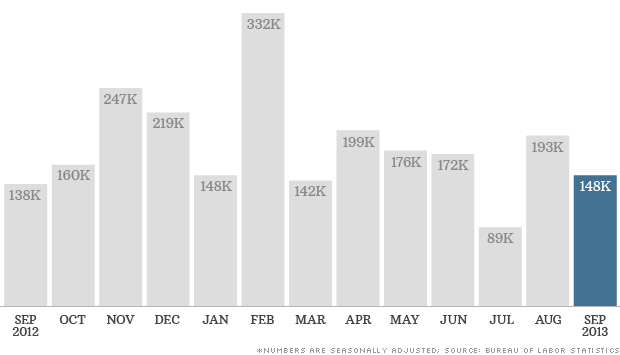
Economists polled by Reuters had expected the economy to add 180,000 jobs in September.
“This report on the labor market will soften people’s assessments of current conditions,” said Cary Leahey, a senior economist at Decision Economics in New York.
But there was some silver lining in the report, with the unemployment rate dropping a tenth of a percentage point to 7.2 percent, the lowest level since November 2008.
The jobless rate is derived from a separate survey of households, which showed an increase in employment last month.
U.S. Treasury debt prices rose on the report, while the dollar fell against the euro and the yen.
The closely watched monthly employment report was released more than two weeks later than originally scheduled because of the partial shutdown of the federal government earlier this month.
Signs the economy lost steam even before the acrimonious budget fight could convince the Fed to hold off any decision on scaling back its bond buying until the extent of the economic damage from the fiscal standoff is clear.
Economists estimate the 16-day government shutdown shaved as much as 0.6 percentage point off annualized fourth-quarter gross domestic product, through reduced government output and damage to both consumer and business confidence.
Fed officials will meet next week to discuss monetary policy, on October 29-30. They surprised markets last month by sticking to their $85 billion per month bond-buying pace, saying they wanted to see more evidence of a strong recovery.
Now, many economists think the Fed will hold off on scaling back economic stimulus until next year.
“With the possibility of a replay of the budget showdown as early as mid-January, why would the Fed want to pull any levers now? It’s hard to expect any tapering of the Fed’s bond purchases until the budget mess straightens itself out,” Leahey said.
There are fears lawmakers will engage in another bruising round early next year when Congress must agree on a budget to fund the government and once again raise the nation’s borrowing limit.
Employment gains in September were mixed last month, with government payrolls increasing 22,000 jobs after rising 32,000 in August. Both state and local governments added jobs last month, offsetting the decline in federal employment.
There was surprise weakness in the leisure and hospitality industry, which has been adding jobs consistently over the past years. The industry shed 13,000 jobs, the most jobs since December 2009.
The information sector failed to recoup all the jobs lost in August as the motion picture industry shed workers, with payrolls only rising 4,000 last month.
But there was good news in the construction industry, where payrolls increased 20,000, which could ease fears of a leveling off in home building. Construction employment had barely increased over the prior two months.
The manufacturing sector added a meager 2,000 jobs as automobile assemblies shed some jobs.Retail employment increased 20,800, slowing somewhat from the solid gains seen for much of this year.
Average hourly earnings increased three cents in September. They have risen 49 cents or 2.1 percent over the past 12 months. The length of the average workweek held steady at 34.5 hours.
(Reporting by Lucia Mutikani; Additional reporting by Ellen Freilich in New York; Editing by Andrea Ricci)

In the previous update we have seen how Federal Reserve’s balance sheet grew in the last few years. Now let us look how this growth coincided with increases on the stock market:
When you look at the above graph it would seem almost gratuitous to ask if there is a relationship between the Dow Jones Industrial Average and the Fed’s balance sheet. You don’t need to be a technical analyst to see that there is indeed a relationship. Both grew at the same time, but this does not necessarily imply that the Fed is solely or even mostly responsible for the growth in the stock market. Nevertheless, its influence on the index can hardly be exaggerated. Part of the stock market’s growth may be due to natural market recovery, part caused by the interventionist policies (notice that the growth in the value of balance sheet is not associated with the growth with market value of assets, since they are not marked to market; that is the value of assets held is not adjusted to current market value like in the case of market institutions).
Why is this relevant? It tells us the strength of the dollar system, or actually the strength of the foundation upon which it stands. To put it technically – the economy needs investment demand to grow, or even more simply, it needs money to grow. The sources of that money can be various and the sustainability of growth depends on what those sources are. The best possible source of money to grow is to get money by saving it – that’s the natural capital accumulation, which allows the diversion of funds from pure consumption to financing investment activities. Another possible, but unsustainable way, is to have a bank credit expansion to finance growth through debt). This is what has happened after 2001, the economy grew because banks created massive amounts of credit. The end result of this bubble was predictable from the start to many. There was such huge amount of mal-investments that even the banks themselves got into trouble.
After such a downturn (let’s say that Lehman’s collapse in 2008 was the beginning of the downturn) we could move into phase two which consists of the government funding “growth” through both fiscal stimulus and monetary policy. We put quotation marks on the word “growth” because it is a very slow and often fictitious growth (usually the case with government-funded growth). This is why we can say that the dollar system is in trouble even if the dollar as currency is not doing badly at all in the currency markets. The economy grew, but not as a result of solid fundamentals, but due to the Fed’s interventionist policies. That is why gold kept on shining through that period.
Since the economy did not go into full-blown recovery, it is not surprising that the Fed did not back out from these interventionist practices. And the change at the helm should not change this trend either. We do not believe in a permanent (or at least truly sustainable) market recovery without market forces freely influencing the prices. As long as the Fed stays on its interventionist course, we have every reason to believe that gold remains a firm choice.
Thank you.
Matt Machaj, PhD
Sunshine Profits‘ Market Overview Editor
Gold Market Overview at Sunshine Profits
* * * * *
Disclaimer
All essays, research and information found above represent analyses and opinions of Matt Machaj, PhD and Sunshine Profits’ associates only. As such, it may prove wrong and be a subject to change without notice. Opinions and analyses were based on data available to authors of respective essays at the time of writing. Although the information provided above is based on careful research and sources that are believed to be accurate, Matt Machaj, PhD and his associates do not guarantee the accuracy or thoroughness of the data or information reported. The opinions published above are neither an offer nor a recommendation to purchase or sell any securities. Matt Machaj, PhD is not a Registered Securities Advisor. By reading Matt Machaj’s, PhD reports you fully agree that he will not be held responsible or liable for any decisions you make regarding any information provided in these reports. Investing, trading and speculation in any financial markets may involve high risk of loss. Matt Machaj, PhD, Sunshine Profits’ employees and affiliates as well as members of their families may have a short or long position in any securities, including those mentioned in any of the reports or essays, and may make additional purchases and/or sales of those securities without notice.

The market has only three things it can do: annoy buyers, torment sellers, or frustrate everyone. Currently, the market is testing sellers and those who have not bought yet.
In any given year if you ask someone how the fourth quarter will play out, they will tell you the end of the year is usually bullish.
We want to get a little bit more specific than that.
So, we pulled the fourth quarter of every year since 2000 to see how the patterns play out. Below is a quarterly chart. The blue shading represents the fourth quarter of each year (October thru December period).
Click HERE or on Chart for larger view:

The bars themselves are not insightful. A green bar alone tells nothing of the path the market took on its way to a positive return. This means we need to take a look inside that gigantic quarterly bar.
For that, we use our alpha curves. The chart below is the output after each quarterly bar is unbundled and analyzed. We use all the daily bars which make up the quarterly bar to accomplish this. The algorithms take this data and generate curves based on pattern dominance: that special mix of uniqueness and repeatability. (Note: Month 1 represents October, Month 2 is November, and so on.)
Click HERE or on Chart for larger view:

It would appear from market feedback that we’re on the path of Pattern 1. As you can see from the chart, this pattern indicated that the quarterly highs will not be made until the end of the year. The second most dominant pattern was for a selloff in October followed by a recovery rally topping out in early December. The third most dominant pattern was a reversal month in October and choppy recovery. Finally, the fourth most dominant pattern calls for volatile chop and a rare negative fourth quarter performance.
What patterns do you see playing out in the fourth quarter? Is the concept of a rally into year end too obvious, or is it inevitable? If you would prefer to see the statistics table of this setup, click here.
As many people at Stocktoberfest already know, these algorithms are available at www.marketmemory.com. The product is still in Beta, but the adventurous among you are free to signup and give feedback on this amazing product.

 Legendary hedge fund manager Kyle Bass joins the Financial Sense Newshour to cover a wide range of topics: stocks, bonds, the debt ceiling, and more. He believes the Federal Reserve won’t be raising interest rates for another 3-5 years and that stocks are, unfortunately, “the only game in town.”
Here we present a partial transcript of this thought-provoking interview airing for subscribers this Wednesday:
Jim: Do you feel the debt ceiling debate and the political theater in Washington are hurting U.S. credibility and our capital markets in the long-run?
Kyle: No…the entire world is in the same position we are in one way or another. That’s painting the world with a broader brush, but when you look at the developed western economies (and, of course, we’ll exclude countries with no net debt like Australia and Canada that are natural resource heavy), but the developed western economies with the largest debt loads are all in the same boat. Whether or not they have debt ceilings in the U.S. or bank note agreements like they had in Japan until they recently abolished them, there are all of these potential glass ceilings that are put on the marketplace that always tend to move. I think since 1960 we’ve raised our debt something like 82 times.
Jim: Economists have often said—I’m thinking of “This Times Is Different” by Reinhart and Rogoff—when countries have debt-to-GDP ratios over 100%, they get into trouble; Japan’s is 230%. Why have they not had trouble up until now?
Kyle: When you think about what Reinhart and Rogoff’s book says, it kind of gets to an answer but it’s not the right way to look at things; there are many more variables to analyze the situation with. One is, of course, debt to central government tax revenues—that ratio. Another one is what percentage of your central government tax revenues do you spend on interest alone? Those barometers are much more impactful than just using a debt-to-GDP barometer. And then when you think about Reinhart and Rogoff’s work, if you’ve read all the white papers that they’ve written prior to writing the book, one of the other conclusions that they draw is when debt gets to be about 100% GDP it becomes problematic. Well, what that means is, typically—and, again, painting the world with a broad brush—central government tax revenues are roughly 20% of GDP. So what they’re telling you is when debt gets to be 5 times your revenue, that’s when you start to have a problem. Historically, the analysis that’s been done empirically by academics has focused on the countries that have fallen into a restructuring or a default as a result of this ratio that you and I are discussing. Historically, those have been emerging market economies that have higher borrowing costs. So, it actually makes complete sense that that number is too low when you’re talking about a developed market economy versus an emerging economy because, in theory, a developed economy can borrow at lower rates than an emerging economy can. That being said, in Japan, when the debts are 24 times their central government tax revenue, they are already completely insolvent—it’s just a question of when does it blow up.
Jim: I want to turn our attention to the stock market right now and your view of where you see the markets right now. They don’t seem overvalued when you compare them to 2000 or 2007, but they’re not cheap; and, where do you go in a market when the rate of return on cash or bonds is hardly anything?
Kyle: I think that as long as the Fed—for instance, the Fed is still buying $85 billion a month; almost a trillion a year—you could argue that the Fed is being more stimulative today than they were a year or year and a half ago. When we were running a trillion to a trillion and a half deficits, the Fed, at a trillion dollars in a deficit, was buying every bond that was issued. Today, you have a scenario where the fiscal deficit in the U.S., we think, is somewhere around 650 to 700 billion dollars. So, in theory, the Fed is actually adding more money to the economy today than it was a year ago because the deficit is lower and they’re still buying the same number of bonds. So what I’m saying is the monetary base continues to expand. What the economists are saying is velocity continues to drop at a faster rate than the base is expanding. Well, velocity, I believe, is a coincident indicator at best—possibly a lagging indicator. So, when the v [velocity] turns around that’s when inflation shows up, but for now–you’re asking about stocks…I think, given the lack of nominal yield in the bond market, all of the new money is going to continue into stocks. The interesting thing is it’s going to make the rich people richer and the middle and lower class won’t be any better off, which is the opposite of what the administration is trying to pull off.
Jim: What is your outlook on when the Fed will taper or, eventually, raise interest rates?
Kyle: I personally think that what enables the Fed to taper, again, is a contraction in the fiscal deficit. Now, part of that equation will be remedied by higher tax collections; unfortunately, the other side of that equation is, of course, lesser spending, which isn’t going to happen. So, I believe they can taper to the extent that the fiscal deficit has contracted. I don’t think that they’ll be able to raise the Fed funds rate any time in the foreseeable future—3 to 5 years.
Jim: So, that would argue that stocks would be a better play.
Kyle: Unfortunately…because it feels like they’re making it the only game in town. It’s not your choice, but it’s the only answer though. [End transcript]
In the rest of this must-listen interview, legendary hedge fund manager Kyle Bass gives investors his most recent views on Japan, the impact and outlook for shale gas in the U.S., and a wide range of other topics.
If you would like to hear this full must-listen interview with Kyle Bass ariing this Wednesday, CLICK HERE to subscribe. In addition to hearing from money managers, institutional investors, and analysts regularly interviewed for FS Insiders, you’ll also gain access to our entire archive of past interviews.


-
I know Mike is a very solid investor and respect his opinions very much. So if he says pay attention to this or that - I will.
~ Dale G.
-
I've started managing my own investments so view Michael's site as a one-stop shop from which to get information and perspectives.
~ Dave E.
-
Michael offers easy reading, honest, common sense information that anyone can use in a practical manner.
~ der_al.
-
A sane voice in a scrambled investment world.
~ Ed R.
Inside Edge Pro Contributors

Greg Weldon

Josef Schachter

Tyler Bollhorn

Ryan Irvine

Paul Beattie

Martin Straith

Patrick Ceresna

Mark Leibovit

James Thorne

Victor Adair