So where did I go for answers? When Michael Campbell asked that question a person he immediately thought of going to was David Bensimon as during an interview in October 2012 David forecast an immediate top for Gold at $1800 and sizable 20% drop to reach $1440 in mid-February. Gold did reverse right at $1800 and fell more than 10% over those 4-5 months. David then stated in his quarterly report to clients that the remaining distance from $1600 to $1440 was coming very soon with a possible extension to $1280, and Gold promptly collapsed all the way to 1320 in April. Back in October David also projected Silver to fall a dramatic 40% to $21 when most others were bullish. It took a bit longer than his February date, but Silver fulfilled his price target in April. [PolarView Special Report on Gold , April 2013]
So here is Michael interviewing David for his most recent thoughts on markets and what the outlook holds for the next few months and years
Michael Campbell: Let’s just start very quickly here with all their shenanigans thats been going on in Washington, obviously the world was watching it, but to me it was a lot of much ado about nothing. How does that factor in to your kind of analysis, or do you just say its not important?
David Bensimon: No, fundamentals are always important. Remember the analogy I gave of the fundamentals telling us whether we’re going north to south and the technical can tell us where the intersections are. So certainly the shut down and the debt ceiling issue were both important and I will spend a moment on both of those.
The shutdown did have a moderate negative affect but not to a large scale and not long-lasting. It does have I think, a small silver lining in that it helped wake people up to the fact that a lot of what government does is not necessarily really useful stuff, but on the other hand there are a few things that Governments do that do have a useful and beneficial effect for society at large. The real story was as you know, the Debt Ceiling. There are three short points I’d like to make about that.
The first is it was astonishing to me throughout this whole summer week period of the Debate that they totally missed the most crucial issue. They were focused on a single tree rather than the forest as a whole. That is the decision on whether to raise the limit, or the the necessity of raising the limit, was really not the key point. All of the fear-mongering about what happens if you Default or don’t Default and the necessity of raising the limit misses the point that the key was to review spending so that you’re not at this limit. I’ll give a simple analogy that everybody can understand: You have a credit card that has a credit line and you go out and spend and indulge yourself buying whatever you want using up the whole limit. you don’t normally go back to the bank and demand they raise the limit because I want to keep on spending. You don’t get to raise your limit because you want to spend even more, the current solution is that you go out and cut your spending or generate more income.
Governments do have several ways to generate more income, they can either raise taxes or take a bigger slice of the existing pie (with a lot of evidence around the world that doing that actually shrinks the pie), or they can hope to grow the pie and get a naturally larger piece of it. This brings us to the second point which is that the administration in particular made a lot of hype about the default and how even being late to pay some bill was going to Default everything. That was really overblown, and the reality is that Default, from a a very a strict point of view, only applies in the case of formal financial obligations like Treasury Bills and Treasury Bonds in relation to the interest or the principal that would be due on a certain date. If you don’t pay that well then sure you have defaulted on those formal obligations. But all of the discretionary domestic spending, which usually amounts to a promise to give some gift to someone who thinks they’re entitled to it, includes commercial purchases, or regular invoices for things that Government needs and Government salaries. Sure, those are obligations but being late in a payment is not the same as being default on a Bond.
The most important point really going forward is the third point. That is that the total amount of interest that is payable at the moment on the 16 Trillion dollars in debt by the US federal government amounts to about a 400 Billion Dollars a year. That is about 2 1/2 % effective average interest cost on that existing debt. Of course that covers the whole spectrum from practically 0% at the short end which rolls over very frequently and higher interest rates at the longer end in which has been outstanding for some time and doesn’t roll over quite as frequently. Or on average it is about 2 1/2% amounting to about $400 Billion.
Now that $400 Billion is about 1/10th of total spending. So they’re their sending out about $4 Trillion Dollars a year and only taking in about $3-31/2 Trillion, so there their interest is about 1/10 of the total. The problem is not right now, and this is why I wrote in my most recent report at the beginning of October, I actually wrote that I did not expect there to be any default and that I did expect that they would kick the can down the road by finding a solution to raising the limit because its too early yet. The US government for all of its problems is not actually at a crisis point in terms of ability to pay what they owe. That there was no danger yet of having an involuntary crisis of a real default. That’s not to say that is not going to happen, and I do think that by the time we reach 2017 – 2022, which is really only 4-8 years down the road, what you are going to find is that if interest rates move up to an average cost of 5%, which is still below historical levels, and outstanding debt rises to about 20 plus Trillion you’re going to find that 5% of 20 Trillion is a Trillion dollars a year in interest. At that point it is no longer going to be Guns or Butter, it will be neither Guns or Butter as everything gets sidetracked to pay that interest.
Eventually it crosses a threshold where it triggers a runaway effect of just a inflating that amount of Debt, inflating that amount of interest and the Dollar collapses. Eventually there will be a real crisis but we’re not at that point right now. We’re still in a normal phase, it was dealt with, they’ve kicked the can down the road so we can focus on the markets themselves. We can focus on normal life but in a somewhat later part of the decade we will have to deal with the real crisis.
MC: David you’ve let into my next question, you were the first analyst talking about the revival of the commodity sector. I’m talking about in the late 90s you talked about a prosperity driven bull market in commodities, obviously correct. Now we have virtually all commodities, just a few exceptions, in significant downtrend moves. If you look at their charts they are clearly going downstairs. Bottom line is the commodity bull market over?
DB: The short answer is no, and I think that over the past year particularly we’ve seen Gold adhere to a rhythm extraordinarily well. The reason that that’s important is that we can identify where we are in that rhythm and how that will play out based on the confidence that it is adhering to a particular pattern. I stood in Vancouver in one of your events, I think The Evening With Mike Campbell in October 2012, at a time when the market was incredibly bullish about Gold. We were bumping up to $1800, everybody was lifting their horizon to $2000 plus looking for a new highs, and I stood there and I said no, $1800 was going to be the top and it was going to fall 20 % over the next 4 to 5 months with an initial target of $1440.
The market in fact did reverse directly at $1800, and fell about 15 %, but didn’t quite reach the price level by the end of that time period. In that next report when we were at $1500 still, I said that in that particular case in the structure that was evolving price was more important than time. Its not always the case but in that case it was, and that we had another 20 % to fall from $1500 to the secondary level at $1280 on the 14th of June. A few weeks later when we gave the next presentation at your Gold Summit I said that the downtrend was intact, the targets were intact that we would very likely reach $1280 on schedule in June. Sure enough the market did tag the $1280 level on the 21st of June for a total of about 30 % down from the $1800 level, a 500 hundred dollar drop in Gold.
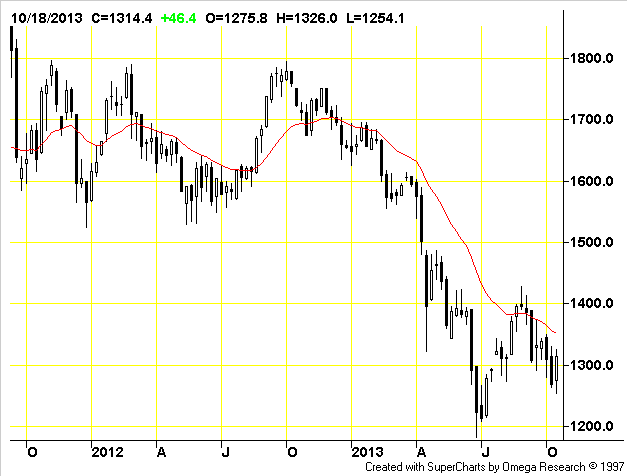
Over the next few days it stretched a little bit lower reaching $1180 on the 28th June, a date which everybody’s familiar with. But whats important is right on the day when we reached $1180 I did the calculations, because you always have to reassess whenever you reach new intersections, or new levels or new developments, I did the calculations and I discovered that $1180 on precisely 28th of June was at an important and very significant juncture of support. So I issued a new a Special Report on Gold, the first in a new series, which said that it could potentially be the bottom of the market, or at the very least it would be a base that would give us a very strong recovery. Even if later we had to come back to test it.
At that point, at the end of June, it was a very sure a high confidence point that it was going to rally, that it was going to jump at least $150 to $1330. A couple of weeks later it extended up to $1350 with the next timing window on the 26th of July. The market in fact reached $1350 precisely on the 23rd of July and then fell back halfway.
Now at that stage, precisely on the 23rd of July, we again reassessed the market and I wrote in a new report that the market was in a no man’s land. So I gave several scenarios, that if market was triggered by certain movements above a level, or movements below a certain level that would invoke a scenario in that direction. Specifically I said that if it went above that $1350 – 1360 area it would move all the way up to 1440 on the next timing window of 30th of August.
It’s important to note that timing windows are independent of polarity, that means from a pure timing perspective 30th of August could have been a high or it could have been a low depending on which way it was trending, but if it happened to be going up in it would turn out to be high. The forecast was it would reach $1440 on the 30th of August and we got pretty darn close with $1433 on the 28th of August, a few dollars shy and a couple of days early.
The next report, again to help your audience understand where we are in the rhythm, I identified the fact that from that high at $1433 the market had to consolidate within – between upper and lower bounds. $1430 being the upper edge, and $1300 being the lower edge with the center of that zone being $1365 as it tried to decide whether the bottom at $1180 in June was the real bottom or whether it needed to make a lower low. In fact the market did immediately plunge right back to $1300 and even poked a little bit below before bouncing up to where we are here at around $1320 or so.
The most recent report that I’ve done on on Gold was part of the Quarterly Series at the beginning of October so many people asked me about Gold and Silver that I a extracted those sections into their own separate Reports unique to each market. The conclusion that I drew is that the structure of the market, having gone up in its very clear ABC pattern, the bottom line on Gold from this point forward is I am now very Bearish. The point is that so long as the market is below that midline at $1365 you have to treat it from a bearish perspective. If the market were above 1365 you would have to treat it from a bullish perspective, but you can really only confirm those very large a eventual movements once you break free of the triggers. So in the down by case its below $1300. In the upside case its $1430, but I am Bearish, and even more so for Silver.
Now you might remember when I stood there last year when I said that Silver was going to drop 40% from $35 to $21, I can distinctly remember the audible gasp from the audience when I said 40%. But the fact is that silver is a volatile market, the scale of movement going up over the decade was 1150 % and there were several cases along that way when you went down by 40% or more and even since the 2011 we’ve had several instances of a 40 % drop.
So it’s really not I out of the ordinary scope for movement in a market like silver, the point though is that from the recent high at $25 I do think that there is the risk of another 40% drop. In fact even a little bit more to a particularly strong juncture of support during this fourth quarter, on a particular date at a particular time. Although I have to save something for the clients, I will give a hint to your audience, as I know that some like to play with the numbers, Silver has been adhering to a really nice Lucas rhythm. Now Lucas is that that series of numbers, 4, 7, 11, 18 etc. that are similar to Fibonacci numbers, but is those key numbers, 4, 7, 11, 18 which helped me find the magnitude of movements in Silver and that will give you a hint on where it’s going. That said, although I’m bearish near-term for these two months on Gold and Silver, I’m still very bullish for the following several years to new record highs on both those markets.
Of course in order to look at the details of what kind of price we can look for, for each step along the way going up we need to first turn the corner. Of course in order to turn the corner we have to first reach the termination point. We need to be cognizant of the risks of going down for the next couple months but we can have some degree of confidence that they are going to turn the corner and go up for several years.
MC: David this is going to be a nightmare for you, can you give me the one-minute on Oil?
DB: Oil had a had a great recovery between 2008 and 2011 from $32 up to $115. Since then it has been moving sideways, down and up and down and up, essentially moving across a channel. The key about that channel, about any channel, is that the market can reach it by falling either fast and deep or slow and shallow. You have to look for the key price levels from where that channel will cross. In the case of Oil the normal 3/8, 1/2 and 5/8 retracements would have been $64, $74 and $84. Well we got $64 originally, then we got to $74 in the first slide down in 2011. But that channel has now moved above those levels and that leaves one window, one important window of opp ortunity to tag $84 in December of this year as the channel crosses that level.
In my report from the beginning October was that we would fall 20 % from $104 to $84, we’ve started that move down to a $100, I think that’s going to continue over the next couple of months.
MC: Where are we in the Stock Market’s?
DB: You might remember just the day before we did your Gold Summit, the S&P 500 had reached a then record high of 1687 and I did a special report that called for a 130 points collapse from that 1690 to 1560 and that is exactly what happened over the next couple of weeks. A continuation of that scenario was for the market over the next several months to move in a contracting triangle. In a subsequent report I highlighted that if the market moved above 1680 it would negate that consolidation zone and instead invoke a somewhat more bullish scenario that had a first level of resistance at 1730. The market did in fact reach precisely 1730 on the 19th of September, and in the latest report the current scenario is that I favor the Stock Market moving higher. Again because I didn’t expect any real problem with the defaulting and that it would move higher until late October. In fact what we have seen between Gold and the S&P lately has been a very inverse relationship. That’s not the case all the time throughout history but for recent months we’ve seen some inverted behavior. When Gold goes up the S&P goes down, when Gold goes down the S&P goes up. At the moment the preening windows at the end of October and somewhat later, these are a representing tiny Windows that are joint timing windows in opposite ways for the S&P and Gold. So in the same way then I’m expecting intermediate lows for gold I’m expecting intermediate highs for for the S&P. But once we reach the levels of resistance that are somewhat higher than where we are over the next couple months, I do expect that the market will consolidate and pull back from there. That said I am very confident that we’re going to be 2014-15 & 2016 very bullish for stock markets globally and I and at that point we re-synchronize Gold and the S&P so that they are able to move up together. At the moment we are still in this transition phase and they will be moving in opposite directions.
MC: I always enjoy reading what David is writing, it is so thorough and unique. On the radio and even in person it’s hard to to do justice to the depth to the methodology that David is using but he’s done a wonderful job summarizing what he sees going forward. If you want more from David just go to PolarPacific.com.


 “We are in a gigantic asset bubble around the world with prices of real estate having risen a lot,” he said. “The high end is at record highs. In the Hamptons, in Mayfair, London, Hong Kong, Singapore, and we have a high inflation overseas, so I think that one day this asset inflation will lead to deflationary collapse one way or the other.”


