
Bonds & Interest Rates
 Former Federal Reserve Chairman Alan Greenspan said the stock market has room to rise from record levels.
“In a sense, we are actually at relatively low stock prices,” Greenspan, who guided the central bank for more than 18 years, said in an interview with Sara Eisen on Bloomberg Television today. “So-called equity premiums are still at a very high level, and that means that the momentum of the market is still ultimately up.”
Greenspan said the stock market is “just barely above 2007” and the average annual increase in stock prices “throughout the postwar period” is 7 percent, which leaves room for a rise.
“Price-earnings ratios are not hugely up,” he said. The market has “gone up a huge amount, but it’s not bubbly,” according to Greenspan.
Ed Note: Mike Shedlock has put together a thorough analysis of Alan Greenspans forcasting record. Here is a short summary:
Succinct Historical Synopsis
- In 1973 Greenspan said “There is no reason to be anything but bullish now” – The market topped that month, then crashed
- In 1996 Greenspan warned of “Irrational exuberance” – The market, fueled by Greenspan’s incompetent actions roared for four years
- In 1999 Greenspan was extremely worried about Y2K – The programming rollout on January 1, 2000 was exceptionally smooth
- In 2000 Greenspan fully embraced the internet productivity miracle – The dotcom bust soon began
- In 2001 Fed minutes show Greenspan was worried about inflation – A month later the Fed was fighting deflation
- In 2006 Greenspan said “Housing Prices Won’t Fall Nationally” – Prices peaked summer of 2005, then crashed over the next seven years
Today Greenspan Says
- “In a sense, we are actually at relatively low stock prices”
- “The momentum of the market is still ultimately up.”
- “The market has gone up a huge amount, but it’s not bubbly.”
The full analysis can be read HERE

The precious metal market has been stuck in a strong down trend since 2012. But the recent chart, volume and technical analysis is starting to show some signs that a bottom may have already taken place.
This report focused on the weekly and monthly charts which allow us to see the bigger picture of where the precious metals sector stands in terms of its trend.
Let’s take a look at a few charts below for a quick overview, but if you want more interesting ones visit: https://stockcharts.com/public/1992897
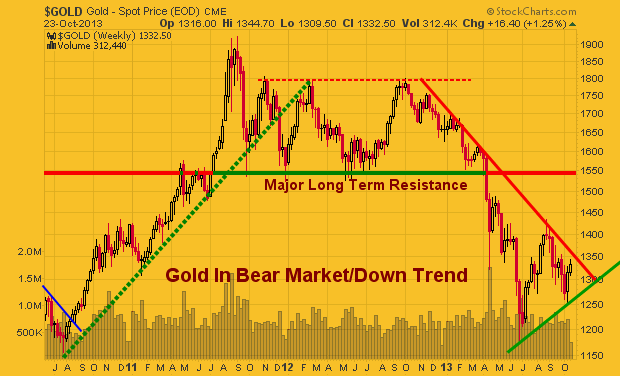
Gold Spot Price – Weekly Chart
This chart clearly shows the trends which gold has gone through in the last three years. With simple technical analysis trend lines, clearly price is nearing a significant apex which will result in a strong breakout in either direction.
Remember, this is the weekly chart, so we could still have another month or three of sideways chatter to work through. But a breakout in either direction will trigger a large move.
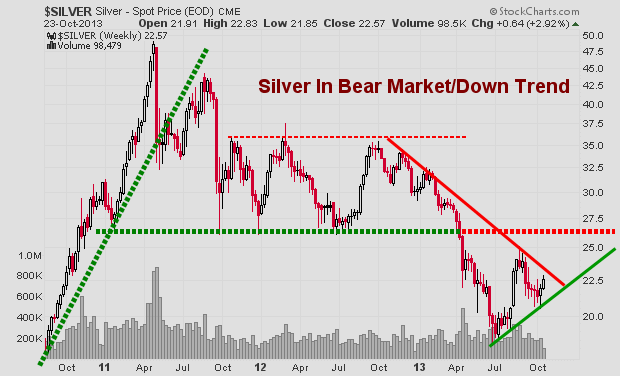
Silver Spot Price – Weekly Chart
Silver is also stuck in a similar pattern. Currently the odds still favors lower prices and for the upper resistance trend line to reject price and send it lower. But if we keep out eye on the leading indicators like gold miners, we may be able to catch a breakout or traded the rejection of resistance in the next month or so.
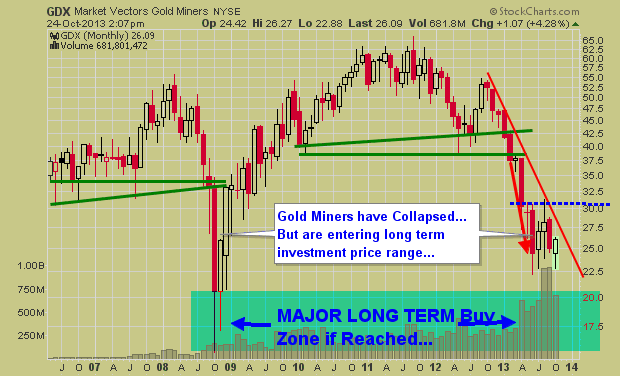
Gold Mining Stock ETF – Monthly Chart
Gold miners have a very sloppy looking chart. Price is extremely volatile and the recent price action in 2013 could go either way VERY quickly. I have a gut feeling GDX in the coming months could have a washout bottom and tag the $20 price level. While I hope I am wrong for many investors sake, if it does happen, it will be a very strong investment level to accumulate a position.
Precious Metals Bigger Picture Outlook:
In short, I remain neutral – bearish for this sector. In the next 1-3 months we are likely to see some strong price action which will be great. We need a breakout or bottoming pattern to form before we get involved at this level.
I know everyone is dying to get involved in precious metals again for another huge rally… but sometimes it’s just best to wait for the big picture chart to catch up with your bias before taking a position of size.
Get My Free Weekly Trading Sector Reports
Delivered To Your Inbox: www.GoldAndOilGuy.com
This entry was posted on Thursday, October 24th, 2013 at 2:56 pm and is filed under blog, ETF Trading Newsletter, Gold Bullion, Gold bullion forecast, Gold ETF Analysis, Gold Forecasting, gold forecasting service, Gold Newsletter, How To Trade Gold, silver, Silver Analysis, Silver ETF Analysis. You can follow any responses to this entry through the RSS 2.0 feed. Both comments and pings are currently closed.

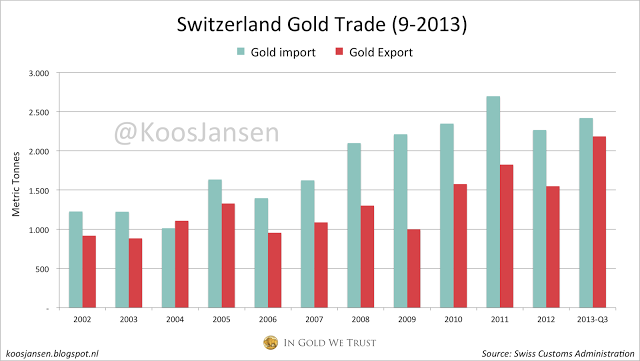
Four of the largest gold refineries on earth are located in Switzerland, being Metalor, Pamp, Argor-Heraeus and Valcambi. It’s estimated 70 % of the world’s refining is done near the Alps, therefor massive amounts of gold are distributed here; Switzerland has imported 808 tons of gold in the third quarter of 2013, and exported 680 tons in this period. Year to date import is 2420 tons, and export 2184 tons. Switzerland has never exported this much gold in 9 months, or in 12 months, the yearly total estimate is 2912 tons. I dare to say more than 1100 tons of this will hit the Chinese shores, wether it be Hong Kong or any other port.
We know Hong Kong has net imported, in between January and August, 598 tons from Switzerland. Much of this is sent forward to Shanghai, but the Chinese are also importing directly from the Swiss. We know this from SGE physical deliveries and from Alex Stanczyk, Chief Market Strategist at Anglo Far-East Bullion, who I interviewed a couple of months ago. He told me China imports a lot that’s not going through Hong Kong (or through the SGE!).
Our firm has got personal experience dealing with the guys that transport the gold, the security companies. One of our partners had lunch in the recent past with the head of the largest global operations company in security transport. He said there is a lot of gold that they’re moving into China that’s not going through exchanges. If the gold is for the government they don’t have to declare where it’s going. They don’t have to declare where it’s going in, or where it’s heading. If you look at the way the Chinese do things, why would they tell?
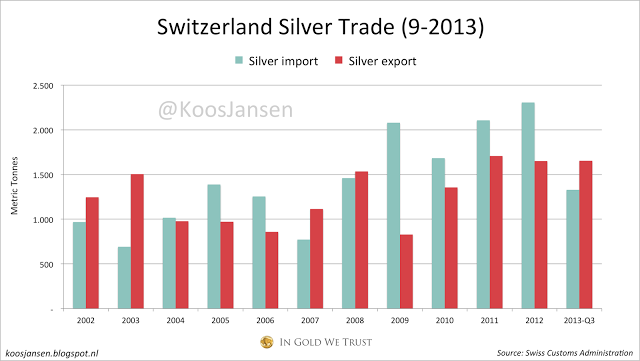
Given the fact the Gold/Silver ratio is 59 currently, silver data from the Swiss looks a bit pathetic, but for all you silver bugs I made a chart! In the third quarter of this year the Swiss imported 545 tons of silver and exported 608 tons. Year to date import is 1328 tons, export 1653 tons.

 Unlike Anything We Have Ever Seen Before
As I have discussed, we are about to witness a major change in the development of international oil, gas, and power generation.
This will involve a massive expansion of unconventional shale gas and tight (usually also called shale) oil production worldwide, along with substantial moves in infrastructure, electrical production and grid networking.
For all of this, cross-border movements quite unlike anything we have ever witnessed will be required.
As such, I recommended six interrelated elements that will be essential in the development of a game-changing approach to energy production and dissemination.
This shift will require:
(1) The identification, prioritization, and availability of technical innovation;
(2) An overall approach to predicting and containing costs;
(3) Attention to the adverse impacts on everyday life from the increasing exploitation of unconventional oil and gas – environmental, local/regional, and economic, market and labor dislocation problems;
(4) Planning flexibility to allow a wider selection of service providers, expertise, equipment, and technique applied to projects internationally, with an emphasis on developing in-country sources of technology, equipment and training worldwide;
(5) Development and application of new models for project finance; and
(6) Comprehensive regulatory and risk management approaches to merge government, private sector and social needs and objectives.
I also spent some time during the briefing and in the private discussions over dinner outlining how all of this could be done. The key is developing a seamless way to integrate the many factors within the six elements above.
This will require early attention to what is needed in countries around the world and identifying who is likely to provide the solutions.
And it is here that we are going to obtain an early indication of the companies, approaches, and breakthroughs that are likely to provide major profits for investors. In fact, what I intend to do here is expand the stage on which individual investors normally operate.
In the future, we will be going global.
To make this happen, there will have to be a primary venue for the planning, identification, coordination and application in the energy sector as needed.
It just so happens that I’m involved in that as well.
In May, as many of you may recall, I was appointed Executive Chair of the Global Energy Symposium (GES).
This ground breaking new effort will bring noted international energy figures together to conduct ongoing analysis and priority identification, along with providing policy recommendations to governments, international agencies, corporations, environmentalists, and social groups.
This effort is so critical that I will be leaving my university appointments to head up this international group. But don’t worry, the way average individuals will profit from this will still continue on right here in OEI and in my specialized investment subscriptions through Money Map.
As we get closer to its first major international conclave in April of next year, you are going to hear a lot more about the GES. But one thing is certain: You are about to get an inside view on some of the most important energy changes in a generation.
Already, the London session has had an immediate impact on wider circles of interest. So over the next several weeks, you are coming along as Marina and I talk to other high-powered groups in Rio de Janeiro, Moscow, and a series of very private meetings at our second home in the Bahamas.
The international energy picture is changing fast and we are going to be right in the center of it.


Stop listening to the whiners. The time to invest is when there’s blood in the streets. When your stocks have been doing well for a while and every moron decides that it’s time to buy equities, you’ll be in positions to “sell high.” You can’t really do that, however, if you neglect to buy low because you got caught up in the pessimism and lost faith in human ingenuity.
This is the same thing John Templeton did it back in 1939. Templeton started his investing career in 1939 by borrowing about $10,000, which was real money in those days. With war escalating in Europe and most investors in panicked despair, he didn’t buy gold, nor did he put all his money in Treasuries or other “safe havens.” He bought 100 shares in each of the 104 companies priced under a dollar on the New York and American stock exchanges. Almost all were innovative startups, and 34 were in bankruptcy. He then ignored his portfolio for four years. At that point, only four of the 104 were worthless, and he had quadrupled his money. It wasn’t luck. Templeton was one of the few who understood portfolio mathematics. It is axiomatic that a diversified portfolio of truly innovative companies held for the long run will pay off big. This is based on the simple assumption that human progress will continue and things will get better.
Most people forget that during the Great Depression, there was considerable growth in technological innovation. Necessity created a number of innovations that made our lives better and easier — the laundromat, copy machines, the car radio, the electric shaver and even the cotton tampon all came out of the 1930s. The first nylon material was introduced by DuPont. Improvements in existing technologies like the automobile and airplanes were constantly happening, even as the stock market flat-lined.
So at a time when the mainstream was too busy running scared from markets and hiding their money (to the detriment of the rest of the economy), innovative investors like John Templeton were quietly investing in emerging technologies and, over time, making a fortune. Templeton didn’t wait for the government or central banks to somehow stimulate us into success like most people then and now.
If you are waiting for policymakers to solve the market’s problems, you’re going to be waiting a long time. There are two kinds of people the world should really be looking to for solutions — scientists and the investors who fund their innovations. Scientists might toil away for years, and investors might sit and wait patiently, but inevitably, as progress is made, there is a payoff — and that payoff can, in some cases, lead to revolutions in entire industries. Schumpeter is the most important economist to investors: He coined a term “creative destruction.” If you really want to make money, look not for that which strikes at the margins and outputs of existing firms, but at their very foundations.
We are looking for investments that leave ruins behind. Capitalism is the very perennial gale of creative destruction. So if we want to seek out and profit from the real innovations in society, we have to look for technologies that aren’t just changing some things, but changing everything.
This moment of financial uncertainty, like all those before it, is a golden opportunity for investors with vision to buy emerging disruptive technologies at truly bargain prices.
I’m constantly amazed by the sort of sentiment I read in mainstream financial publications. When stocks are down, people decide they’re going to sell off and look elsewhere for profits. The market “stinks,” they say. Seriously, am I the only person who finds this sort of short-term thinking addled and absurd?
After all, we’ve seen financial cycles since… forever. We know they happen. We know that the best time to buy is when markets are depressed. So why are so many people acting as if the markets are broken?
Oh, wait. I know that one. It’s because most people are driven more by herd psychology than higher-order thought processes.
I’ve been reminded why I like the Austrian economist Joseph Schumpeter so much. One reason is that he considered big business cycles the inevitable consequence of innovation, as well as the resistance to innovative change that always exists within the old order.
This view, that cycles cannot be eliminated due to the biological imperative of human nature, sets Schumpeter apart from other economists, even of his own Austrian School. In fact, many of my friends of the Austrian persuasion who adhere more strictly to the banking theories of Mises and Hayek tend to irritate me. They’re. So. Whiny. They complain and complain about the stupid things that governments do and the fact that stupid people enable those stupid things… stupidly.
So what? If you can’t change it, accept it. And profit from it.
By this point in history, given that we’ve suffered through far more serious injuries to our economic system, and more than recovered every time, it should be obvious that human nature is not “repairable.” There’s not ever going to be some sort of global — or even societal — awakening, in which the vast majority of people suddenly realize that government is basically incapable of improving on free markets to any significant degree.
Societies do, however, respond to the pain caused by government-induced failures, just as B.F. Skinner’s pigeons learned complex behaviors without ever understanding them. We are, in fact, well on the road to recovery, though I admit that more people are going to have to suffer negative reinforcement (pain) before we are ready to make up for lost time. But we will.
I’m sure you know the Chinese curse, “May you live in interesting times.” We do, in fact, live in very interesting times. More importantly, we are in a period of historic opportunity, which we may never see again.
Regards,
Patrick Cox
For Tomorrow in Review

-
I know Mike is a very solid investor and respect his opinions very much. So if he says pay attention to this or that - I will.
~ Dale G.
-
I've started managing my own investments so view Michael's site as a one-stop shop from which to get information and perspectives.
~ Dave E.
-
Michael offers easy reading, honest, common sense information that anyone can use in a practical manner.
~ der_al.
-
A sane voice in a scrambled investment world.
~ Ed R.
Inside Edge Pro Contributors

Greg Weldon

Josef Schachter

Tyler Bollhorn

Ryan Irvine

Paul Beattie

Martin Straith

Patrick Ceresna

Mark Leibovit

James Thorne

Victor Adair