
Currency
The markets have made some very sizeable moves this morning, first reacting to the ECB cutting interest rate 0.25%. Sparking a huge sell off in Euro futures down over 200 pts to below 133!
The US GDP print came in at 2.84%, far above expectations of a 2.0% annualized number.
Gold has now traded below $1300 down over $20 on the day on the back of the USD Index rising above 81.50.
Canadian Dollar futures are down 30pts to 9560 but holding steady.
Drew Zimmerman
Investment & Commodities/Futures Advisor
604-664-2842 – Direct
604 664 2900 – Main
604 664 2666 – Fax
800 810 7022 – Toll Free

 Let me de-brief you on Jim Sinclair’s track record. He predicted gold would soar above $850 in the 1970’s, when it was fixed at $35. He sold at the 1980 absolute top–to the day, at $875.
When gold was languishing below $300 a decade ago, he predicted gold would reach $1650. In 2011, gold reached a peak of $1923. With gold in the low $1300’s recently, he is forecasting price targets of $3,500–and $50,000.
I hope he is wrong. But over the last four decades, he hasn’t been – Greg Nguyen
….read Sinclair’s Annihilation of US Dollar Coming HERE
Sinclair predicts, by 2016, “Gold will be $3,200 to $3,500 an ounce.”
For months we’ve been writing about the major bottom to come in precious metals. It appeared we finally saw it in late June as the metals and the stocks surged during the summer. Yet, these markets trailed off in August and it continued into October. The equities were down seven straight weeks. That gave way to an oversold bounce. Unless precious metals can close above their October highs on a weekly basis, the outlook remains bearish. While this bear market is finally coming to an end, don’t expect it to end quietly. At present Gold looks eerily similar to both Gold in 1976 and the SYP in 2009 prior to their major bottoms.
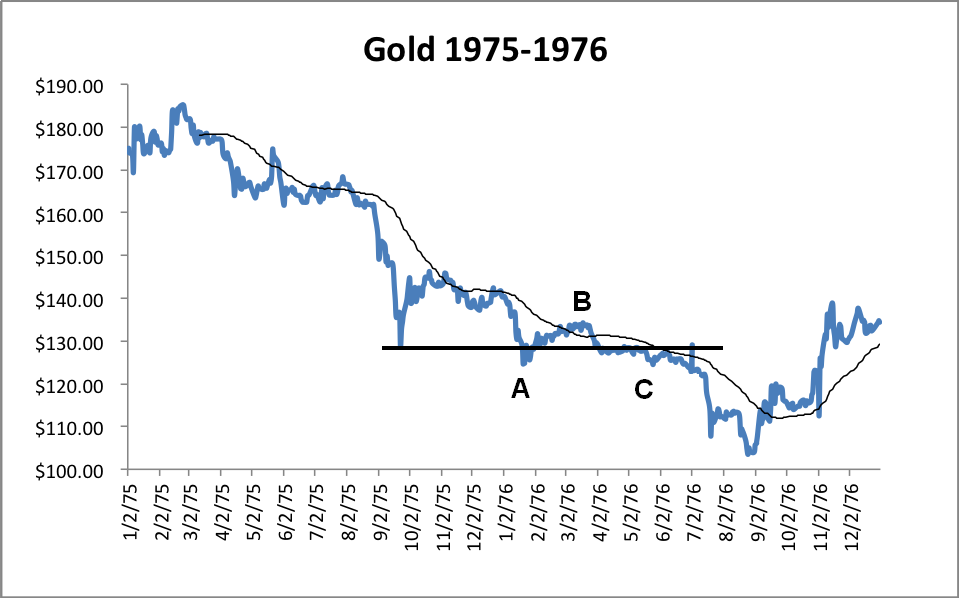
The first chart below shows Gold in 1975 to 1976. Gold’s sudden decline that began in August 1975 took it from over $160/oz down to $128/oz. It was a 20% drop in one month. After it rebounded it formed a marginal new low (A) and traded around $130 for about five months. Once Gold failed at the declining 50-day moving average and lateral resistance it plummeted to its final low.
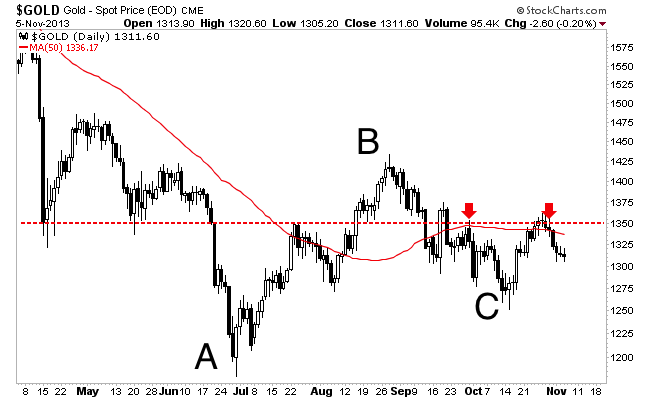
Gold in 2013 has formed a very similar pattern. The first panic low occurred in April which was followed by another low several months later. Gold then recovered back above the first panic low to point B. Point C labels the decline below the first panic low and a temporary bottom. Just like in summer 1976, Gold rallied up to a strong confluence of resistance (lateral and 50-day moving average) and failed.
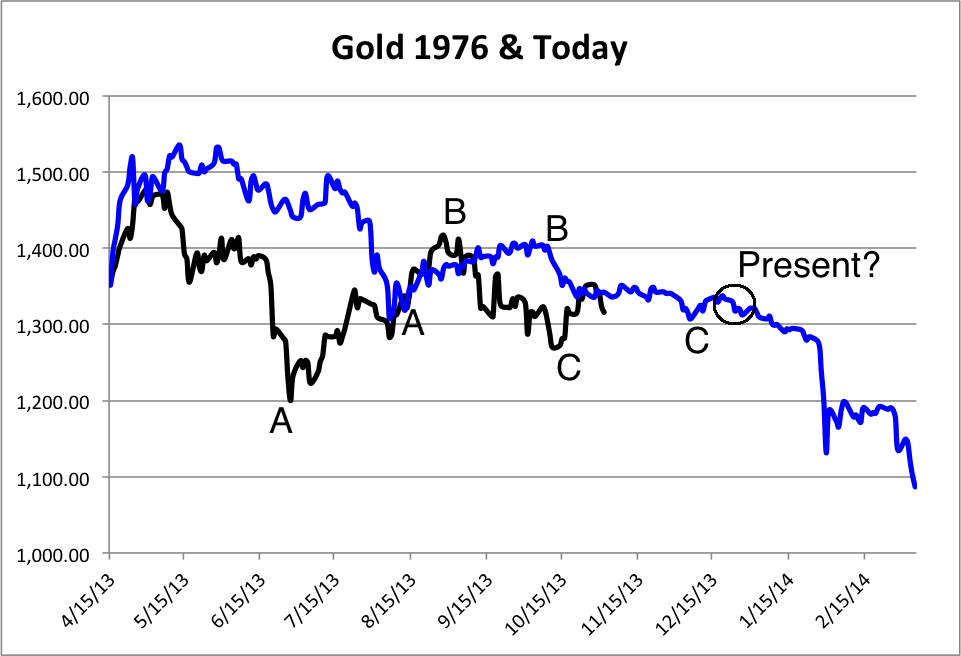
I’ve aligned both of the above plots on the same scale starting with their first panic low. The blue is Gold in 1975-1976 and the black is today. The 1976 template has Gold bottoming in early March. However, we can clearly see that Gold today is a few months ahead of that.
Next, take a look at the S&P bottom from 2008-2009. It followed the exact same pattern!
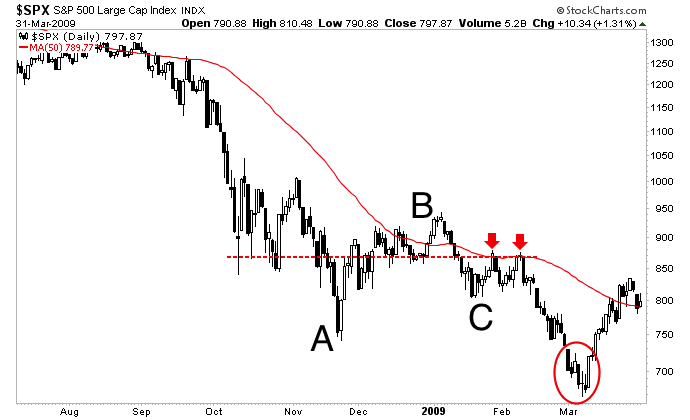
Let’s compare the three situations. In Gold from 1975-1976 its bearish consolidation (from first panic low to failure at resistance) lasted nine months and its final decline lasted two months. In the S&P 500 from 2008-2009 its bearish consolidation lasted only four months and its final decline lasted no more than four weeks. Gold’s bearish consolidation lasted about six and a half months. Judging from this data we could project Gold’s bottom to come in about six weeks.
There are a few more important things to note. Gold from 1975-1976 had a very weak rally from point A to B. It was in a weaker position and then consolidated for the longest. That is why it had the steepest final decline. The S&P in 2009 consolidated for only four months. When it broke to a new low, it made its final low the next week. Like the S&P 500, Gold today had a stronger rally from point A to B. Also, unlike the other two Gold today has been in a bear market for over two years. Considering these things, I’d expect Gold’s final bottom to be more similar to the S&P in 2009 than Gold in 1976.
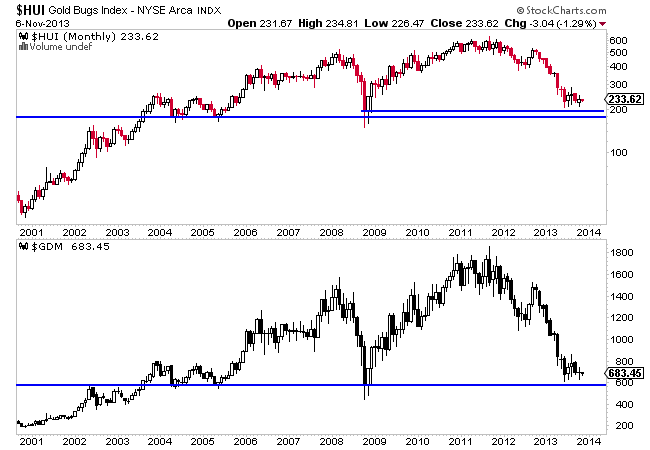
How would this final decline in Gold affect the gold stocks?
The chart below is a monthly chart of the HUI gold bugs index and the NYSE gold miners index (GDM) which is the parent of the GDX ETF. Both markets bottomed in late June not to far above the major support which dates back to 2004. In fact, we referenced this chart when we penned an editorial, one day before the June bottom. Maybe Gold will break to a new low but the gold stocks won’t. If the gold stocks do make a new low, this chart is telling you that it won’t last for long. There is very strong support sitting right below the summer lows.
Unless Gold is able to close above $1350 in the near-term on a weekly basis then consider the short-term trend bearish. Gold looks set to plunge to its final bottom. Gold bugs will cry manipulation, CNBC and Twitter types will be mocking the Peter Schiffs of the world and many will be calling for $900 Gold. I urge you to avoid all this nonsense and focus on one thing. Get yourself in position to take advantage of this bottom. It’s the very smart money that is looking forward to buying this bottom. I suspect the coming bottom will be the one the typical huge rebounds originate from. If you’d be interested in this kind of analysis and the companies poised to rocket out of this bottom then we invite you to learn more about our service.
Good Luck!
Jordan Roy-Byrne, CMT

 FINANCIAL REPRESSION STARTS SHOWING ITS UGLY HEAD
Financial repression has truly shown its face in 2013. The year started with an epic event: a bail-in of major banks in Cyprus which laid the foundation of a bail-in template (recently released by the BIS).
Poland saw a major restructuring of its private pension funds; the funds were nationalized overnight. One could call it “pension fund confiscation.”
The Detroit bankruptcy was another major development. Recently, it became clear that pensioners, retirees and other unsecured creditors would undergo a 84% haircut on each dollar (source).
One of the newest inventions in the financial world in 2013 was “bank bail-ins.” The term achieved the status of a commonly accepted buzz word in a very short period of time. In its latest update, Taki Tsaklanos from Gold Silver Worlds discussed several recent cases which provided proof of the bank bail-in rumble growing louder. He also explained that bank bail-ins are the result of extreme banking leverage; excess liquidity provided by the central banking corporations do not prevent bank bail-ins, they feed them.
The 10% savings cut proposal by the IMF for European households has luckily not been implemented [yet?], but the fact it is openly being discussed as an idea is worrisome to say the least. In our view, it deserves adding it to our list as it is an indication of coming major unexpected measures.
….read more HERE

Goldman Sachs Report: Is There No End to the Bakken Trend?
One year ago, I wrote this story, asking—could the Bakken ever hit 1 million barrels of oil per day (bopd) production?
Well, now the Market is asking—when (not if) will it hit 2 million?
A massive, 76-page report from Goldman Sachs from late September suggests 2023—that’s another TEN YEARS of growth—with the biggest growth year being next year, in 2014.
In fact, they say the worst case scenario for the Bakken is now 1.3 million in 2017. One million? Pfffftttt…yesterday’s news.
A smaller examination from Credit Suisse in early October suggests the same thing. Analysts from these investment giants went to the Bakken to find out firsthand whether this prime play has peaked.
And the two groups independently returned with the same answer: no.
Two factors will continue to drive Bakken production growth for at least another decade: tighter well spacing and production from deeper zones. There’s enough life in these drivers that Goldman’s analysts started off their Big Report by stating they “believe production from the Bakken horizontal oil shale play in North Dakota and Montana can continue to grow substantially.”
If deeper zones and tighter well spacing were not spurring resource expansion, Bakken oil production would plateau at 1.3 million bpd in 2017. That would mean the Bakken only offered a few more years of growth, and at a much slower pace than we have seen to date.
Instead, Goldman expects the Bakken to peak at 2 million bpd and not until 2023. To get there, they figure production growth will average 130,000-210,000 bopd a year, well above the 110,000 bopd increase that we saw in the first half of this year.
First, the play has been de-risked and its areal extent defined. Bakken operators now known where and what the Bakken is.
However, they are still figuring out how well spacing and drilling depths impact everything, like how much oil they can pull from the formation.
At first, producers drilled Bakken wells on 640-acre spacing, one per square mile. Then they moved with good success to 320-acre spacing. With shale formations, the worry is that wells drilled too close together tap into the same oil and limit each other’s productivity. (The industry says that wells are communicating.) However, this year operators started to test 160-acre spacing – and met with great success in some areas.
Not every part of the Bakken will be able to support 160-acre well spacing, but the analysts at Goldman figure 20% of the Bakken can handle it. They also think downspacing, as it is known, will get seriously underway in the next six months because lots of Bakken E&Ps are testing tighter spacings now.
Second, Goldman sees production rising as producers tap into deeper reserves. The Bakken is a layer cake, with five oil-bearing layers amongst nine total layers. The top two oily layers, the Middle Bakken and Three Forks 1, currently account for most of the Bakken’s production.
Underneath these layers lie three more oil-bearing shale formations, known as Three Forks 2, 3, and 4. So far wells drilled into these deeper layers have been mostly exploratory, but there have been some successes, especially from Three Forks 2. This bodes well for at least some deeper Bakken production.
On top of all that potential for production growth, the Bakken is also becoming more efficient. Better geologic understanding and more experienced drillers mean well costs and timelines are both coming down.
Slow output growth in H1 2013 but different drivers to come
Bakken production growth did slow notably in the first half of 2013—Goldman says that was due to weather issues, and the timing of bringing pads online.
As the Bakken matures more operators are shifting to multi-well pads, which take longer to establish but are more efficient in the long run. This transition really hit in H1 ‘13, which means the slowdown in output growth was really just a delay.
As all those multi-well pads come online, all that delayed output will boost Bakken production once again – with the biggest boost coming next year, when the guys at Goldman expect Bakken oil production to climb 212,000 bpd. After that they foresee output growth of 165,000 bpd in 2015 and 115,000 bpd on average in 2016-2018.
Efficiency, not rig count, is what matters
Production growth in the Bakken is still happening, despite fewer wells being drilled. Rig counts are used to measure how busy a play is and a declining number added to concerns the Bakken boom was ending.
What makes rigs more efficient? Well trained crews. Experience–operators now understand their acreages and geology better, and so can spot wells more accurately. Small technical improvements like better fluids and drilling technology means wells get drilled more quickly and the rigs can move on to the next job sooner, reducing the needed number of drills.
Fewer rigs does not mean fewer wells. Goldman forecasts well completions will also rise even as the rig count declines, with faster drilling times. They see 20% more wells drilled in 2013-2017 compared to 2011-12, even assuming a 20% lower rig count.
And pad drilling is starting to happen in the Bakken—where the industry drills 8-10 wells from one 10 acre site. This requires fewer rigs to complete the same number of wells.
Goldman sees no end to this trend. In fact, their analysts predict an average of just 150 rigs in 2014 through 2017, down from a peak of 213 in mid-2012, even as Bakken production climbs from just over 700,000 bpd today to an estimated 1.6 million bpd in 2017.
A more accurate measure isn’t the number of rigs drilling, but the number of feet that get drilled. A lot of operators are now doing two mile plus laterals—longer than ever before. That reduces the rig count as well.
Credit Suisse adds that these longer laterals—with more fracks spaced more tightly together—are boosting recoveries, and with not much added cost. These analysts say companies in the core of the Bakken are now guessing they will recover as much as 940 million barrels of oil equivalent (mboe), compared with 650 million boe in 2012.
So a smaller rig count is simply a result of a better, more efficient Bakken – not, as the Street worries, because of lack of inventory.
Digging into those deeper zones
Most horizontal drilling activity in the Bakken has focused on the Middle Bakken, a limestone, dolomite, siltstone and sandstone layer that lies about 4,500 feet below surface on the eastern edge of the basin, deepening to 11,000 feet below surface in the southwest corner of North Dakota.
The source rock for the Middle Bakken – the part of the formation that supplied the oil now in the Middle zone – are the Upper Bakken shale, a 23-foot thick layer just above the Middle Bakken, and the Lower Bakken Shale, a 50-foot thick formation just below.
The Three Forks formation is beneath all of that. This 250-foot thick section has 4 different layers, all of which also got their oil from the Lower Bakken Shale. The uppermost Three Forks layer (Three Forks 1, or TF10) has been largely derisked – in other words, it is producing.
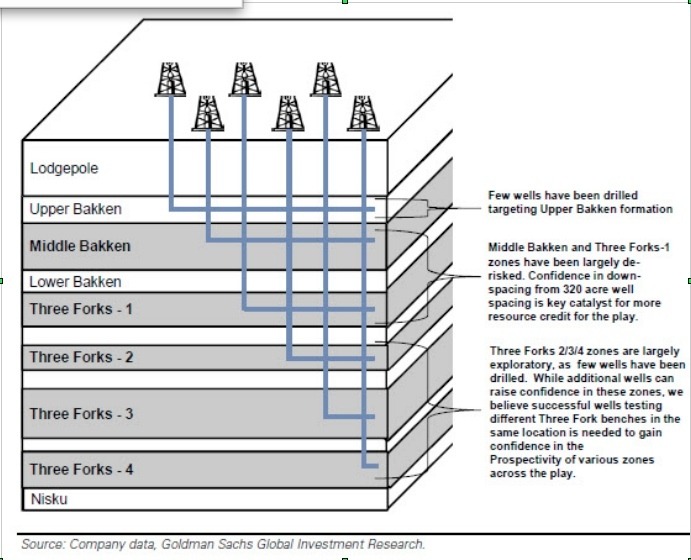
Three Forks 2, 3, and 4 are still largely exploratory.
Three Forks 2 (TF2) is certainly showing promise, though primarily in McKenzie County, in the core of the Bakken. Continental, ConocoPhillips, and EOG have all drilled successful TF2 wells in McKenzie County.
There have also been successful TF3 wells, and while the numbers are fewer the geographic spread is greater. Operators have reported successful TF3 wells in four different counties.
The sector is still waiting for a strong TF4 well. Only two TF4 wells have been drilled to date, both by Continental, and neither well produced economically
A key question is whether Three Forks 2, 3, and 4 can be developed independent of TF1. It is possible that wells drilled into the Middle Bakken and Three Forks 1 may have depleted the Lower Three Forks interval.
In short, the data is still limited and key questions remain unanswered. Nevertheless, Goldman assumes 25% of the Bakken will generate some productivity from Three Forks 2, 3, and 4. That can only help.
And of course, this report was written before Whiting Petroleum (WLL-NYSE) and EOG Resources (EOG-NYSE) showed the Market in early October that they can greatly increase the EUR of a Bakken well by using short wide fracks vs. long skinny ones—you can read my story on that HERE.
So it’s possible late 2014 I’m writing a story…the Bakken only producing 2 million barrels a day? Pffffttt…that’s old news.
– Keith
Editor’s Note: As I stated above, faster drilling times and rising well completions are two key components in Goldman’s forecast. So how can investors capitalize? One OGIB stock—one of my top picks—has doubled their U.S. market share in the last few years…and the Market continues to reward its growth, in a big way. My research report spells out this opportunity in detail—you can read it here.


-
I know Mike is a very solid investor and respect his opinions very much. So if he says pay attention to this or that - I will.
~ Dale G.
-
I've started managing my own investments so view Michael's site as a one-stop shop from which to get information and perspectives.
~ Dave E.
-
Michael offers easy reading, honest, common sense information that anyone can use in a practical manner.
~ der_al.
-
A sane voice in a scrambled investment world.
~ Ed R.
Inside Edge Pro Contributors

Greg Weldon

Josef Schachter

Tyler Bollhorn

Ryan Irvine

Paul Beattie

Martin Straith

Patrick Ceresna

Mark Leibovit

James Thorne

Victor Adair