Gold & Precious Metals

Gold Bulls About to Get Burned – Here’s Why

Mining Stocks‘ and Euro‘s Implications for Precious Metals

In our essay on gold price in November we examined the long- and the-short-term outlook for gold to check whether it confirm the indications for silver and mining stocks or not. As we wrote in the summary:

(…) the medium-term outlook for gold remains bearish and, at this time, the short-term outlook is bearish as well. It seems that the precious metals sector reversed direction this week right after moving to the declining resistance lines. (…) From this point of view, it might be the case that the next major downleg has already begun and it seems likely that we will see at least a short-term downswing shortly.

Since that essay was published, gold dropped below $1,340 and almost reached an important support level at $1,300. The yellow metal has lost about 3% since Oct. 28 and has logged its longest losing run since mid-May when it dropped 8% in seven days. Additionally, we also saw drops in case of silver and mining stocks.

From today’s point of view we see that this decline was triggered (as it was likely to happen anyway, based on technical reasons) by doubts over when the U.S. Federal Reserve would begin scaling back its stimulus measures. Although the Fed left its $85-billion-a-month asset purchase program in place following its monthly policy meeting, it didn’t give clear indication whether it would start scaling back stimulus at the December meeting or continue it into the start of 2014.

Therefore, investors still look out for U.S. data reports to gauge if they will strengthen or weaken the case for the Fed to reduce its bond purchases. As is well known, if you want to be an effective and profitable investor, you should look at the situation from different angles and make sure that the actions that you are about to take are justified based on each of them, or at least based on a majority of them. That’s why in today’s essay we examine the Euro Index and the HUI Index (along with its performance relative to gold) to see if there’s anything on the horizon that could drive the precious metals market higher or lower. We’ll start with the Euro Index chart (charts courtesy byhttp://stockcharts.com).

Click on image or HERE for larger view:

radomski november62013 1


Looking at the above chart we see that the long-term downtrend remains in place. Additionally, it seems that the short-term uptrend might already be over. In the previous week, the RSI bounced off  the 70 level, which was a bearish sign. At the same time the Euro Index moved very close to the strong resistance created by the declining resistance line, but it didn’t break above it. This show of weakness in combination with the position of the RSI triggered a heavy decline and the European currency dropped below the 135 level. Earlier this week, the euro extended declines and it seems that the downward move is not limited at the moment.

At this point, we would like to emphasize one important fact: the previous tops (in 2008 and then in 2011) were followed by major declines in the precious metals sector. If history repeats itself we may see similar price action in this situation.

Having discussed the current situation in the European currency, let’s take a look at our Correlation Matrix – a tool designed to measure, present and provide interpretations of correlations between various parts of the precious metals sector and key markets that impact it – specifically, at the USD Index and the general stock market.

radomski november62013 2-1

In the previous week we saw a return to normalcy in case of the short-term coefficients. The precious metals sector responded negatively to changes in the USD Index and positively to changes on the general stock market. However, taking into account the situation in the Euro Index, we clearly see that the long-term resistance triggered a medium-term downward move. Therefore, we will focus on the medium-term correlations.

The correlation coefficients between USD Index and precious metals are clearly negative when we take the last 250 and 750 trading days into account and it seems that a big decline in the Euro Index could trigger a decline in the precious metals, as it would very likely mean a major move up in the USD Index.

Once we know what the current situation in the Euro Index, let’s move on to the HUI Index and try to find out what kind of impact the mining stocks can have on gold’s future price.

Click HERE or on Chart for Larger Image:

3

On the above long-term chart we see that the HUI Index reached its medium-term declining resistance line in the previous week.

At this point it’s worth noting that we also saw similar price action in the case of gold and silver. Therefore, implications are bearish and the trend remains down. Please note that we still expect that the HUI Index will move to the 150 level or very close to it.

Before we summarize, let’s turn to our final chart – the gold stocks:gold ratio. After all, gold stocks used to lead gold both higher and lower for years (not in the very recent past, though).

radomski november62013 4

Looking at the above chart featuring gold stocks performance relative to the underlying metal – gold, we clearly see that the ratio reached its medium-term resistance line (similar to what we saw in case of gold, silver and the HUI index), but there was no breakout above this line, which is a medium- and short-term bearish factor.

Although we saw an invalidation of the breakdown below the previous 2013 low, the long-term trend remains unchanged – we have the ratio below the 2008 low and the breakdown below this low was already confirmed.

Summing up, looking at the current situation in the Euro index we see that the implications for the precious metal market are no longer bullish in the short term as currencies have already reversed and the USD Index has done so at the cyclical turning point. It might be the case that we are looking at the very early days of a major downswing in the Euro Index and a rally in the USD Index. Taking this into account and combining it with the medium-term outlook for the mining stocks, it seems that the medium term trend in the precious metals market remains down.

Thank you for reading. Have a great and profitable week!

Przemyslaw Radomski, CFA

Founder, Editor-in-chief

Gold Price Analysis Website – SunshineProfits.com

* * * * *

Disclaimer

All essays, research and information found above represent analyses and opinions of Przemyslaw Radomski, CFA and Sunshine Profits’ associates only. As such, it may prove wrong and be a subject to change without notice. Opinions and analyses were based on data available to authors of respective essays at the time of writing. Although the information provided above is based on careful research and sources that are believed to be accurate, Przemyslaw Radomski, CFA and his associates do not guarantee the accuracy or thoroughness of the data or information reported. The opinions published above are neither an offer nor a recommendation to purchase or sell any securities. Mr. Radomski is not a Registered Securities Advisor. By reading Przemyslaw Radomski’s, CFA reports you fully agree that he will not be held responsible or liable for any decisions you make regarding any information provided in these reports. Investing, trading and speculation in any financial markets may involve high risk of loss. Przemyslaw Radomski, CFA, Sunshine Profits’ employees and affiliates as well as members of their families may have a short or long position in any securities, including those mentioned in any of the reports or essays, and may make additional purchases and/or sales of those securities without notice.


Vanc Housing Now Terrifically Un-Popular, Dramatically Less So In Calgary


Vancouver 84% bearish – Calgary 33% bearish –Toronto 71% bearish 

1102103


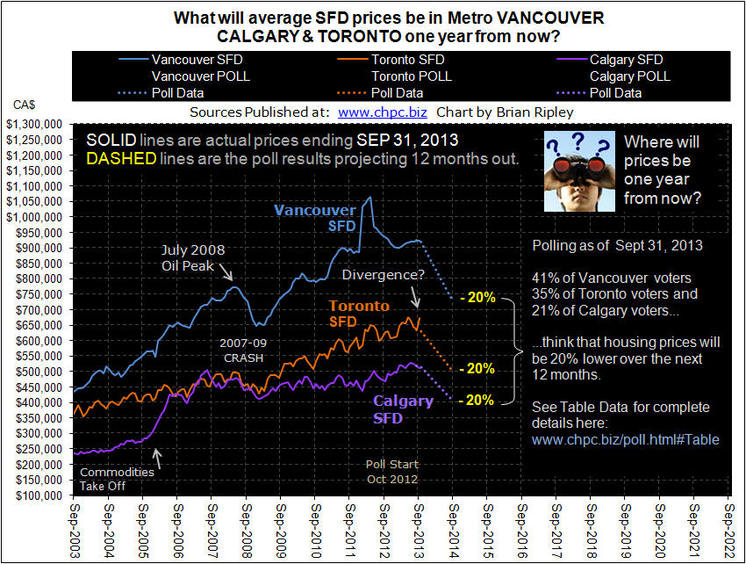
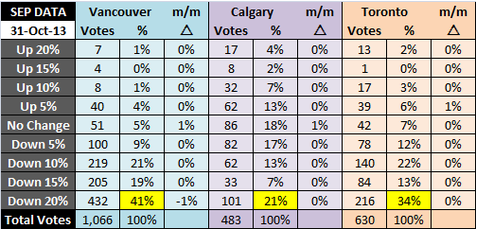
Oct 31/13 Poll based on Sept sales and pricing data: If you ignore the “No Change” and calculate the difference between the total “Ups” and the total “Downs” then the opinions are:

  • Vancouver 84% bearish
  • Calgary 33% bearish
  • Toronto 71% bearish 

Total bearish sentiment ticked down 1% M/M in Vancouver and Calgary. Toronto bearishness dropped 2% M/M

The previous month was:

  • Vancouver 85% bearish
  • Calgary 34% bearish
  • Toronto 73% bearish 

A plurality on this page still opines that a 20% price drop will unfold over the next year.

Polling Results of where you think average Vancouver, Calgary and Toronto single family detached prices will be 1 year from now. Charts going back to Dec 2012 HERE (scroll down a touch)

Screen Shot 2013-11-06 at 10.17.57 AM


Want to give your opinion – go HERE


How To Hit A Home Run In Life

Michael Mike Campbell image Or for that matter, how to strike out in life…. 

{mp3}mcbuscomnov6fp{/mp3}

Dow Blasts To Record Highs!

Screen Shot 2013-11-06 at 7.28.55 AM

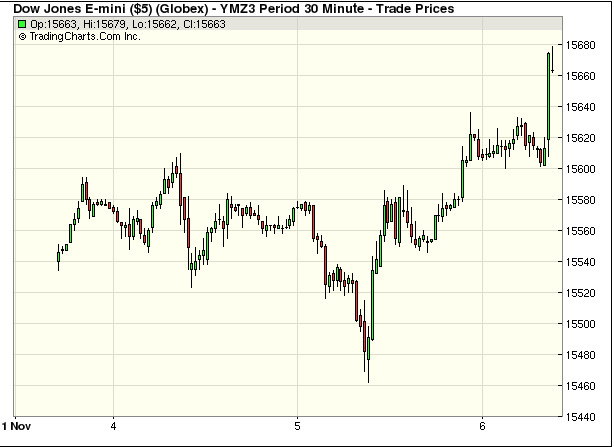
The remarkable bull run in the stock market continues.

Moments ago, the Dow Jones Industrial Average got as high as 15,731. This is an all-time intraday high.

The S&P 500 is within points of its all-time high.

This comes amid little market-moving news.

Some experts have warned that stocks may be in the process of forming a bubble. But relative to previous all-time highs, other experts note that the fundamentals of the stock market are much more robust.

On Friday, the Bureau of Labor Statistics will publish its October jobs report.

“If one word characterizes the market’s likely reaction, it’s asymmetric,” reported BI’s Matthew Boesler previewing the jobs report. “Most seem to agree that, as Citi global head of G-10 FX strategy Steven Englander puts it, “a good number is unambiguously good, whereas a bad number is ambiguously bad.””

Wall Street economists polled by Bloomberg are looking for 120,000 nonfarm payrolls in October, down from 148,000 in September.


October Ivey PMI in Canada jumped to 62.8 vs an expected level of 51. This print is the highest level since June of this year.

On the release the Canadain Dollar futures have jumped, trading up 40pts to 95.89.


Drew Zimmerman

Investment & Commodities/Futures Advisor

604-664-2842 – Direct

604 664 2900 – Main

604 664 2666 – Fax

800 810 7022 – Toll Free

dzimmerman@pifinancial.com