
Personal Finance
This chart shows the average detached housing prices for Vancouver, Calgary, Edmonton, Toronto, Ottawa* and Montréal* In October 2013 only Toronto and Ottawa rallied into the seasonal highs and pushed prices back up to resistance and in the case of Toronto posted new record prices. The daring bids are up against the seasonal shift towards slowing sales and shrinking inventory through the winter into February as can be seen on the new rebuilt Vancouver, Calgary and Toronto charts.
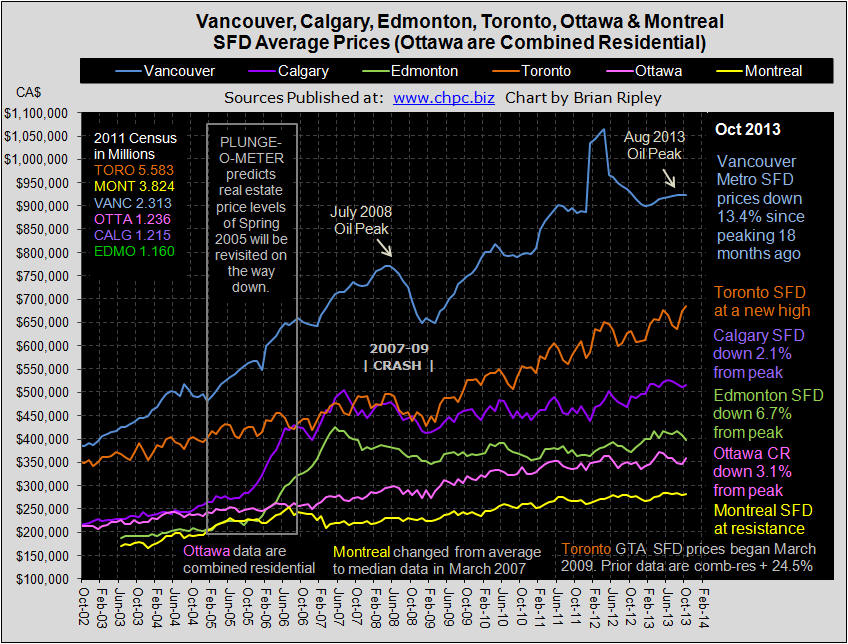
Toronto prices took flight again just missing a repeat of the trifecta set in May 2013. Seasonally we can expect sales to drop now into next spring.
VANCOUVER average single family detached prices in October 2013 came in exactly flat M/M and remain 13.4% ($142,200) below their peak set last April 2012 (Vancouver Chart). Vancouver total residential sales are working on completing the second step down since the rush out of the March 20089 pit of gloom. Average strata units continue to trade at 3Q 2007 prices as total residential inventory continues dropping typically hitting a seasonal low in the spring. If you are thinking of buying a Vancouver Condo as an Investment, see my Vancouver Condo Yield Case Study and now that you have the September data, where do you think Vancouver SFD prices will be one year hence? VOTE HERE.
CALGARY average detached house prices in October 2013 met with more resistance as did condo prices (Calgary Chart) just below the June 2013 peak (Plunge-O-Meter), while Townhouse prices zoomed to a new record high to the degree that Calgarians are now willing to trade one house for only 1.4 townhouses as total residential inventory drops into 2009 levels. Alberta remains a different country with respect to record high earnings and the sentiment in Calgary is the least bearish (34% bears to bulls) of the 3 markets polled with only 21% of the survey thinking Calgary SFD prices will be 20% lower in 12 months. What do you think? VOTE HERE.
EDMONTON average detached house prices in October 2013 continued rolling over (Canada Chart) and are 6.7% below the May 2007 peak SFD price (Plunge-O-Meter).
TORONTO average detached house prices and condo prices in the GTA in October 2013 zoomed to new record highs just missing a repeat of the trifecta set in May 2013 (Toronto Chart). Total residential sales and inventory have already turned down having peaked in the summer. The gap between Vancouver and Toronto SFD housing prices (Vancouver vs Toronto) narrowed to 34% more expensive in Vancouver. The GTA may have appeal to the HNWI as a “safe” haven but the media does not rate Toronto as investment grade. Polled sentiment here continues to suggest that prices will be down another 20% in 12 months. What do you think? VOTE HERE.
OTTAWA average detached house prices are not available, instead the chart on this site reflects Ottawa’s average combined residential prices. OREB’s report is sparse and opaque. In October 2013 Ottawa combined residential prices caught a bid and headed back up to resistance 3.1% below the April 2013 April (Plunge-O-Meter).
MONTREAL median (not average) detached house prices in October continued to trade in a range just below the May & June 2013 record price peaks (Canada Chart). In the 2011 Census, Montreal added 6.4% more dwelling units while only adding 5.2% more people. There is no shortage of housing, but there is a shortage of earnings; the Province of Quebec ranks 7th in Canada’s 10 provinces for earnings and printed an unemployment rate of 8.2% in July (0.6% above Ontario’s).


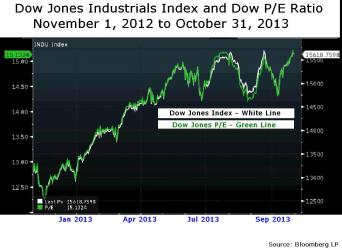
Last month, for the first time I could recall, Ben Bernanke, the Chairman of the U.S. Federal Reserve, claimed that he was concerned about the U.S. Labor Force Participation Rate (See chart above).
This morning it was reported that the Participation Rate fell again in October to 62.8% from 63.2% in September. The last time it was this low was 1978.
The Participation Rate is defined as the employed percentage of the total number of people who are able to work. Social benefits are a major contributor to this statistic, especially in times when it is more difficult to get a job.
The challenge for Ben Bernanke, Janet Yellen (the presumptive future chairman), and the Federal Reserve is to find new ways to improve the Participation Rate if they truly consider it to be important. This is because their current policy of Quantitative Easing-related money-printing has not done a thing. All the way through the QE era, the trend in Labor Participation has been down. So much for $3 trillion in monetary expansion.
If anything, this will cause the Federal Reserve to delay the start of the Tapering of the current round of Quantitative Easting (QE3) and/or slow the pace of Tapering once it does start. This will create some foundation under stock prices and help to limit sudden drops in the bond market (even though the 32-year secular bull market in bonds ended in July 2012).
The opinions expressed in this report are the opinions of the author and readers should not assume they reflect the opinions or recommendations of Richardson GMP Limited or its affiliates. Assumptions, opinions and estimates constitute the author’s judgment as of the date of this material and are subject to change without notice. We do not warrant the completeness or accuracy of this material, and it should not be relied upon as such. Before acting on any recommendation, you should consider whether it is suitable for your particular circumstances and, if necessary, seek professional advice. Past performance is not indicative of future results.
Richardson GMP Limited, Member Canadian Investor Protection Fund.
Richardson is a trade-mark of James Richardson & Sons, Limited. GMP is a registered trade-mark of GMP Securities L.P. Both used under license by Richardson GMP Limited.

Energy Trends Are Kind To Investors
The energy industry’s unique place in the global economy creates an endless stream of bull markets and big trends.
For example, recently the big trends have been hitting one after the other, producing gains like…
– 1,157.63% gains from the bull market in solar – enough to turn a $20k investment into $178,000…
– 1,689.94% gains from the bull market in oil tankers – enough to turn every $20k invested into $357,988…
– 2,431.745% gains from the bull market in North American on-shore drill rigs – enough to turn every $20k invested into $506,350…
These are five trends investors should be paying the most attention to right now because so much industry money is piling into them…
1. The Super Boom in Subsea Infrastructure. The Oil & Gas industry is increasing investment FIVE TIMES over from $27 billion a year to $130 billion a year on new unseen infrastructure.
2. The Boom in Oil Production technology that is TRIPLING the value of existing wells: It’s an investor’s dream-come-true because it is the equivalent of re-discovering every known oil-field TWICE OVER.
3. The Boom in Hyper Oil & Gas Hunting. New technology discovers new oil & gas fields FIFTEEN TIMES FASTER than earlier methods. This tech is sweeping through the industry like wild-fire as explorers race to find new fields first… but the tech is where investors will make the biggest returns, the fastest.
4. The $200 Billion Boom in Specialized Engineering Firms: A pipeline of $10 billion + projects easily totaling over $200 billion will likely make these engineering firms – and their investors – rich
5. The Multi-Billion Dollar Shale Revolution Goes Global.
For Example, 2. The Boom in Oil Production Technology that is Tripliing the value of existing oil wells works like this:
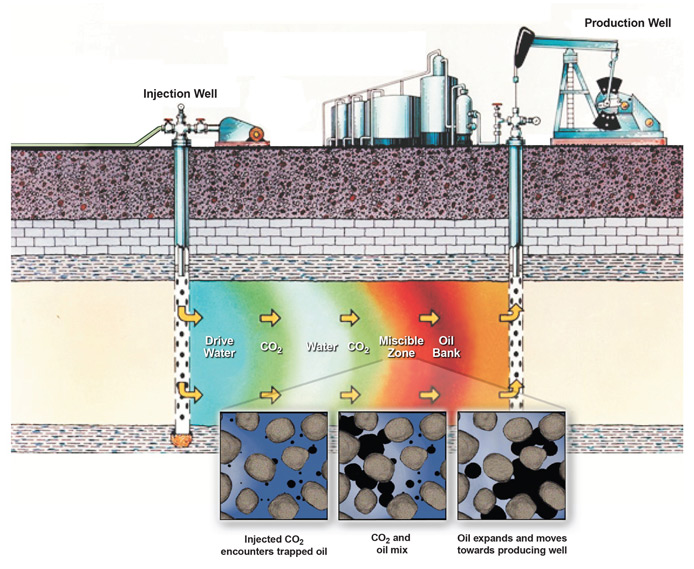
Step one: Capture CO2, Carbon gas, emitted by the refiners. Full operations will capture 90% of carbon dioxide emitted by refiners – enough to condense the carbon impact of 10 refineries essentially down to the size of one.
Step two: The CO2 is then transported directly to oil wells.
Step three: Where it is injected into the ground to increase pressure in the wells. When the CO2 mixes with the trapped oil the oil EXPANDS. The increased pressure pumps the oil out.
So for every $1 of oil produced in existing wells this process produces $2 more.
Just one oil field south of Houston, Texas, is looking at an increase from 1.6 million barrels of recoverable oil to 3.1 million barrels.
This technology is a MAJOR NEW PROFIT CENTER for the oil industry.
If you can consistently get in front of these big trends then you can produce staggering gains.
For example, if you’d been investing along industry insiders and caught the solar boom in 2006 you could’ve turned a $10,000 investment in First Solar into $125,763 in three short years.
Then, if you grabbed the next big energy trend, the shale railroad boom (The boom in rail was caused by the overabundance in shale oil overwhelming existing pipelines), you could’ve turned that $125,000 into $669,012 in another four years.
That’s just two energy trends but together they could’ve turned your $10k initial investment into over $669,000 in about 7 years.
To put that in perspective consider the S&P 500 during the same period delivered a cumulative 7-year return of just 14.24% – or only enough to grow a $10,000 investment into $11,424.
James Stafford

Tomorrow’s Copper Demand
According to the Minerals Education Coalition every American born will need 978 pounds of copper over their lifetime.
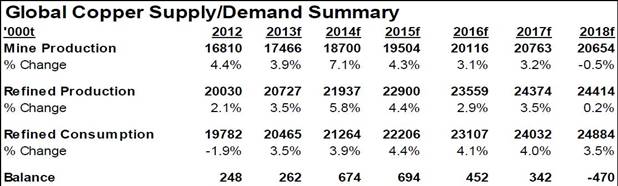
We can see in the above Wood MacKenzie, Macquarie Research graph, from an August 2013 report, a projected refined shortage in 2018. The surplus forecast between now and then is diminutive in relation to the sheer size of the copper market and copper production often falls short of forecasts due to accidents, strikes, ore degradation or power shortages. Disruptions in the copper market averaged 900,000 tonnes of copper supply per year between 2004 and 2012.
We already have one billion people out of today’s current population slated to become significant consumers by 2025.
Another 2.8 billion people will be added to the world between now and 2050. Most will not be Americans but they are going to want a lot of things that we in the western developed world take for granted – electricity, plumbing, appliances, AC etc.
Out of a total of 10 billion people in 2050, 8.2 billion of them are expected to be in developing countries.
How much copper could they expect to use over their lifetime?
Will they each use 978 lb’s of copper in their life time? Is there 8 plus trillion pounds of new copper left to be mined in the world?
Probably not…
According to a September 2013 report from the United States Geological Survey (USGS) global land-based copper resources (contained in identified, mined, and undiscovered resources – undiscovered resource numbers are based on geological modeling, the copper should, might, be there) exceed 3 billion tons (6 trillion pounds). These identified, mined, and undiscovered resources do not include deep-sea nodules and submarine massive sulfides.
“Infinite growth of material consumption in a finite world is an impossibility.” E. F. Schumacher
“We’re living in a finite world, one in which resource constraints are becoming increasingly binding.”Paul Krugman, ‘The Finite World’
Conclusion
If we mined every last discovered, and undiscovered, pound of land based copper the expected 8.2 billion people in the developing world would only get three quarters of the way towards copper use parity per capita with the U.S.
Of course the rest of us, the other 1.8 billion people expected to be on this planet by 2050, aren’t going to be easing up, we’re still going to be using copper at prestigious rates while our eastern cousins play catch up.
Copper use parity isn’t going to happen, it can’t.
It’s this author’s opinion the developing world will not get a third of the way to our development levels here in the west before we all run out of USGS stated copper resources to mine.
Consider that this game of ‘Copper Catch Up’ is not going to happen in 100 years, it’s happening now.
The world’s exploding population, the massive shift from rural to urban, the growth of a very consumption minded middle class in developing countries, it’s all happening now.
Add in finite, increasingly hard to source resources.
The effects will felt long before we actually start to run out of copper and there will be severe consequences:
- Rising energy and commodity prices
- A decline in the global economy
- Civil unrest
Are the coming consequences of living in a finite world on your radar screen?
If not, they should be.
Richard (Rick) Mills
About Richard Mills
Richard is the owner of Aheadoftheherd.com and invests in the junior resource/bio-tech sectors. His articles have been published on over 400 websites, including:
WallStreetJournal, USAToday, NationalPost, Lewrockwell, MontrealGazette, VancouverSun, CBSnews, HuffingtonPost, Londonthenews, Wealthwire, CalgaryHerald, Forbes, Dallasnews, SGTreport, Vantagewire, Indiatimes, Ninemsn, Ibtimes, Businessweek, HongKongHerald, Moneytalks and the Association of Mining Analysts.
If you’re interested in learning more about the junior resource and bio-med sectors, and quality individual company’s within these sectors, please come and visit us at www.aheadoftheherd.com
If you are interested in advertising on Richard’s site please contact him for more information,rick@aheadoftheherd.com
***
Legal Notice / Disclaimer
This document is not and should not be construed as an offer to sell or the solicitation of an offer to purchase or subscribe for any investment.
Richard Mills has based this document on information obtained from sources he believes to be reliable but which has not been independently verified.
Richard Mills makes no guarantee, representation or warranty and accepts no responsibility or liability as to its accuracy or completeness. Expressions of opinion are those of Richard Mills only and are subject to change without notice. Richard Mills assumes no warranty, liability or guarantee for the current relevance, correctness or completeness of any information provided within this Report and will not be held liable for the consequence of reliance upon any opinion or statement contained herein or any omission.
Furthermore, I, Richard Mills, assume no liability for any direct or indirect loss or damage or, in particular, for lost profit, which you may incur as a result of the use and existence of the information provided within this Report.

Over the past year I have noticed that Cameco (CCO) will make an appearance every few months in the technical and fundamental research that comes across my desk. This week it happened again, with one particular technical analyst making the case for the third time in 12 months as to why the stock is poised to rise to interim highs if it can just break through resistance in the low 20’s. (CCO currently trades near $20). This kind of research is focused on the shorter-term. As a result, when things don’t unfold in a timely manner, repeating the initial call is common practice unless there has been something dramatic to change the viewpoint of the technical analyst.
In addition, there have been a number of fundamental analysts, as well as one of the few newsletter writers that I actually like, who have all made a very compelling long-term case for buying the stock.
The long-term story is fairly simple. The world’s energy needs can’t be met through fossil fuel sources and alternative (green) sources continue to be extremely disappointing at this stage. As a result, relatively clean nuclear energy will be the eventual choice, especially for current energy-importing countries that don’t appear to have potentially dazzling shale deposits to be discovered and tapped.
So, why is CCO stuck in a range? (See chart above).
One word: Fukushima.
The incident in Japan still resonates with the public. In fact, it is still allowing for the press to publish stories that border on extremism. This week, there was a story that highlighted a speech by David Suzuki who stated that if another earthquake of greater than 7.0 were to hit Fukushima right now, the West Coast of North America might have to be evacuated. While there has not been a rush of scientists scrambling to back up Dr. Suzuki’s claim, the mood is sufficient to let the story stand without a whole lot of rebuttal.
So, it will take time for this issue to pass. Eventually, tough choices will have to be made and pragmatism will take charge. At this stage, the cost and benefits of more nuclear energy will have to be given a fair hearing. CCO should look a lot more reasonable and may be able to break the tether to its current trading range. But, waiting for that to happen also has its costs.
Cameco Corporation is not held in the McIver-Jasayko Model Portfolios as of November 8, 2013. Comments about these investments are not intended as advice and do not constitute a recommendation to buy, sell, or hold.
The opinions expressed in this report are the opinions of the author and readers should not assume they reflect the opinions or recommendations of Richardson GMP Limited or its affiliates. Assumptions, opinions and estimates constitute the author’s judgment as of the date of this material and are subject to change without notice. We do not warrant the completeness or accuracy of this material, and it should not be relied upon as such. Before acting on any recommendation, you should consider whether it is suitable for your particular circumstances and, if necessary, seek professional advice. Past performance is not indicative of future results.
Richardson GMP Limited, Member Canadian Investor Protection Fund.
Richardson is a trade-mark of James Richardson & Sons, Limited. GMP is a registered trade-mark of GMP Securities L.P. Both used under license by Richardson GMP Limited.

-
I know Mike is a very solid investor and respect his opinions very much. So if he says pay attention to this or that - I will.
~ Dale G.
-
I've started managing my own investments so view Michael's site as a one-stop shop from which to get information and perspectives.
~ Dave E.
-
Michael offers easy reading, honest, common sense information that anyone can use in a practical manner.
~ der_al.
-
A sane voice in a scrambled investment world.
~ Ed R.
Inside Edge Pro Contributors

Greg Weldon

Josef Schachter

Tyler Bollhorn

Ryan Irvine

Paul Beattie

Martin Straith

Patrick Ceresna

Mark Leibovit

James Thorne

Victor Adair