

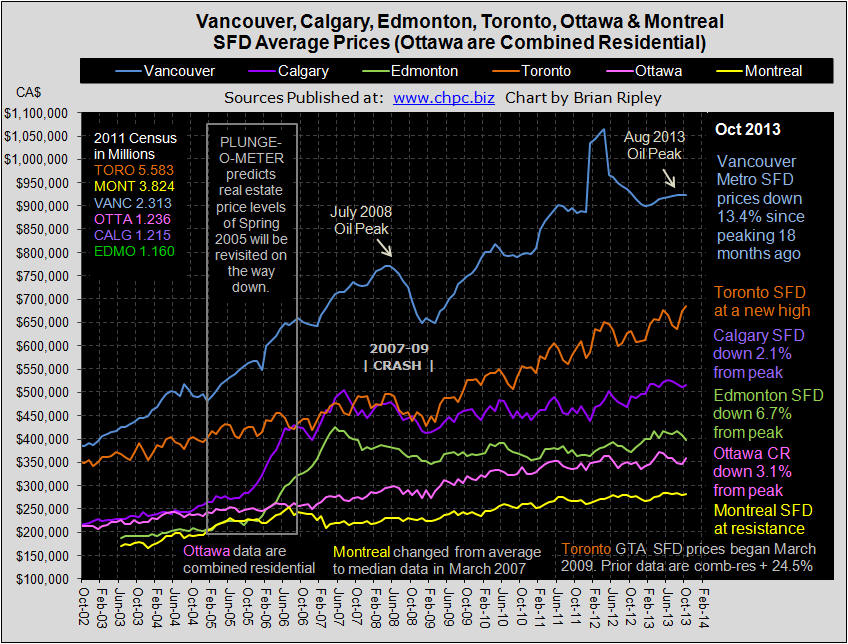
This chart shows the average detached housing prices for Vancouver, Calgary, Edmonton, Toronto, Ottawa* and Montréal* In October 2013 only Toronto and Ottawa rallied into the seasonal highs and pushed prices back up to resistance and in the case of Toronto posted new record prices. The daring bids are up against the seasonal shift towards slowing sales and shrinking inventory through the winter into February as can be seen on the new rebuilt Vancouver, Calgary and Toronto charts.
Toronto prices took flight again just missing a repeat of the trifecta set in May 2013. Seasonally we can expect sales to drop now into next spring.
VANCOUVER average single family detached prices in October 2013 came in exactly flat M/M and remain 13.4% ($142,200) below their peak set last April 2012 (Vancouver Chart). Vancouver total residential sales are working on completing the second step down since the rush out of the March 20089 pit of gloom. Average strata units continue to trade at 3Q 2007 prices as total residential inventory continues dropping typically hitting a seasonal low in the spring. If you are thinking of buying a Vancouver Condo as an Investment, see my Vancouver Condo Yield Case Study and now that you have the September data, where do you think Vancouver SFD prices will be one year hence? VOTE HERE.
CALGARY average detached house prices in October 2013 met with more resistance as did condo prices (Calgary Chart) just below the June 2013 peak (Plunge-O-Meter), while Townhouse prices zoomed to a new record high to the degree that Calgarians are now willing to trade one house for only 1.4 townhouses as total residential inventory drops into 2009 levels. Alberta remains a different country with respect to record high earnings and the sentiment in Calgary is the least bearish (34% bears to bulls) of the 3 markets polled with only 21% of the survey thinking Calgary SFD prices will be 20% lower in 12 months. What do you think? VOTE HERE.
EDMONTON average detached house prices in October 2013 continued rolling over (Canada Chart) and are 6.7% below the May 2007 peak SFD price (Plunge-O-Meter).
TORONTO average detached house prices and condo prices in the GTA in October 2013 zoomed to new record highs just missing a repeat of the trifecta set in May 2013 (Toronto Chart). Total residential sales and inventory have already turned down having peaked in the summer. The gap between Vancouver and Toronto SFD housing prices (Vancouver vs Toronto) narrowed to 34% more expensive in Vancouver. The GTA may have appeal to the HNWI as a “safe” haven but the media does not rate Toronto as investment grade. Polled sentiment here continues to suggest that prices will be down another 20% in 12 months. What do you think? VOTE HERE.
OTTAWA average detached house prices are not available, instead the chart on this site reflects Ottawa’s average combined residential prices. OREB’s report is sparse and opaque. In October 2013 Ottawa combined residential prices caught a bid and headed back up to resistance 3.1% below the April 2013 April (Plunge-O-Meter).
MONTREAL median (not average) detached house prices in October continued to trade in a range just below the May & June 2013 record price peaks (Canada Chart). In the 2011 Census, Montreal added 6.4% more dwelling units while only adding 5.2% more people. There is no shortage of housing, but there is a shortage of earnings; the Province of Quebec ranks 7th in Canada’s 10 provinces for earnings and printed an unemployment rate of 8.2% in July (0.6% above Ontario’s).


