Not all energy options are equally good, says Thomas Drolet, principal of Drolet & Associates Energy Services Inc. Using an “Energy Return on Energy Invested (EROEI)” calculation to decide which energy sources yield the most for the least energy investment, Drolet sees hydroelectricity, natural gas, uranium and coal at the top of the list. Drolet adds that the need for reliable power will keep baseload power fueled by uranium and coal at the center of the world’s electricity systems for many years, but he tips The Mining Report to some technologies looking for investment that can help make coal a more environment-friendly fuel.
COMPANIES MENTIONED: AREVA SA : BABCOCK & WILCOX CO. : CAMECO CORP. : COALSPUR MINES LTD. : DENISON MINES CORP. : LAKELAND RESOURCES INC. : MICROCOAL TECHNOLOGIES INC. : RIO TINTO PLC : SKYHARBOUR RESOURCES LTD. : U3O8 CORP. : UR-ENERGY INC. : ZIMTU CAPITAL CORP. RELATED COMPANIES: URANERZ ENERGY CORP.
The Mining Report: Tom, thanks for joining us today. I’d like to start out with the concept of an “Energy Return on Energy Invested cliff,” which is being debated widely these days.” What is it and what does it mean for the future of mining energy resources?
Thomas Drolet: When you invest money in a new energy system, say, hydroelectric, you may spend $2 billion building a hydroelectric dam, but the device works for hundreds of years. Energy planners and thinkers have created a ratio, an index of the energy return divided by the energy invested in putting that energy system in place. For a hydroelectric plant, the water (the fuel, if you will) is basically free and it flows for literally centuries, yielding a very high ratio. Let’s call it 100 for now. But in generating coal-fired power, there are losses at the station, in the transmission from the coal plant, the distribution transformers and finally, when you use it in your light bulb at home, where there are further losses by heat radiation. All those losses yield a ratio number of somewhere in the area of 20 to 30. At the bottom of the scale is corn-based ethanol, perhaps the worst example that we have today. It takes a lot of energy to grow corn—tractor fuel, fertilizer, shipping of the corn to the ethanol production distilleries and distribution of that ethanol in tanker trucks. Then there’s the loss of energy in the engines in our normal cars and trucks. That ratio may be down below 6.
Source: Thomas Drolet
The more we use of these soft energy forms that don’t return as much energy for the energy invested in the facility, the weaker the energy returns to overall society will be. My fervent plea is for society to continue to look at a wide portfolio of energy fuels and energy-generating techniques that keep from going too far over that cliff edge toward the low return end. We need the hydroelectrics. We need the nuclear power that is up in the 20–30 range. We need the natural gas in the 20–25 range. Yes, we should add the solars and the winds, which are in the 10–20 index range. But, let’s not go too far down. We’re sitting today somewhere around 15–20 as an average ratio return for the energy invested, and society’s working at that level. Let’s not go down below 6. Societal regression and recession inevitably follow once you go over that cliff edge.
TMR: How do you weight coal versus uranium?
TD: Some people say there’s a war on coal in the U.S. and to some degree in Canada and much of our world. Overall, 40% of the world’s electricity is generated by coal. If that war were to start to shut down that 40% of our electricity capacity in a fast-paced, “blitzkrieg-like” fashion, the world would have trouble keeping the lights on, keeping our motors running, keeping our factories going, keeping our steel mills going. I believe coal is still a good investment because it’s a necessary investment to keep our world growth rate positive. We can’t have the world’s power-generating sources, like coal, go down too suddenly, because we have nothing but natural gas to quickly fill the void. Like our own investment portfolios, we should never put all our eggs in one basket.
Uranium and hydroelectricity are baseload power fuels, and these energy sources are the floor that electricity supply sits on. I believe in continuing to generate by both coal and uranium, in addition to a basket of many other fuel sources.
I know that much of society and many of our political leaders have already decided that climate change is real and is totally caused by humankind. I believe that CO2 emissions have an effect, but climate change is not completely caused by humankind. There are several causes, and I believe that the real scientific underpinnings of climate change should remain a worldwide debate until we are sure of all causes and effects. We should not close down our coal stations as quickly as some would have us believe we should. There are so many improvements that can be made to the existing fleet.
TMR: Germany and Japan seem to be cutting back on further development of their nuclear energy grids, and France, South Korea and China are moving ahead. What is the reason for the differential?
TD: It’s a case-by-case answer. In Japan, there’s a tug of war between industry, the government and the general populace—the government and industry desperately want to bring back some or all of the nuclear power stations—and the general populace is pretty much dead set against it. That tug of war will, in my opinion, end up bringing back approximately half of those units over the next five years, but it will be a slow and agonizing process.
In Germany, the political leadership just made a decision to shut down all 17 reactors; they’ve shut down 10 already, and the other seven will be shuttered over the next nine years. I’ve just returned from Germany. I’ve been talking to German business leaders and investors who don’t share the belief that all those stations should be shut down. Germany is by far the leading nation in the world when it comes to renewables, but I see a fear that the grid in Germany is starting to see minor effects on frequency and voltage, which affect some of their major manufacturing businesses. I continue to wonder whether all those stations will actually be shut down in the event of a future change in the German government.
The difference with other countries, like the U.K., France, China, India, the U.A.E. and Saudi Arabia, stems from a belief among the political leadership that there is a need for energy diversification. As the fight over coal and fracking comes and goes, some of these other nations are led by political leaders who are looking further ahead and are electing to stay with nuclear power, and in fact building on it.
TMR: The European Union is pushing away from coal, but Poland is clinging to it. Is that going to have a meaningful effect on European energy markets?
TD: Yes. Germany, the leading nation in the world in renewable power, is actually pushing back into coal out of necessity because of its decision on nuclear power. Poland has massive coalfields and is building new coal-fired stations. Other nations in Europe are continuing with coal. The Czech Republic, Slovakia, Romania and Bulgaria are all continuing with coal and building some new stations. It’s a real mixed message out of greater Europe. They do not all speak with one central “EU voice” when it comes to real, on-the-ground decisions.
TMR: Will that mean a bigger market for coal exports from North America?
TD: Yes it will, but given that most of Canada’s coal is in Alberta, B.C. and Saskatchewan, I think the preferential export markets for our coal will be in the Far East. While Japan debates its future nuclear restart schedule, it’s importing liquefied natural gas (LNG) from the Middle East, Indonesia and Australia as fast as it can. It’s also building new coal stations. Europe still has massive coal quantities in Ukraine and Poland, and much more of it in Eastern Europe, so I don’t see exports of Canadian coal going to Europe.
TMR: What do these trends mean for the business of uranium mining globally?
TD: When you subtract the approximately 70 nuclear power reactors either shut down or in the process of being shut down, mostly in Japan and Europe, there are actually about 370 power-producing nuclear reactors in the world today, consuming approximately 160 million pounds/year (160 Mlb/year) of uranium as U3O8. Another 65 reactors are actually being built today in China, in Russia, the U.A.E., Turkey, Finland, the UK and India. Now add what they say they’re planning behind that, and in 40 years there will be another approximately 370 reactors operating worldwide, the same number of reactors as is operating today.
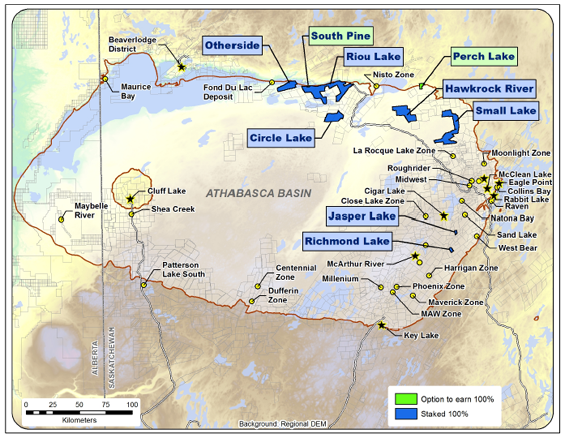
Where is that other 160 Mlb of U3O8 going to come from over the next 40 years? It has to come substantially from new mines in the Athabasca Basin in Canada, from Australia, from parts of Africa and from Utah, Colorado, Nevada and Wyoming in the U.S. It’s going to come from Mongolia and it’s going to come from other mines here and there in the Far East and in Slovakia.
Uranium prices right now are definitely in a bottoming process, but as a result, the uranium mining industry has a chance to get its act together and invest in new exploration and production (E&P). We’ve got time on our side because these new uranium mines, especially in Athabasca, are long-lead items. They’re 10 years from concept and exploration through to production. The in-situ recovery (ISR) projects don’t take as long to get going, so they have a real advantage in filling any early voids in supply that may arise. However, they’re working on much lower concentrations. Overall, I see a very good future for uranium, but we’ve got to use the time to get our act together.
TMR: What are some of the technological advances in nuclear energy that will address the future need?
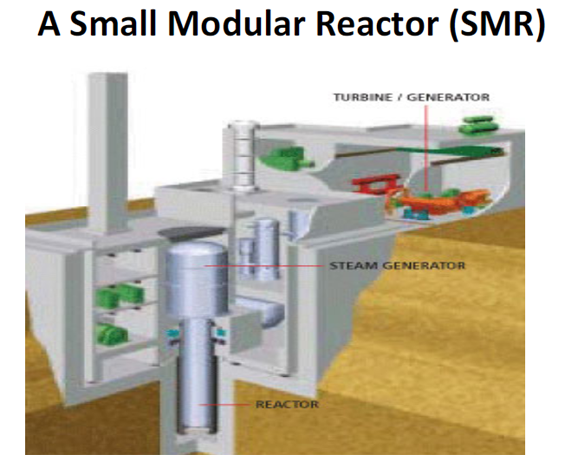
TD: Standard nuclear reactors being built today are gigantic units. Over the next decade, in my opinion, we’re going to see a shift to smaller units—small modular reactors (SMR)—for good and valid reasons of schedule and because the utilities want them as supply sources that fit their load growth profile better. A few examples are Babcock & Wilcox Co. (BWC:NYSE) and NuScale Power LLC (private) in the United States, which are being funded or potentially funded by the U.S. Department of Energy to bring on these smaller reactors in the early 2020s.
Source: Thomas Drolet
TMR: What about the advanced light water reactors, the third- and fourth-generation reactors? Are they going to be an equally important factor or are the SMRs going to crowd them out?
TD: The newer large reactors are better in so many respects than the earlier generation reactors that we have in the world’s nuclear fleet today. What with thermal siphoning capability, better fuel storage techniques, better cooling backup systems and passive safety features, they are a quantum step forward in safety and reliability. However, as I said before, I think they will be very gradually superseded by the SMRs over the next several decades. Some think that someday the ultimate nuclear reactor system is going to be based on a molten salt reactor (MSR) concept. MSRs are proliferation resistant, have much higher cycle efficiency and can produce copious quantities of heat for various industrial uses. It’s absolutely safe and lets you just dump the mixed coolant and dissolved fuel, in the event of any emergency. It can be built in small, medium or large sizes, but is better made into the small or medium sizes. China, France, India, Norway, Russia and even one company in Canada are working on the very early stages of development for various MSR configurations.
TMR: What will the U.K. reactor agreement do to the U.K.’s energy future, and does it contain features like a price multiplier?
TD: The U.K. thought through a long-term energy plan a couple years ago. The North Sea gas and oil that the country was relying on was starting to diminish, and the U.K. had to consider other options. It looked around at the 19 nuclear plants it already has in use, and considered whether it should continue with nuclear power. For a variety of reasons, it decided it had to go back to some level of nuclear power. I think it was a good decision. It appears, on the surface, to be a very expensive decision in terms of the rate that has been guaranteed by the providers. The French and the Chinese are going to fund most of the investment for the first couple units. But, the rate guarantee spans the lifetime of the reactors. Think what average electricity rates may be in place for other systems in 20 years!
TMR: What about the Canadian agreement not to require European uranium firms to partner with Canadian companies? Is that going to affect the uranium prices?
TD: Yes. I’m glad it happened. I think we’re going to have more investment in Canada, more mines being developed, especially in the Athabasca area. That investment will inevitably lead to quicker production from Athabasca and other Canadian uranium sources that are dotted across the country. I think it will eventually lead to lower prices and more Canadian uranium on the world markets. It’s a long-overdue step.
Source: Thomas Drolet
TMR: What companies do you like in the uranium industry?
TD: In Canada, we’ve got a series of majors working here. We’ve got, of course, Cameco Corp. (CCO:TSX; CCJ:NYSE) and Denison Mines Corp. (DML:TSX; DNN:NYSE.MKT)—good, well managed companies. We’ve got Rio Tinto Plc (RIO:NYSE; RIO:ASX; RIO:LSE; RTPPF:OTCPK), which has come into the Athabasca Basin through the acquisition of Hathor Exploration Ltd. Finally, among the majors we have AREVA SA (AREVA:EPA). I would assume these companies will all continue to expand their positions there as investors and eventual producers and operators of new Canadian mines.
In the junior category, we have a whole slew of new juniors up in the Athabasca Basin. I’m on the advisory boards of a few of these, but I’d like to highlight one of them. Lakeland Resources Inc. (LK:TSX.V) is a very well managed company backed by solid investor groups. The company has what looks like a series of very good properties up on the north rim of the basin that have been explored before. Lakeland may have a very good resource to operate. Of note is Skyharbour Resources Ltd. (SYH:TSX.V)—part of a Syndicate called the Western Athabasca Syndicate with properties in the Patterson Lake South area.
I do like a Canadian company that’s operating outside of Canada, U3O8 Corp. (UWE:TSX; UWEFF:OTCQX). U3O8 Corp. offers a very interesting proposition with potential near-term production from Argentina, backed up by a flagship project in Colombia. The Argentine project would involve the mining of uranium from soft gravels within a couple feet of surface in a supportive jurisdiction that is currently 100% dependent on imported fuel for its growing fleet of nuclear reactors. In addition, U3O8 is negotiating a definitive joint venture–type agreement over exploration concessions owned by the provincial government, on which U3O8 believes there is additional resource potential. This agreement would see U3O8 and the provincial government as equity partners. Development of the Argentine deposit would set the stage to advance the flagship project in Colombia, for which the preliminary economic assessment shows a zero cash cost for uranium, thanks to byproduct revenues.
In the States I do like companies that have been bought up now, like Strathmore. Ur-Energy Inc. (URE:TSX; URG:NYSE.MKT) looks like a pretty good company. Fairly high debt, but it’s now producing. It seems to have its debt issue taken care of better than it was a while ago.
TMR: Is the market stability of Lakeland Resources an issue for you?
TD: It’s down on the bottom these days. But surely the Lakelands of this world will come up as they make real progress. I believe value will be driven, as always, by real results.
TMR: Zimtu Capital Corp. (ZC:TSX.V) has a stake in Lakeland.
TD: Zimtu has an interesting business model in that it has a collection of companies that it has taken various positions in and nurtured, when required, with good people and marketing savvy. Zimtu scours various countries for investments and nurtures a stable of companies. I think the Zimtus of this world are a good thing for juniors to have backing them at early stages.
TMR: What is the role of the Western Athabasca Syndicate you mentioned above, and what’s the role of the companies within it?
TD: Collectivism is a good thing, driven by necessity in the markets of today. I do know syndicate member Skyharbour Resources reasonably well, and that’s a good way to survive in tough times. Not only does the Western Athabasca Syndicate bring different sources of treasury money together so you get more bang for your buck, but in this case, it also brings together different sources of expertise. One syndicate member has particularly good expertise in landholdings and ability to get land. Another is a good investment grabber. The other two are good drillers and explorers. I think each member brings something to the table that makes for a very strong, four-legged table. I like the idea.
TMR: Are there any other uranium companies you’d like to talk about?
TD: There’s one private company I’ll mention. Ualta Energy Ltd. is the best example I can think of in innovation in the uranium mining business today. It’s not publicly listed, but is looking for investment now. It has uranium deposits in southern Alberta in two gigantic swaths, 40 kilometers long, several meters thick, just below Lethbridge north of the U.S. border. The uranium is associated with shells from the former inland sea that used to cover Saskatchewan and Alberta.
Ualta has potentially discovered a source of hundreds of millions of pounds of uranium in these bone fragments through looking at old oil and gas cores that were drilled by earlier resource explorers. Ualta is drilling vertically, turning the bit and drilling horizontally, and then using ISR solutions to dissolve the uranium from the long strike lengths containing uranium-bearing bone fragments. ISR together with horizontal drilling is a very innovative combination of known technologies that can be brought together in a unique deposit like this. I think one of these days we’ll see Ualta coming up the pipe as a very viable new uranium entity in Canada.
TMR: I’d like to go back to coal for just a minute. You touched briefly on the EPA rulings. What about the new technology for combusting coal and restricting the emissions? Is there hope in the new technology for coal?
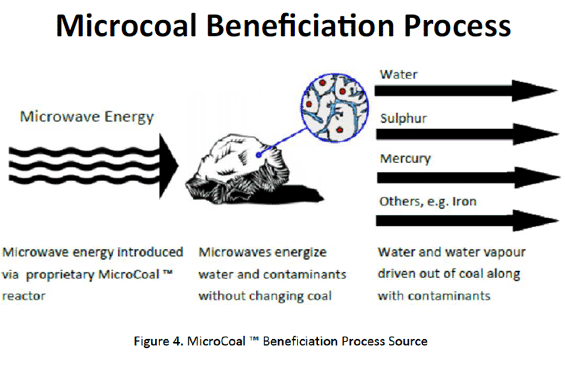
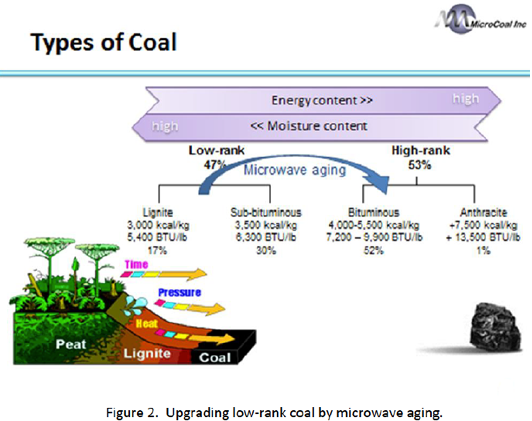
TD: Yes, and there’s a new company out there that is just getting going with its first project in Indonesia. It’s called MicroCoal Technologies Inc. (MTI:CNSX). The company has developed a method that partially dries coal using microwave energy in a vertical tube. You take the coal off the coal pile, which has a variable amount of moisture in it, and filter the coal through a tube that is surrounded by microwave antenna heads that remove some of the moisture from the coal.
That actually does three things for you: First, it means that the thermal-unit value of the coal that’s actually blown into the boiler for combustion is greater because you’ve removed some of the water, which would take up some of the energy in the boiler if it were still there to combust. Basically, it’s pretreating the coal to be a more efficient source of energy. Second, studies have shown that some of the sulfur and mercury is precipitated out in that process. Finally, the coal ash is less sticky, and adheres less to the baghouses that are the final particulate-removal step for the combusted gases coming out of the coal-fired stations. It’s therefore easier to clean the surfaces of the baghouse.
Source: MicroCoal Inc.
MicroCoal Technologies has its first project underway in Indonesia. Once that is up and running, I see a very good future for that technology at coal-fired stations everywhere that have a reasonable amount of moisture in the coal. MicroCoal’s technology has other potential applications with other utilities in Indonesia, once this small prototype is up and running. I think the company will likely get going on some projects in North America, both Canada and the States, I hope in the near future. It’s also working on projects in Poland.
Source: MicroCoal Inc.
TMR: You cover Coalspur Mines Ltd. (CPT:TSX; CPL:ASX), which has a large property in northern Alberta. Its share price dropped dramatically about a year and a half ago. Is there a good reason to buy it today?
TD: I like the company. Coalspur is a well managed company with a great property at Vista. Its market for thermal coal is the Far East. Japan, China and South Korea are begging for more supply. Coalspur is undergoing an ongoing series of hearings and will likely see a spike in December as it pursues mine permits. I have no doubt Coalspur will succeed. The company has a great technical team that will be augmented by a strong engineering, procurement and construction partner. The difficulties right now involve the down condition of the whole market, the need to bring in the financing and the large number of shares outstanding. I believe Coalspur will work through all the issues with the good people it has. The key is access to financing in a tough market.
TMR: Tapping into deep geo-pressurized reservoirs of hot natural gas-saturated brine that underlies many abandoned oil and gas wells may be a significant new energy source that could result in future baseload electricity production. What firms of interest are involved in this type of venture?
TD: Two or three companies in the United States are looking actively at this particular source of abandoned energy, and I am president and CEO of another, a private company in Canada called Greenwell Renewable Power Corp. (GRPC). There are about three million abandoned oil and gas wells in Canada and the States. About 3% are underlain at depth—12,000–14,000 feet—by gigantic fields of brine. These brines contain dissolved natural gas, and the brines are hot because of the depth—300 degrees Fahrenheit, 180 degrees Celsius.
As oil and gas companies sealed up their wells because they had no more production, a few companies, ours included, started to look at how they could tap into that abandoned, ready-to-use energy source. We found we can take this source of energy, the natural gas and the hot brine, and create electricity using the potential energy in the flowing brine and piping it up to the surface plant. About 20,000 barrels/day (20 Mbbl/d) of brine, at 300 degrees F, containing 75 standard cubic feet of natural gas/barrel of brine can be put through a series of three machines. The first machine is called a kinetic energy engine, which captures the kinetic energy in the flowing steam and produces electricity. It’s our GRPC proprietary new technology. Then we can capture the heat in the brine through a conventional Organic Rankine Cycle engine (ORC), a decades-old technology, and that also produces electricity. Finally, we can then reduce the pressure in this flowing brine stream that’s had the temperature taken way down, capture the dissolved natural gas and then burn it in a standard reciprocating or rotary engine to produce electricity.
We’re working on a project in the south central part of the U.S. that will produce 6-plus MW of electricity out of 20 Mbbl/d of flowing brine. I’m truly excited about the potential because the overall business enterprise is ultimately just putting together a series of small independent power plants dotted all over in these areas of abandoned oil and gas wells. Here we thought we were finished with those abandoned wells! No, we sure aren’t finished. There’s more energy to come.
We’re still doing our final homework. We do have a private placement out to complete the work, but we’re hopeful to have it packaged up and ready to go by the end of this year on our first project. It only takes about nine months to construct the surface power plant and prepare the abandoned wells. Once we get stable performance out of our first project, roughly by the end of next year, we can start our second project, and move on to other projects.
TMR: How would you advise investors in the mining stocks that you deal with? Should they go all out for uranium or for coal or for some other resource?
TD: Easy to say, but do a little bit of a lot of things that make sense, assuming growth in the world will ramp up again. Don’t concentrate all your dollars in one area. Spread it around into areas that you believe your due diligence shows have a good shot looking forward, because we are at a bottom in so many of these resource materials.
I believe coal has a future. I think some of the coal technologies—I’ve just mentioned one—is a particularly good place to look. I think that coal mining companies that operate in the Powder River Basin and the western part of Canada have the best shot. I think copper, tin and zinc will inevitably come back.
On the precious metals side, I will say that as the central banks of the world continue to print money, I have convinced myself that gold and silver and platinum/palladium have a real place in our future. Quantitative easing, as practiced by some many of the major Central Banks, is inevitable. If anything, we’re in a bit of a deflationary situation at the moment, but if the world is to survive, then we’re going to have to somehow inflate and grow out of this, probably by both growth and inflation. Therefore, the precious metals do have a place in your portfolio.
TMR: Thanks. You’ve given us a terrific amount to think about. I appreciate your time.
Thomas Drolet is the principal of Drolet & Associates Energy Services Inc. He has had a 43-year career in many phases of energy—nuclear fission and fusion, coal, natural gas, geothermal and distributed generation, with the attendant necessary expertise in commercial aspects, research and development, engineering, operations and consulting. He earned a bachelor’s degree in chemical engineering from Royal Military College of Canada, a Master of Science in nuclear technology/chemical engineering and a DIC from Imperial College, University of London, England. He spent 26 years with North America’s largest nuclear utility, Ontario Hydro, in various nuclear engineering, research and operations functions.
Want to read more Mining Report interviews like this? Sign up for our free e-newsletter, and you’ll learn when new articles have been published. To see a list of recent interviews with industry analysts and commentators, visit The Mining Report.
Related Articles
DISCLOSURE:
1) Tom Armistead conducted this interview for The Mining Report and provides services to The Mining Report as an independent contractor. He or his family owns shares of the following companies mentioned in this interview: None.
2) The following companies mentioned in the interview are sponsors of The Mining Report: Coalspur Mines Ltd., Skyharbour Resources Ltd. and Zimtu Capital Corp. Streetwise Reports does not accept stock in exchange for its services or as sponsorship payment.
3) Thomas Drolet: I or my family own shares of the following companies mentioned in this interview: None. I personally am or my family is paid by the following companies mentioned in this interview: None. My company has a financial relationship with the following companies mentioned in this interview: None. I was not paid by Streetwise Reports for participating in this interview. Comments and opinions expressed are my own comments and opinions. I had the opportunity to review the interview for accuracy as of the date of the interview and am responsible for the content of the interview.
4) Interviews are edited for clarity. Streetwise Reports does not make editorial comments or change experts’ statements without their consent.
5) The interview does not constitute investment advice. Each reader is encouraged to consult with his or her individual financial professional and any action a reader takes as a result of information presented here is his or her own responsibility. By opening this page, each reader accepts and agrees to Streetwise Reports’ terms of use and full legal disclaimer.
6) From time to time, Streetwise Reports LLC and its directors, officers, employees or members of their families, as well as persons interviewed for articles and interviews on the site, may have a long or short position in securities mentioned and may make purchases and/or sales of those securities in the open market or otherwise.


 I recently returned from India, a nation where an incredible 600 million people are under the age of 25. That’s nearly double the entire population of the U.S.!
 This is despite Americans being bombarded with negative messages of the health care reform. TIME printed a busted “Obamacare” pill accompanied by the headline, “Broken Promise: What It Means for This Presidency.” The Economist features an image of President Barack Obama sinking in water with the headline, “The man who used to walk on water.” This November, Obama’s approval rating sank to a new all-time low.


