
Bonds & Interest Rates

Imagine that you retired in July 2012. Upon retirement, it was decided to place your hard-earned savings into a bond portfolio for safety and income. Let’s say that the portfolio is comprised of U.S. Treasury bonds and with an average maturity of about 8 ½ years.
So, how would you have done?
Despite receiving interest payments which would have yielded on average of about 1.8% of your initial investment, you would be down a total of 5.58% (see chart above).
That’s right, even when you add back the interest payments, you would be down a total of 5.58% over the first 18 months of your retirement!
If the volatility in the bond markets ended today and bond prices did not change, it would take three years’ worth of interest payments just to get back to breakeven. Four and a half years into retirement, and despite receiving interest over that time frame, your total return would be zero.
The opinions expressed in this report are the opinions of the author and readers should not assume they reflect the opinions or recommendations of Richardson GMP Limited or its affiliates. Assumptions, opinions and estimates constitute the author’s judgment as of the date of this material and are subject to change without notice. We do not warrant the completeness or accuracy of this material, and it should not be relied upon as such. Before acting on any recommendation, you should consider whether it is suitable for your particular circumstances and, if necessary, seek professional advice. Past performance is not indicative of future results.
Richardson GMP Limited, Member Canadian Investor Protection Fund.
Richardson is a trade-mark of James Richardson & Sons, Limited. GMP is a registered trade-mark of GMP Securities L.P. Both used under license by Richardson GMP Limited.

For anyone who still thinks that something other than the U.S. Federal Reserve’s experiment with Quantitative Easing is helping to lift U.S. stocks, the chart above should quickly dispel that.
Since the introduction of QE1 back in later 2008, the growth of the Fed’s balance sheet as a result of QE almost perfectly overlays a chart of the S&P 500.
And, we know that earnings are not driving stocks. U.S. non-financial company earnings have been almost flat for the last two years now. (The largest financial companies have received massive government subsidies, which explains most of their earnings)
Now that U.S. stocks are breaking their recent trend, it will be interesting to see the extent of this correction. If there is enough of a selloff, the graph above will start to exhibit a deviation between the amount of QE and stock prices. That might be an indictment of the lack of effectiveness of QE in putting the U.S. economy back on a long-term growth trajectory and in fixing U.S. unemployment. If the market does lose faith in QE, what will be the Fed’s Plan B?
The opinions expressed in this report are the opinions of the author and readers should not assume they reflect the opinions or recommendations of Richardson GMP Limited or its affiliates. Assumptions, opinions and estimates constitute the author’s judgment as of the date of this material and are subject to change without notice. We do not warrant the completeness or accuracy of this material, and it should not be relied upon as such. Before acting on any recommendation, you should consider whether it is suitable for your particular circumstances and, if necessary, seek professional advice. Past performance is not indicative of future results.
Richardson GMP Limited, Member Canadian Investor Protection Fund.
Richardson is a trade-mark of James Richardson & Sons, Limited. GMP is a registered trade-mark of GMP Securities L.P. Both used under license by Richardson GMP Limited.
After a 12-year run, it looks like gold’s wave has truly crested, and many bears are arguing that it’s all downhill from here. A quick glance at a long-term gold price chart can certainly seem to confirm this impression.
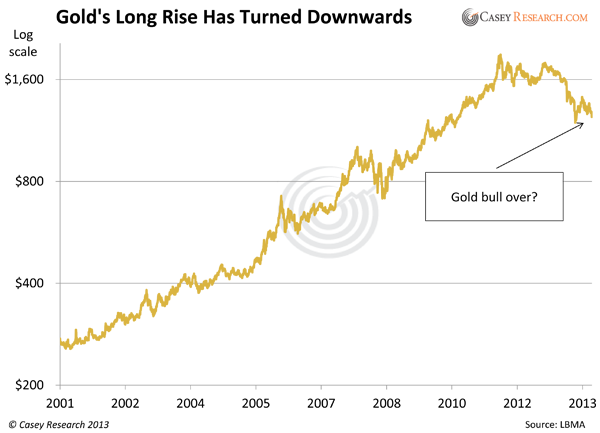
Gold’s price has fallen by more than a third since its 2011 high. The downturn exceeds the 2008 waterfall selloff. Many technical analysts are saying that the “damage” on the charts is too great for gold to recover. The rout is so bad, even hardened goldbugs have grown quiet lately.
Is it time for gold investors to admit defeat?
Well, if it were true that “damage” on a chart such as we’ve seen signals the end of a bull market, perhaps it might be. But is it so? Or is this just a correction?
One of the greatest bull markets in modern times was the Nasdaq in the 1990s. The Nasdaq composite rose a whopping 1,150% over the span of a decade. But did you know it had a major correction in the middle of that run? The same is true of oil’s big surge in the mid-2000s. Consider this chart of the big corrections oil and the Nasdaq experienced:

After seeing prices crash in both the Nasdaq and oil, most investors assumed those bull markets were over—but they weren’t. Here’s the subsequent rise in each after prices bottomed:

The Nasdaq and oil did recover from their large corrections—despite all the technical “damage” many pointed to as proof that those bull markets were over. Investors who sold their positions during the downdrafts missed out on some fantastic profits.
Given that all the reasons gold rose from 2001 to 2011 are still in force, I am convinced gold’s current correction is the setup for a second big surge—and, ultimately, a true gold mania of historic proportions.
Just because gold doesn’t seem to be reacting to Fed money-printing at the moment doesn’t mean it won’t. Sooner or later, reality trumps fantasy. Reason says that you can’t quintuple your balance sheet in five years and expect no repercussions. The Fed keeps hinting it will taper its money printing, but it still has not. We’ve had QE1, QE2, Operation Twist, and now QE3… none of them has worked, and the new Fed chair wants to print even more money.
It’s pure fantasy to believe there will be no consequences to these actions—and the reality is that whatever else happens, gold will react positively.
Should gold investors admit defeat? I say it’s reckless central bankers who should declare defeat.
A gold recovery is inevitable. Prepare accordingly. Try BIG GOLD risk-free for 3 months to access our GLD put strategy, frequent bullion discounts, and the producers that will respond the strongest once the recovery takes hold. 100% satisfaction, or your money back—click here to get started.
 As a distant but interested observer of history and investment markets I am fascinated how major events that arose from longer-term trends are often explained by short-term causes. The First World War is explained as a consequence of the assassination of Archduke Franz Ferdinand, heir to the Austrian-Hungarian throne; the Depression in the 1930s as a result of the tight monetary policies of the Fed; the Second World War as having been caused by Hitler; and the Vietnam War as a result of the communist threat.
Similarly, the disinflation that followed after 1980 is attributed to Paul Volcker’s tight monetary policies. The 1987 stock market crash is blamed on portfolio insurance. And the Asian Crisis and the stock market crash of 1997 are attributed to foreigners attacking the Thai Baht (Thailand’s currency). A closer analysis of all these events, however, shows that their causes were far more complex and that there was always some “inevitability” at play.
Simply put, a financial crisis doesn’t happen accidentally, but follows after a prolonged period of excesses…
Take the 1987 stock market crash. By the summer of 1987, the stock market had become extremely overbought and a correction was due regardless of how bright the future looked. Between the August 1987 high and the October 1987 low, the Dow Jones declined by 41%. As we all know, the Dow rose for another 20 years, to reach a high of 14,198 in October of 2007.
These swings remind us that we can have huge corrections within longer term trends. The Asian Crisis of 1997-98 is also interesting because it occurred long after Asian macroeconomic fundamentals had begun to deteriorate. Not surprisingly, the eternally optimistic Asian analysts, fund managers , and strategists remained positive about the Asian markets right up until disaster struck in 1997.
But even to the most casual observer it should have been obvious that something wasn’t quite right. The Nikkei Index and the Taiwan stock market had peaked out in 1990 and thereafter trended down or sidewards, while most other stock markets in Asia topped out in 1994. In fact, the Thailand SET Index was already down by 60% from its 1994 high when the Asian financial crisis sent the Thai Baht tumbling by 50% within a few months. That waked the perpetually over-confident bullish analyst and media crowd from their slumber of complacency.
I agree with the late Charles Kindleberger, who commented that “financial crises are associated with the peaks of business cycles”, and that financial crisis “is the culmination of a period of expansion and leads to downturn”. However, I also side with J.R. Hicks, who maintained that “really catastrophic depression” is likely to occur “when there is profound monetary instability — when the rot in the monetary system goes very deep”.
Simply put, a financial crisis doesn’t happen accidentally, but follows after a prolonged period of excesses (expansionary monetary policies and/or fiscal policies leading to excessive credit growth and excessive speculation). The problem lies in timing the onset of the crisis. Usually, as was the case in Asia in the 1990s, macroeconomic conditions deteriorate long before the onset of the crisis. However, expansionary monetary policies and excessive debt growth can extend the life of the business expansion for a very long time.
In the case of Asia, macroeconomic conditions began to deteriorate in 1988 when Asian countries’ trade and current account surpluses turned down. They then went negative in 1990. The economic expansion, however, continued — financed largely by excessive foreign borrowings. As a result, by the late 1990s, dead ahead of the 1997-98 crisis, the Asian bears were being totally discredited by the bullish crowd and their views were largely ignored.
While Asians were not quite so gullible as to believe that “the overall level of debt makes no difference … one person’s liability is another person’s asset” (as Paul Krugman has said), they advanced numerous other arguments in favour of Asia’s continuous economic expansion and to explain why Asia would never experience the kind of “tequila crisis” Mexico had encountered at the end of 1994, when the Mexican Peso collapsed by more than 50% within a few months.
In 1994, the Fed increased the Fed Fund Rate from 3% to nearly 6%. This led to a rout in the bond market. Ten-Year Treasury Note yields rose from less than 5.5% at the end of 1993 to over 8% in November 1994. In turn, the emerging market bond and stock markets collapsed. In 1994, it became obvious that the emerging economies were cooling down and that the world was headed towards a major economic slowdown, or even a recession.
But when President Clinton decided to bail out Mexico, over Congress’s opposition but with the support of Republican leaders Newt Gingrich and Bob Dole, and tapped an obscure Treasury fund to lend Mexico more than$20 billion, the markets stabilized. Loans made by the US Treasury, the International Monetary Fund and the Bank for International Settlements totalled almost $50 billion.
However, the bailout attracted criticism. Former co-chairman of Goldman Sachs, US Treasury Secretary Robert Rubin used funds to bail out Mexican bonds of which Goldman Sachs was an underwriter and in which it owned positions valued at about $5 billion.
At this point I am not interested in discussing the merits or failures of the Mexican bailout of 1994. (Regular readers will know my critical stance on any form of bailout.) However, the consequences of the bailout were that bonds and equities soared. In particular, after 1994, emerging market bonds and loans performed superbly — that is, until the Asian Crisis in 1997. Clearly, the cost to the global economy was in the form of moral hazard because investors were emboldened by the bailout and piled into emerging market credits of even lower quality.
…because of the bailout of Mexico, Asia’s expansion was prolonged through the availability of foreign credits.
Above, I mentioned that, by 1994, it had become obvious that the emerging economies were cooling down and that the world was headed towards a meaningful economic slowdown or even a recession. But the bailout of Mexico prolonged the economic expansion in emerging economies by making available foreign capital with which to finance their trade and current account deficits. At the same time, it led to a far more serious crisis in Asia in 1997 and in Russia and the U.S. (LTCM) in 1998.
So, the lesson I learned from the Asian Crisis was that it was devastating because, given the natural business cycle, Asia should already have turned down in 1994. But because of the bailout of Mexico, Asia’s expansion was prolonged through the availability of foreign credits.
This debt financing in foreign currencies created a colossal mismatch of assets and liabilities. Assets that served as collateral for loans were in local currencies, whereas liabilities were denominated in foreign currencies. This mismatch exacerbated the Asian Crisis when the currencies began to weaken, because it induced local businesses to convert local currencies into dollars as fast as they could for the purpose of hedging their foreign exchange risks.
In turn, the weakening of the Asian currencies reduced the value of the collateral, because local assets fall in value not only in local currency terms but even more so in US dollar terms. This led locals and foreigners to liquidate their foreign loans, bonds and local equities. So, whereas the Indonesian stock market declined by “only” 65% between its 1997 high and 1998 low, it fell by 92% in US dollar terms because of the collapse of their currency, the Rupiah.
As an aside, the US enjoys a huge advantage by having the ability to borrow in US dollars against US dollar assets, which doesn’t lead to a mismatch of assets and liabilities. So, maybe Krugman’s economic painkillers, which provided only temporary relief of the symptoms of economic illness, worked for a while in the case of Mexico, but they created a huge problem for Asia in 1997.
Similarly, the housing bubble that Krugman advocated in 2001 relieved temporarily some of the symptoms of the economic malaise but then led to the vicious 2008 crisis. Therefore, it would appear that, more often than not, bailouts create larger problems down the road, and that the authorities should use them only very rarely and with great caution.
Regards,
By Marc Faber via http://dailyreckoning.com/that-financial-crisis-was-no-accident
Marc Faber is an international investor known for his uncanny predictions of the stock market and futures markets around the world.

West Texas Intermediate crude was little changed as faster-than-expected growth in the U.S. economy spurred speculation that the Federal Reserve will curb stimulus spending.
WTI for January delivery rose 2 cents to $97.22 a barrel at 9:18 a.m. on the New York Mercantile Exchange. The contract ranged between $97.01 and $97.72, the highest intraday level since Oct. 30. The volume of all futures traded was 21 percent below the 100-day average. Prices are up 5.9 percent this year.
Brent crude for January settlement fell 48 cents, or 0.4 percent, to $111.40 a barrel on the London-based ICE Futures Europe exchange. The North Sea grade was at a premium of $14.18 to WTI, after earlier dropping to $13.87, the narrowest intraday level since Nov. 21.
To contact the reporter on this story: Moming Zhou in New York at mzhou29@bloomberg.net
To contact the editor responsible for this story: Dan Stets at dstets@bloomberg.net


-
I know Mike is a very solid investor and respect his opinions very much. So if he says pay attention to this or that - I will.
~ Dale G.
-
I've started managing my own investments so view Michael's site as a one-stop shop from which to get information and perspectives.
~ Dave E.
-
Michael offers easy reading, honest, common sense information that anyone can use in a practical manner.
~ der_al.
-
A sane voice in a scrambled investment world.
~ Ed R.
Inside Edge Pro Contributors

Greg Weldon

Josef Schachter

Tyler Bollhorn

Ryan Irvine

Paul Beattie

Martin Straith

Patrick Ceresna

Mark Leibovit

James Thorne

Victor Adair