
Energy & Commodities
 At the end of 2012, the investment community laughed at my prediction that 2013 will produce phenomenal gains in the uranium miners (URA). Read my interview with The Energy Report at the end of 2012 which may have signaled the bottom in the uranium miners.
In 2013, our uranium bellwethers Areva (ARVCF) and Cameco (CCJ) have significantly outperformed the S&P 500 (SPY) by a significant margin. The uranium price has been making a very bullish turnaround since early November. Cameco is on the verge of a breakout at $22 and we may soon witness a golden crossover of the 50 and 200 day moving average. Now those who ridiculed me claiming uranium was dead are now coming to the realization that the uranium sector which was reviled by investors a year ago is now coming back in favor. Areva and Cameco are significant outperformers in 2013 as well as the small nuclear modular reactor manufacturers such as Babcock and Wilcox (BWC) and Fluor (FLR) which I have highlighted over this past year.
For years I have predicted that the recent low price in uranium which hit 8 year lows in 2013 may actually be the catalyst to look for higher grade and more economic uranium deposits particularly in the Athabasca Basin in mining friendly Saskatchewan and in low cost in situ uranium operators in the United States as the Russian Megatons to Megawatts expired in 2013. This low uranium spot price may actually be causing a uranium rush for these lower cost production capabilities. Higher cost uranium mines are being shut down or delayed all over the world. However new uranium discoveries are receiving a lot of attention especially in the Athabasca Basin which is the highest grade uranium mining district in the world. Some of the older mines such as Rio Tinto’s low grade Rossing and Ranger Mine have been facing technical challenges.
This low price in uranium is possibly the reason why Cameco (CCJ), Rio Tinto (RIO) and Denison (DNN) have been buying junior uranium explorers in the Athabasca Basin trading at bargains due to the weak resource sector. These assets are high grade meaning potentially lower production costs in a stable jurisdiction. Smart money knows nuclear power is here to stay as there are more reactors operating and under construction now post-Fukushima than from before the once in a millennium natural disaster.
…read page 2 HERE


The derailment and fire that led to the evacuation of a North Dakota town has renewed the debate over whether it’s safer to ship oil by rail or pipeline as the U.S. completes a review of the Keystone XL project.
“Any time there is an incident, you have heightened talk and scrutiny on oil transportation,” Brigham McCown, a former director of the Pipeline and Hazardous Materials Safety Administration, said yesterday in an interview. “It will add to the conversation.”
Public safety officials urged more than 2,000 North Dakota residents to flee fumes from the fire that engulfed BNSF Railway Co. cars carrying oil after a collision Dec. 30 with another train about 25 miles (40 kilometers) west of Fargo. BNSF is owned by Berkshire Hathaway Inc. (BRK/A) of Omaha. The evacuation was lifted yesterday at 3 p.m. local time after health officials declared the air safe.
While climate change has been the focus of the fight overTransCanada Corp.’s (TRP) proposed Keystone XL pipeline fromCanada to the U.S. Gulf Coast, a subset in the debate has been the relative safety of pipes versus trains. The U.S. State Department, reviewing the $5.4 billion project because it would cross the U.S. border, is weighing whether the pipeline would be in the national interest.
Keystone would allow about 100,000 barrels a day of crude from the Bakken formation in Montana and North Dakota onto the pipeline through a link in Baker, Montana.

Here they are: the most important charts of the year.
We asked our favorite portfolio managers, strategists, analysts, and economists across the Street for the charts that they deem the most important right now, and this is what they sent us.
Much of the focus is on the 10-year Treasury yield — where does it go, and what is the read-across for other financial markets around the globe? Many are focused on the stock market as well, the consensus being that indices will rise to new highs again in 2014.
But there are a lot of other things going on as well.
Click on HERE or on the image below for a larger image & a pathway to the other 27 charts:


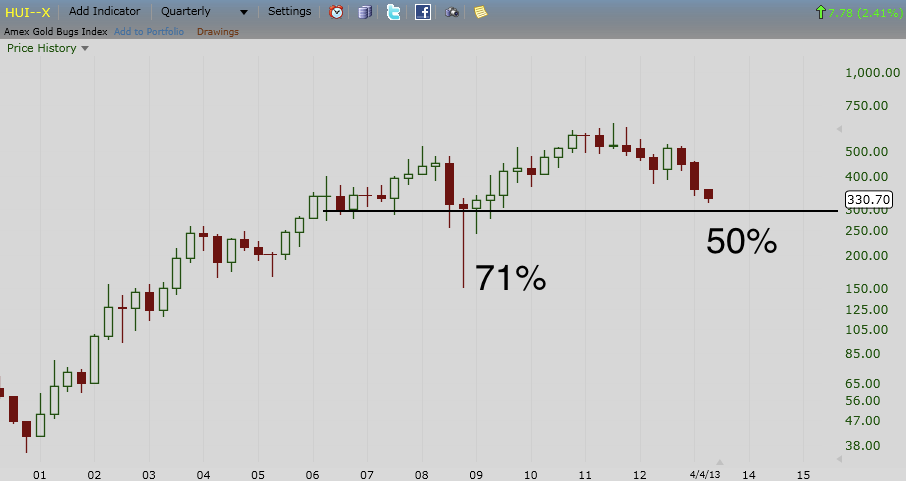
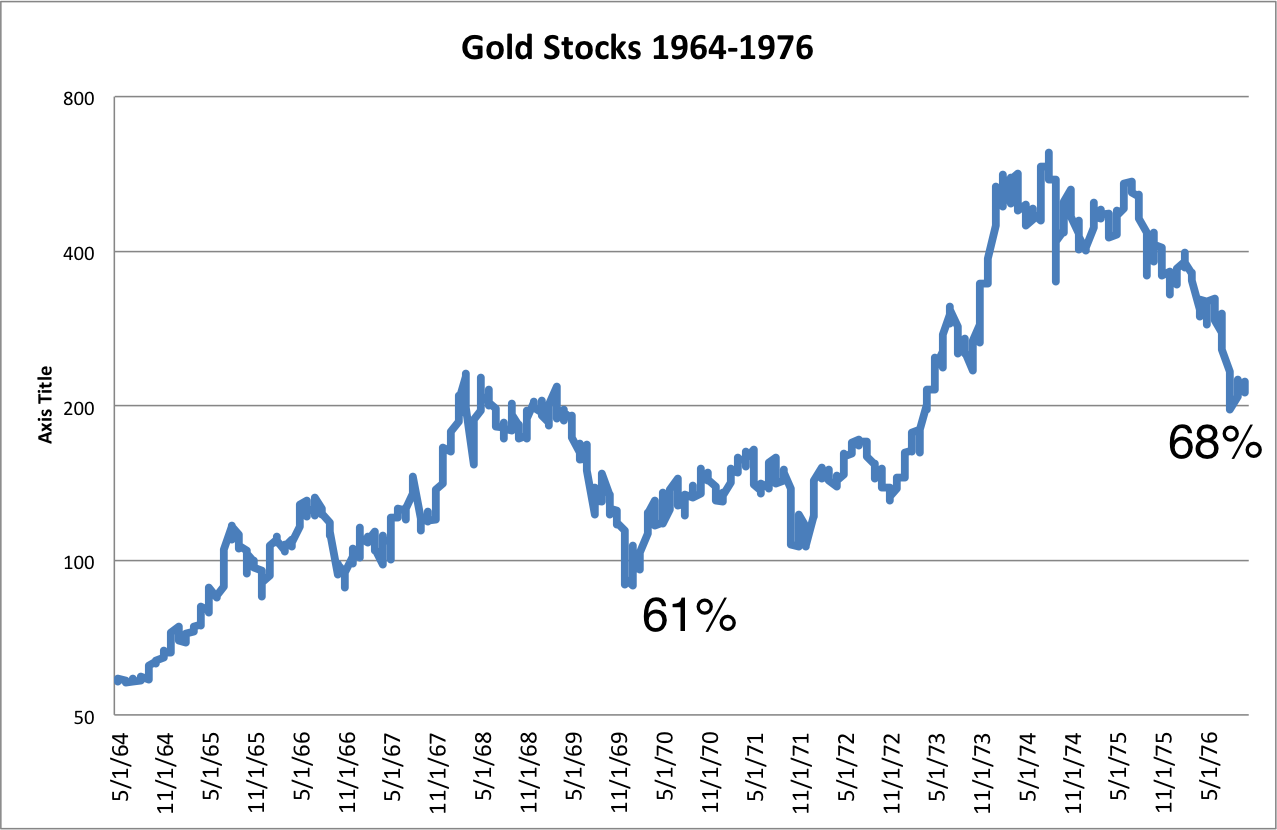
In investing, it’s often said that nothing goes up or down in a straight line.
Stocks, bonds, commodities… they all go through periods of growth, correction, collapse, mania, etc.
We’re seeing this right now with respect to a substantial decline in the nominal gold price after more than 12 straight years of gains.
But I’ve just recently come across an investment trend that has posted the same results for more than 20-years straight. And it’s actually quite alarming.
Every human being on the planet requires sustenance… typically measured in Calories per day.
What’s interesting is that the global average of per-capita Calorie consumption has increased a whopping 24.6% since 1964.
So over the last fifty years, the data clearly show that human beings are eating more… now to an average of roughly 2,940 Calories per person per day.
As you can probably guess, most of the rise has taken place in East Asia just over the last two decades, owing to the increased wealth in that part of the world.
Roughly a billion people have been lifted out of poverty in Asia alone. And as people begin to generate income and accumulate savings, their dietary habits have invariably changed. They eat more, i.e. demand more Calories.
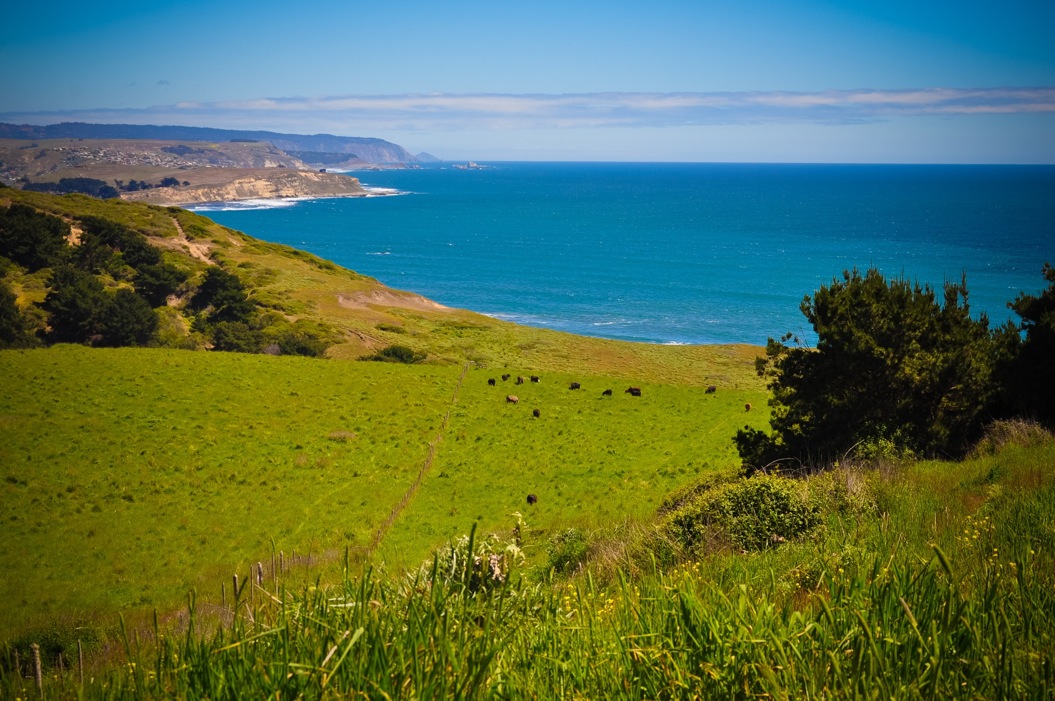
As we eat more, we require more resources from the world. And in the case of food, this means more arable land to grow crops.
But there’s another twist to this trend. As people become wealthier, they not only eat more, but they also begin to consume more resource consumptive foods– especially meat.
It takes a lot more land to grow a kilogram of beef than it does to grow a kilogram of tomatoes. The difference can often be an order of magnitude greater.
So when you look at the demand side of this equation, per capita food consumption is increasing… and we are also consuming a vastly greater amount of land-intensive foods.
In short, the global trend is that we are demanding a much greater amount of arable land per person.
Yet the data on the supply side show the precise opposite.
According to World Bank data, the global average of arable land per person has been on a one-way decline since 1992.
In fact, since 1964, there has only been one year that the global average of arable land per person has increased. In every other instance over the last five decades, arable land per person has declined.
This is an astounding trend.
Our modern ‘science’ is stepping in to address this trend. It’s why much of what we eat is now concocted in a laboratory rather than grown on a farm. It’s why McDonalds puts pink slime in its hamburgers instead of… you know… beef.
But even still, science only goes so far.
Yields for many staple crops (like wheat) essentially hit a wall about ten years ago. After decades of miraculous gains in the amount of tons, bushels, and kilograms per acre we have been able to extract from the Earth, productive capacity has largely plateaued.
In other words, we have maxed out what we can pull out of the soil for now. And the amount of soil per person that’s in production is in serious decline.
To me, this spells out an obvious case for investing in agriculture… and even more specifically, to own farmland.
About Simon Black
Simon Black is an international investor, entrepreneur, permanent traveler, free man, and founder of Sovereign Man. His free daily e-letter and crash course is about using the experiences from his life and travels to help you achieve more freedom.
Todd Market Forecast for Tuesday December 31, 2013
Available Mon- Friday after 6:00 P.M. Eastern, 3:00 Pacific.
DOW + 72 on 750 net advances
NASDAQ COMP +22 on 450 net declines
SHORT TERM TREND Bullish
INTERMEDIATE TERM TREND Bullish
STOCKS: Not much to say still again. Very light volume with portfolio adjustments and seasonality the dominant considerations.
We’re looking for more strength into the close on Friday.
GOLD: Gold was up $1. It was down as much as $22 before staging a solid comeback.
CHART: It’s well known that hedge funds, as a group, managed to vastly underperform the market in 2013. As a matter of fact, these “pros” have underperformed for years. To be fair, they were down much less in 2008 than the market averages. But, they charge 2% and also take as much as 20% of the profits.

TORONTO EXCHANGE: Toronto was up 40.
S&P\TSX Venture Comp: The Venture Comp was up 11.
BONDS: Bonds moved down again.
THE REST: The dollar rebounded mildly. Silver and crude oil were lower. Copper managed an up session.
BOTTOM LINE:
Our intermediate term systems are on a buy signal.

-
I know Mike is a very solid investor and respect his opinions very much. So if he says pay attention to this or that - I will.
~ Dale G.
-
I've started managing my own investments so view Michael's site as a one-stop shop from which to get information and perspectives.
~ Dave E.
-
Michael offers easy reading, honest, common sense information that anyone can use in a practical manner.
~ der_al.
-
A sane voice in a scrambled investment world.
~ Ed R.
Inside Edge Pro Contributors

Greg Weldon

Josef Schachter

Tyler Bollhorn

Ryan Irvine

Paul Beattie

Martin Straith

Patrick Ceresna

Mark Leibovit

James Thorne

Victor Adair