
Stocks & Equities

The rout in the US share market has many talking heads patting themselves on the back. But this is by no means a major high. The Cash SP500 had finally broken out above the Breakout Channel. It is typical to come back and retest it before advancing. The cash closed at 179029 and the channel top resides at 179012. We have NOT elected any Weekly Bearish Reversals as of yet and our first one lies at 176040. A weekly closing beneath that level should cause a move into the mid-point of the channel in the 16800 zone. We still see the weeks of Feb 10th and 24th as the nearby targets for turning points.
As we have warned, a near-term correction was due with the first opportunity for a low in February. January did just barely exceed the December high intraday, but not on a closing basis on the Dow and SP500, This raises some concern technically. Exceeding the December high even by a fraction intraday warns we do have a serious outside-reversal to the downside potential if the SP500 closes below 176799 at month end 15665.08 on the Dow. This would warn that a sharp drop is likely into February where we could see a retest of the 1680.00 level on the Cash SP500 15365.00 on the Dow.

The same construction of the Breakout Channel on the Dow Jones Industrials gives a different perspective. Here the market has still not broken out. It remains contained within the channel and this illustrates the difference between the HOT MONEY and the BIG MONEY. The Dow is still the leader to watch. Here, the turning point is the next week so caution is required. Again, no Weekly Bearish Reversals have been elected, but a weekly closing BELOW the December low will warn of a technical sell-off ahead.
Read more from Martin: The Emerging Market Crisis

 We are at the doorstep of a major USTreasury Bond breakdown. The TNX (10-year bond yield) is at the 3.0% doorstep, as 3.5% looms very likely in the coming months. A horrible threat of a 3.7% target is presented in the chart. A rising trend is seen in many characteristics that cannot be easily dimissed. The following graphic is an extremely powerful chart, thus the center piece of the article. If and when the breakout comes, it will make the Taper Talk backfire seem rather insignificant, as a gathering storm will hit like a financial hurricane on every continent. The Jackass is on record with a forecast of 3.5%, which remains in place. One must be patient to watch it unfold, since it can take months to unfold and to manifest itself. That is far more time than the nitwits who are quick to label it a wrong forecast call. But then again they are are loud unimpressive dullards who litter the audience, taking up valuable space.

Whether or not last week’s sell-off was a correction or the correction, investors need to keep an eye on technical levels, says Michael O’Rourke, chief strategist at JonesTrading.
“In Friday’s trading, the S&P 500 SPX -0.34% cash broke below both the 50-day moving average and the 1,800 support level. The next notable technical support is 1,775-1,780. With the exception of very minor support at 1,745, there is little support down to the 1,700 level,” he says in The Closing Print.
More than one strategist has said in the past 24 hours that the 1,775 level on the S&P 500 needs to hold or it will open up a whole new phase of selling for markets. – read why in the entire article HERE
Short term weakness early this week is expected to provide a buying opportunity in sectors that show positive seasonality at this time of year (e.g. energy, materials, oil services, platinum, silver). Wait for technical signs of bottoming before adding/ introducing a position.

Jon Vialoux’s EquityClock.com can be accessed HERE for Sector Seasonality Reports
Crude Oil gained $2.27 per barrel (2.41%) last week. Trend remains down. Crude moved above its 20 and 50 day moving averages. Strength relative to the S&P 500 Index changed from negative to positive. Technical score improved to 2.0 from 0.0 out of 3.0. Short term momentum indicators are trending up.

….Don’s Timing The Market Monday Morning Report Reviews & comments on the entire Energy Sector & all other Commodities, Currencies, Equity Trends, Intersest Rates, Economic News this Week, Earnings News…….just a thorough review of over 45 Charts that is well worth scanning HERE

According to many analysts and investors, mining shares have bottomed.
As much as I would like to agree, my view is that mining shares have not bottomed. Instead, the recent rally in mining shares is nothing but a dead-cat bounce that will soon give way to new lows.
There are three solid reasons why I say that.
First, the charts of the mining ETFs: Market Vectors Gold Miners ETF (GDX) and Market Vectors Junior Gold Miners ETF (GDXJ).
For GDX, notice two important clues here.
The recent bottoming action had no substantial spike lower. Important bottoms almost always involve a washout spike lower, and there is none here.
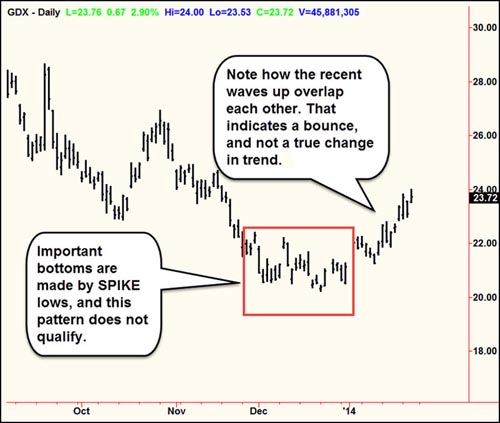
Next, notice the recent rally. It’s largely one of two short thrusts higher, but they overlap each other.
That’s not conducive of a major rally. Instead, it’s indicative of a bounce and nothing more.
You can see the same patterns here in the chart of the GDXJ.

Bottom line: Neither of these charts indicates a major low is at hand.
Second, my cycle models for the mining shares. They show that the rally can extend a bit further, but then they are flashing sell signals for Feb. 1, just a few days from now. And by the way, my signal models for GDX and GDXJ show 87.5 percent winning trades for the past five years.
 Third, the price of gold. For most producing miners, the current price of gold is below the cost of production. For most miners to become profitable, gold would have to rally to at least $1,400 and stay there.
That’s not likely to happen, given the recent rally in the metals also appears to be nothing more than a dead-cat bounce and new lows lie on the horizon.
Fourth, the broad stock markets. They are all extremely overbought and extremely vulnerable to a shakeout. You might counter and say that if stocks take a nosedive, contrarian investments like mining shares should explode higher.
In normal times, that may be true. But these aren’t normal times. The back wall of the financial hurricane looms right around the corner. When it hits, mining shares will likely perform the same way they did back in 2008 and 2009, losing as much as half their value in very short order.
Lastly, my signal models have not yet generated any major buy signals. Not on the daily models, or the weekly, or the monthly levels of activity. Until we get at least one weekly buy signal on my models, I’m going to stay on the sidelines because, simply put, the odds favor another leg down to new lows.
So what about gold and silver? Are their recent rallies the start of something bigger? Did I miss the bottom?
My answer: No, the recent rallies do not appear to be the start of something bigger. I do not believe the bottom is in for gold or silver.
Like the mining shares, the recent rally in gold looks more like a bounce than anything else. And while the bounce may continue a tad higher, to as high as $1,289 in gold …
My work shows that the near perfect double bottom in gold at the June 2013 low of $1,178 and the Dec. 31 low of $1,181.40 (both lows basis the continuous nearby futures contract) … will not hold.
Instead, it will give way to another sharp decline, with gold still on target to move below at least $1,100.
The big question, of course, is when. My timing models still show that if gold doesn’t collapse by the end of this month, the next target is May. Yes, that stinks, as it will drag out the bear market, something none of us want to see.
But it is what it is, and I can only convey what the gold market is telling me. It is still not time to buy, gold has not bottomed, and it is far better to wait for the right timing and right price before staking out either conservative or aggressive positions.
As to silver, its action is absolutely pathetic. Its recent rally couldn’t even get it above the first level of major resistance at the $20.50 level. In fact, its recent rally was so weak that the spread between gold and silver has now widened out to nearly 63 to 1.
Pay heed to that, because the last time the gold-to-silver ratio started widening out like that was just before the 2008/2009 financial crisis.
With the back wall of that crisis still out there, the current widening in the ratio could be a leading indicator that the back wall will soon be upon us.
But don’t count on the metals rallying when it hits. In the 2008/2009 front wall of the storm, gold and silver plunged as much as 33 percent.
No, I don’t expect them to fall that much this time around. But my point still stands: I do not believe gold and silver have bottomed yet.
Best wishes,
Larry
About Larry Edelson

-
I know Mike is a very solid investor and respect his opinions very much. So if he says pay attention to this or that - I will.
~ Dale G.
-
I've started managing my own investments so view Michael's site as a one-stop shop from which to get information and perspectives.
~ Dave E.
-
Michael offers easy reading, honest, common sense information that anyone can use in a practical manner.
~ der_al.
-
A sane voice in a scrambled investment world.
~ Ed R.
Inside Edge Pro Contributors

Greg Weldon

Josef Schachter

Tyler Bollhorn

Ryan Irvine

Paul Beattie

Martin Straith

Patrick Ceresna

Mark Leibovit

James Thorne

Victor Adair