
Stocks & Equities
Opportunities, Dangers & Risks that produce these Opportunities & Timing – Michael interviews Don Vialoux on Money Talks March 1st. Below is Don’s Friday comment which is extensive, focusing on the Breakouts & Breakdowns Yesterday plus a Weekly Select Sector Review highlighting 40 charts.
{mp3}mtmar114hourxyz{/mp3}
Index futures were virtually unchanged following release of revised U.S. annualized fourth quarter real GDP growth. Consensus was a decline to 2.5% from a previous estimate of 3.2%. Actual was a decline to 2.4%.
The Canadian Dollar was virtually unchanged following release of Canada’s fourth quarter GDP growth rate. Consensus was a gain of 2.5% from the third quarter. Actual was a gain of 2.9%. On the other hand, consensus for month-over-month GDP was a decline of 0.3%. Actual was a decline of 0.5%.
Gap Stores (GPS $43.16) is expected to open higher after Atlantic Equities upgraded the stock from Underweight to Neutral.
Catamaran (CCT Cdn$51.25) is expected to open lower after ISI Group downgraded the stock from Buy to Neutral.
Pan American Silver fell $0.14 to$14.05 after Deutsche Bank downgraded the stock from Buy to Hold. Target is $15.
Silver Standard (SSO Cdn$11.65) is expected to open lower after Deutsche Bank downgraded the stock from Hold to Sell. Target is $9.
EquityClock.com’s Daily Market Comment
Following is a link:
http://www.equityclock.com/2014/02/27/stock-market-outlook-for-february-28-2014/
Interesting Charts
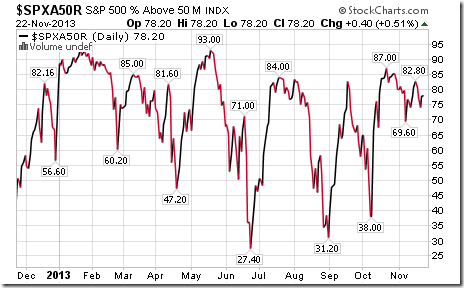
Finally, the S&P 500 Index managed to close at an all-time high.

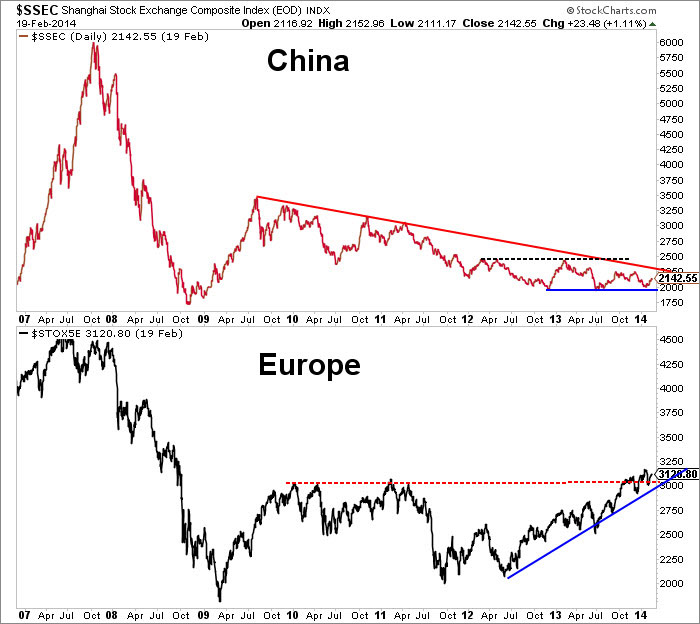
Chinese equities continue to recover. Equity markets are starting to anticipate an important announcement on economic reform on March 5th.
Breakouts and Breakdowns Yesterday &
Weekly Select Sector Review
Quiet day yesterday ! Two S&P 500 stocks broke resistance: EMC Corp. and FMC Corp. FMC reached an all-time high.
One TSX 60 stock broke resistance: Commerce Bank to an all-time high and one TSX stock broke support: Catamaran.
…..read more HERE

Signs Of The Times
“The End of Snow?”
– The New York Times Sunday Review, February 7
“Over Two Thirds of Contiguous USA Covered With Snow”
– WUWT, February 7
“1 in 4 Americans Unaware That Earth Revolves Around The Sun”
– Survey of 2,200 by the National Science Foundation, February 14
(It is uncertain that the survey included the NYT Editorial Board)
“We don’t see a broad-based buildup in leverage.”
“Asset prices generally do not appear to be out of line with traditional metrics.”
– Testimony, Janet Yellen, February 11
“The shadows are growing in the corporate bond market as investors turn to derivatives. An increasingly illiquid cash bond market is behind the shift.”
– Financial Times, February 11
“Investors have been warned by Fitch that losses from the next leveraged default cycle may be significantly in excess of previous cycles.”
– Financial Times, February 14
* * * * *
Perspective
In what seems to be bureaucratic ritual, Yellen’s public statements may vary from her private comments. The Fed head is not going to holler “Fire” in the equivalent of a crowded theatre. Nevertheless, we think the Fed chair is sincere.
Pity.
Perhaps her info on developing strains in the credit markets and asset valuations is a month or so behind the action.
Yesterday’s hit to the bond market was accompanied by the comment that traders had read the latest Fed minutes and realized that “they” did not know what they were talking about.
These pages have been hammering central banking for decades. Quite likely the treasury market was poised for change and the utterance by the Fed became the catalyst. Whatever, it is constructive criticism of an agency whose sole purpose is to provide unlimited funding for another experiment in unlimited government.
In Ukraine the “Cold War” between the governing classes and the ruled is turning to physical rebellion. Hopefully, this does not become a civil war. It need not as all the folks want is self-government. More links with Europe would be a step towards freedom. Ooops, we have referred to the seat of Euro-government as “Moscow on the Maastrich”. Perhaps the natural movement for freedom in Ukraine could spread to the rest of Europe. Maybe even to Democrat-controlled states and cities in America.
The violence in Kiev is spreading to other Ukrainian cities and it reminds of the Prague Spring uprising in 1968 and of the Hungarian uprising in 1956.
Political violence in Europe in the 1920s and into the early 1930s was between national socialists and international socialists. Each was dedicated to authoritarian central planning.
The conflict in Ukraine is vastly different – it is between authoritarians and those who value freedom. The latter were successful in bringing down the Berlin Wall in 1989 and today’s movement should eventually win.
Another reform movement could sweep the political world.
In the financial markets it would include profound criticism of the Federal Reserve System.
Credit Markets
At the first of the month, the bond future reached resistance at the 134 level, which was the high in November. The surge was enough to drive the Daily RSI to 75, which compares to the momentum of 73 reached with the bond high in May.
This surge was to vulnerability and all that was needed was a “news” hit. The catalyst was the Fed minutes, and the reversal was associated with reversals in stocks, lowergrade bonds, copper, gold and silver.
HYG (high-yield) and investment-grade (LQD) accomplished Outside Reversals. Liquidity, indeed, is diminishing. Essentially, this was from new highs on a move that has not had a significant correction since the “mini-panic” in June.
Long treasuries have been correcting and the 50-Day ma (about 130) should provide support.
Credit spreads (JNK:TLT) led recent uncertainties in peaking at the end of December and taking out the 50-Day a week later. Then it plunged to the 200-Day which was enough to prompt the rebound. Now it is attempting to test the 50-Day line from below.
Emerging bond spreads (EMB:TLT) plunged to below the 200-Day and bounced back to that level and has been struggling. At 1.02 now, falling below 1.01 would resume the decline. The “high” or maximum narrowing was reached at the end of December.
Of interest, is that the initial hit looks quite like the reversal in June 2008.
We are keeping in mind that when troubles start in lesser exchanges they eventually hit the financial centre. We are also keeping in mind the unprecedented recklessness by the senior central banks in arbitrary pursuit of perfection.
Commodities
The rotation into commodities has been working well.
For some, such as coffee, the rally has been spectacular. Bottoming in November coffee led the play and has become, well, over-caffeinated.
The price was 1.01 in November and it took two months to rally 19 cents – yesterday’s gain was 19 cents – to 1.73. The Weekly RSI jumped to 81 which is a snick off of that reached at the top of the bull market in April 2011.
Clearly a remarkable short squeeze. Wonder if it includes “fair trade” coffee?
In November we mentioned that one of the coffee ETFs was JO, which seems an appropriate way to play the opportunities. The short squeeze is massive and the spike up will be followed by a spike down. Will it reverse this week, or next? Who knows.
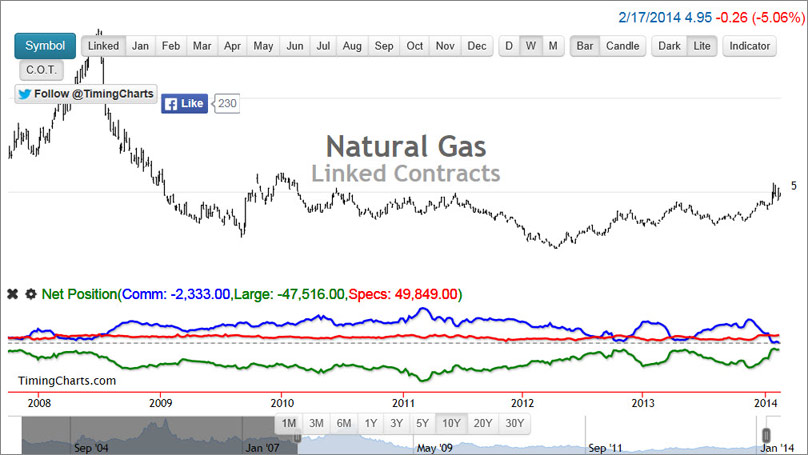
Natural gas suffered a paradigm shift as it crashed from 13.69 in 2008 to 1.90 in 2012. The initial rally made it to 3.50 in early 2013 and the correction was to 3.13 in August. Obviously, natgas is in a huge “weather” rally. However, the Weekly RSI is as high as reached in 2008 and the price is at the resistance level of 6.11.
Crude’s action has been strong enough to drive the Daily RSI to 73, which compares to 75 reached with the brisk rally to the 110 level last summer.
Yesterday’s “Peak Oil” study was essentially written a week ago and being very longterm allowed seasonal room for the top. This week’s action in hot commodities suggests it may be sooner than later.
Base metals (GYX) rallied from 330 to 362 in early January and fell to 331. This is a good test of the low and the advance has made it to 346.
Agricultural prices (GKX) became very oversold at 340 in January and jumped to 375 yesterday. Of interest is that the Daily RSI got to 79, which compares to 83 reached with the spectacular drought rally of 2012.
Sometimes various markets can explode in March-April and we have referred to the phenomenon as the “Silly Season”. This seems to be happening, perhaps somewhat early.
In some examples the “rotation” has been fabulous and the spike up will be followed by a spike down. Then stability.
The rally in base metals was good and the one for agriculturals has been very good. A setback to stability seems likely.
In 2011 our “Momentum Peak Forecaster” called for a surge in speculation to complete and be followed by a cyclical bear. The high was 370.
The key low for the CRB was 272 in November and this was tested in early January at 272. The rally to 301, yesterday, was outstanding. The Daily RSI has clocked a huge swing from 22 to 85, which is quite like the drought rally of 2012.
The CRB could decline to the 275 level and trade in a range for most of the year.
Link to February 21, 2014 Bob Hoye interview on TalkDigitalNetwork.com:
http://talkdigitalnetwork.com/2014/02/gold-and-commodities-advance-strongly/

– Deflated by the CPI, margin debt exceeds levels reached in 2007 and in 2000.
– It took some five years for margin debt to peak in the Tech Bubble of 2000.
– It took some five years for margin debt to peak in the Great Bubble of 2007.
– Although the latest posting is for December, it has been five years since margin debt was at a cyclical low.
– Margin debt is close to a cyclical high.
PIVOTAL EVENTS
BOB HOYE, INSTITUTIONAL ADVISORS
E-MAIL bhoye.institutionaladvisors@telus.net
WEBSITE: www.institutionaladvisors.com

 Martin Armstrong’s computer modelling successfully predicted the fall of the Berlin Wall and the Soviet Union. It predicted the peak in Japan’s Neikei index and the dramatic rise in the price of oil from the lows in 1999. And at the World Outlook Conference in February, 2013 he said that by this year the world would be talking about the Ukraine.
On January 31st of this year he predicted the all out civil war and warned about Russia’s escalation, which he said would take place immediately following the Olympics. He was right.
Listen to one of the implications for investors he also predicted a month ago – click below…
If you would like to see what Martin said about gold, stocks, government bonds, interest rates and the Canadian dollar you can watch the video right now – which also features Mark Leibovit, Ryan Irvine, Josef Schachter and many more of the finest analysts in the English-speaking world. All for only Cdn$118. Just click on EVENTS on the menu above.

In the fall of 2008, I spent a week in Austin, Texas, learning from one of the best traders I know.
His name is Kevin Green. He is one of the original developers of the Schwab CyberTrader platform. He traded on one of the original electronic trading floors in California in the early 1990s.
Kevin’s experience of how today’s electronic markets work is hugely valuable. Today, I want to share with you one of the secrets I learned from Kevin.
It has to do with something called “conviction”…
In the old days, market exchanges were big rooms in which discrete groups of people bought and sold securities in specific markets (company stocks, commodities, bonds, etc.). Each group was in specific area called a “trading pit.”
The system was called “open outcry” because guys were literally yelling “BUY!” and “SELL!” at each other. They backed up their yelling with crazy hand signals for the bid (buy) and ask (sell) prices.
On the typical day you didn’t hear much yelling. But when prices were about to make a big move in a certain market, the trading pits went wild.
The more yelling and hand waving, the more furious the price action. This action eventually led to high conviction in one direction – either up or down.
When there is a lot of money behind it, such conviction can lead to a price trend that’s far more powerful, and longer lasting, than normal.
So, how can having a feel for this be valuable if we’re nowhere close to any trading pits?
Below is a 10-year, weekly price/volume chart of the SPDR S&P 500 ETF Trust (NYSE:SPY)on top of the price/volume chart of the Market Vectors Junior Gold Miners ETF (NYSE:GDXJ) – a basket of junior gold-mining stocks.

The blue line tracks SPY. The orange line tracks GDXJ. (It only goes back to the end of 2009 because that’s when the GDXJ started trading.)
The vertical bars on the bottom of each price chart track trading volume. Higher bars are equivalent to louder “yelling” and more violent “hand waving” in the pits. They show intense trading is taking place.
When there are several of these bars close together, it’s a signal a powerful price move is forming. In other words, a lot of buying and selling is happening that is likely to lead to a big high-conviction price move.
With this in mind, take a look at the red circle in the black vertical bars, which show trading volume for SPY. Notice the huge volume of buying and selling. This intense trading volume coincided with the stock market crash of 2008-09.
This hyperactive buying and selling led to buying with strong conviction. SPY began a powerful run higher. And it’s still running…
Now take a look at the circled area on the green vertical bars, which show trading volume for GDJX. In recent weeks, we’ve seen an unusually big spike in trading volume
GDXJ has responded by marching higher. This shows a lot of money has come in that’s yelling “BUY!” while not a lot of money is wanting to “sell.”
Action like this makes it clear that investors have been buying junior gold miners with conviction. If you look at GDX, which tracks the senior gold mining sector, you’ll see the same sort of action… except it’s been happening for even longer.
If you get into gold mining stocks right now, you’ll find yourself in the company of high-conviction buyers. And, as my friend Kevin Green taught me, this is exactly where you want to be.
Editor’s note: We’ve put together a special for bundle for Diary readers that includes a FREE hardcover copy of Bill Bonner”s Empire of Debt and three timely gold recommendation. It’s a complete package that exposes gold’s history as real money and the fate of the US economy since it began its fiat money experiment. It also sets out specific actions you can take right now to profit from the explosive rally in the gold market. You can find full details of how to claim your FREE book and your special reports here.

Rotations come and they go, typically lasting between six and nine months. Rotation is to stocks what location is to real estate. You have to be aware that diversified investment managers are always looking at their portfolio weightings to increase their position in sectors and industry groups that are outperforming the market and decreasing their weightings in positions that are underperforming. This is how the active manager seeks alpha. Traders will never want to be in underperforming areas and will seek out returns where they can best be found. So, rotations come and go, and we can clearly see over the past month that a rotation is occurring in commodities.
The last rotation I talked about was in May of last year, when I wrote, “Industrials and the Return of Alpha”. At that point, I talked about the rotation out of non-cyclical stocks and into cyclical stocks. After a brief lull, leading economic indicators were turning back up again at that time. Stocks were discounting this improvement, and in the second half of 2013, we saw some of the best GDP increases for this country since 2011. Cyclical stocks are still working, especially late-stage cyclical stocks now in energy and materials.
Before talking about the commodity rotation, a little history lesson on the top in commodities so that you, the reader, can understand the relationships that drive commodity prices, because everything is interrelated – currencies are related to economic growth and monetary policy, which influence supply and demand of imports and exports, which, in turn, drive commodity prices.
Commodities have been hated, under-loved, and under-owned over the past couple of years. Ever since Chinese stocks topped in April of 2011, the CRB index (a commodity index) topped and so began a two-year correction.
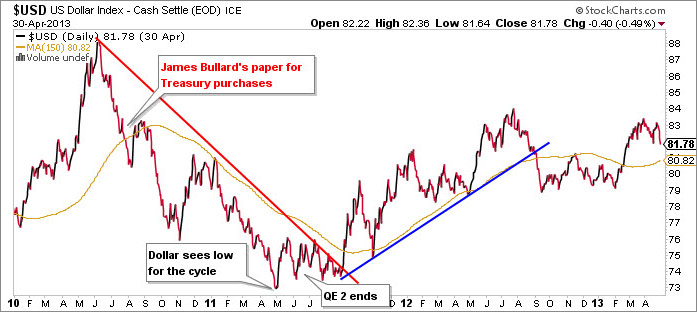
At that point in time, the U.S. dollar staged a major reversal in trend due to the end of the Federal Reserve bank’s second purchase program involving Treasuries, as well as instability in the European financial markets. The European Sovereign Debt Crisis drove investments back into the U.S. financial markets, supporting a rise in the dollar. So, the top in commodities didn’t just correspond to a top in Chinese stocks, but also the end of QE 2.0 in June of that year. Precious metals, energy stocks, and other commodities were bought before QE 2 was announced in 2010 to play the reflation trade – and it was a trade that was faded just before QE2 ended.
That’s enough of the history lesson. The importance of the history of the top in commodities is the catalysts of monetary policy and a foreign financial crisis that drove our currency higher. Additionally, the peak in Chinese economic expansion was being discounted in Chinese stocks. As China was and is a major buyer of commodities, this affected demand and price of commodities.
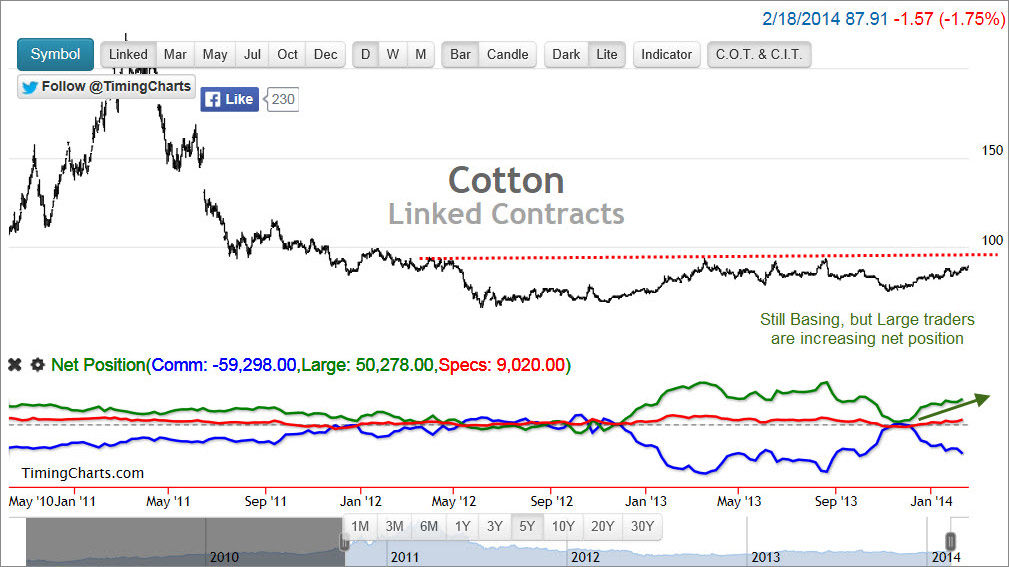
There is a rotation happening now, as I mentioned last week, wherein gold and many commodities are staging a relief rally. The possibility of a long-term bottom is high because many have broken long-term downtrends. Sentiment is changing, as I showed in the Commitment of Traders report for gold futures and options contracts. This is also the case for natural gas, oil, coffee, cotton, and more. Hogs and cattle are already in uptrends when large traders started increasing their position last summer. Here are some charts that show the price charts and the net position from the Commitment of Traders report over the last few years. Note the significant change in the last two months for large traders’ net options and futures positions on softs, metals, grains, and energy.


Is there a fundamental backdrop to an increase in commodity prices? The dollar hasn’t started a new downtrend. In fact, it’s trading in a range with no clear direction right now between 80 and 81.50 on the dollar index (not trade-weighted). The direction of the dollar depends a lot on the euro as well as the yen. The dollar fell in the third quarter last year as the euro rallied. In truth, the dollar has been trading within a range for 5 years. Before that, it was in a downtrend from 2002 to 2008, corresponding to the biggest bullish run in gold and other commodities since the 1970s.
We got the Federal Reserve Minutes for the January meeting yesterday. In the minutes, did the Fed appear to want to ease more? Is there going to be a new plan to increase inflation up to the 2% target? No. Rather, there was a heated debate on whether “it might be appropriate to increase the federal funds rate relatively soon.” In addition, it was probably the Fed hawks that indicated it would be appropriate to raise rates “before the middle of the year”. One could argue that near 0% interest rates, any rise would be “removal of accommodation” back towards the average Fed Funds rate level; but, technically, it is tightening policy to raise rates.
In addition, the Fed showed no inclination to delay the tapering of purchases despite recent weather-related weakness in the economy. The vote to taper in January was unanimous. I agree that the fed’s taper program isn’t “tightening”. It’s a removal of accommodation and return to “normal” monetary policy tools that focuses on forward guidance and the Fed Funds rate (which influences short-term rates); however, the Fed is still increasing its balance sheet every month, and, technically, that is easing.
All of this is just posturing by the Fed to manage the markets. It is important to understand policy, as it really does affect currencies, liquidity, and credit, all of which commodity traders watch to make bullish or bearish bets. As I showed above, commodities are undergoing a sentiment change as large investment managers and hedge funds increase their net position in commodities by increasing their long exposure or decreasing their short exposure. It’s clear on the charts that this is having a positive effect. Some, like myself, will call it a trade. Whether it becomes a long-term trend, we’ll have to look to commodity demand. Obviously, the winter is affecting crops, and so we see prices rising in softs and grains. Cattle and hogs have been on the rise since mid-last year. Possibly on the wealth-effect, but these animals need to be fed, too. If corn prices go up because of ethanol use or crops freezing, meat prices will follow. Eventually, weather changes, and is never a long-term catalyst. So, watch commodities like you would a speculative trade; however, the charts have put in what looks to be the recipe for a long-term bottom, which we didn’t see last year.
Looking at other asset classes, oil broke out above $100/barrel this week. Technically, crude has completed a double-bottom with a price objective near $107.50 and resistance near last year’s high around $110. Oil stocks are breaking out of 2-year long consolidations like service companies: Nabors Industries (NBR), Basic Energy Services (BAS), and Baker Hughes (BHI), as well as in natural gas and oil producers like Southwestern Energy (SWN), Ultra Petroleum (UPL), Canadian Natural Resources (CNQ), and many more. Many of the material companies are also showing long-term bottom conditions. I’ve even started looking at coal companies again for the first time in two years, but I still think they have more time to go.
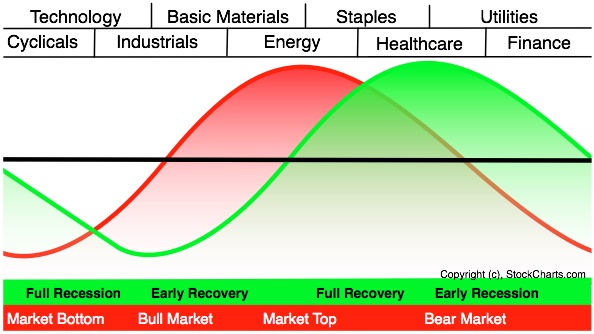
Chemical companies, aluminum companies, steel, cement, precious metals, and diversified mining stocks are all beginning to look interesting again. These companies do well when the market believes the market cycle and economic cycle are in full recovery mode. As consumer discretionary and industrials performed last year, the next to perform are typically materials and energy.
So there you have it: rotation comes and it goes. Right now, it’s clear that a rotation is happening. Just when I thought it was a done-deal that financials would be the best performers with a widening yield curve, a winter season comes and slows down economic activity, putting pressure on long-term yields. So, this trade has been put on hold, and a relief rally has begun in commodities. Watch for the rotation and don’t be caught unawares!


-
I know Mike is a very solid investor and respect his opinions very much. So if he says pay attention to this or that - I will.
~ Dale G.
-
I've started managing my own investments so view Michael's site as a one-stop shop from which to get information and perspectives.
~ Dave E.
-
Michael offers easy reading, honest, common sense information that anyone can use in a practical manner.
~ der_al.
-
A sane voice in a scrambled investment world.
~ Ed R.
Inside Edge Pro Contributors

Greg Weldon

Josef Schachter

Tyler Bollhorn

Ryan Irvine

Paul Beattie

Martin Straith

Patrick Ceresna

Mark Leibovit

James Thorne

Victor Adair