
Bonds & Interest Rates
 With those words, the new Fed Chairwoman sent world markets into a tizzy. How could that be, and what, pray tell, did she mean?
Fear not, gentle reader, for I am well versed in the convoluted sub-dialect of Fed-speak, and I’ll lead you through Wall Street’s latest hissy fit. The bottom line, as I’ll explain later, is not to worry. Traders are freaking out over nothing special.
After six painful years, the economy is slowly returning to something approaching normal. Soon, workers will be able to demand higher wages, and consumer prices will rise. This is good news — it’s what we want to happen. A side effect is that we’re soon going to return more traditional monetary policies, and that will apparently take some getting used to. In this week’s CWS Market Review, I’ll explain what you need to know.
I’ll also walk you through the latest earnings report from Oracle. The bottom line number was a tad disappointing, but that was more than made up for by rather rosy guidance. I expect the enterprise software giant soon to hit $40 per share, which it last touched 14 years ago. I’ll break it down in a bit, but first, let’s look at this week’s Fed meeting and why everyone’s scratching their heads.
The Fed Ditches the Evans Rule
Before I get into this week’s Federal Reserve meeting, let’s back up a bit and explain how we got where we are. When the economy plunged into recession, the Federal Reserve responded by dramatically cutting interest rates in an attempt to cushion the blow and hopefully turn things around. Soon, the Fed got to 0% and couldn’t cut any more. Many of the top economic models said that short-term interest rates should be negative — pay people to borrow money!
The Fed decided the best way to get below 0% was to buy bonds. Lots and lots of bonds. The fancy term for this is Quantitative Easing or QE. They tried this a few times for limited periods, but it wasn’t enough. Finally, they threw up their hands and said, “we’re going to buy bonds until things get better.” Specifically, the plan was to purchase $85 billion each month in Treasuries and mortgage-backed bonds.
The market loved the plan, and stock prices soared. But investors wanted to know: How long would the bond-buying party last? The idea floated by Charles Evans of the Chicago Fed was to lay out a specific unemployment number and say, “we won’t end QE until we hit this number.” The Fed adopted the Evans Rule and said that 6.5% unemployment was their threshold. (The Evans Rule also included 2.5% for inflation, but we’re a long way from that.)
Stock prices continued to climb, and the unemployment rated started to fall. Then some investors got nervous because we were getting close to 6.5% on jobs, but the economy obviously needed more QE. The reason is that so many people had left the workforce, and as a result weren’t counted as part of that 6.5%. In other words, the economy is weaker than that unemployment number suggests. As a result, the belief was that the Fed would soon abandon the Evans Rule (I first mentioned this in January), and that’s exactly what happened this week. The Fed ditched the Evans Rule.
Yellen Confuses the Market
Now that leads us to the next step, and here’s where things get a little complicated. Last June, the Fed signaled that it was planning to pare back on its bond purchases. The market, predictably, freaked out. This was the famous Taper Tantrum. In four months, the three-year Treasury jumped from 0.3% to nearly 1%.
Investors believed, incorrectly, that the entire rally was due to QE, so once that was gone, the market was toast. Not only did they get that wrong, but they completely misjudged the timing of the Fed’s taper decision (to be fair, the miscommunication was mostly the Fed’s fault). Ultimately, it wasn’t until December that the Fed decided to taper its monthly bond-buying by $10 billion. In January, the Fed tapered by another $10 billion, and they did it again this week.
The Fed had said they wouldn’t raise interest rates until they were done with bond-buying. Sure, that makes sense. But now that they’re tapering, here’s the big question: How long will it be between the ending of QE and the first rate increase? In Wednesday’s policy statement, the Fed said “a considerable time,” so when Janet Yellen faced the media at her press conference, someone asked, “Well…what does a considerable time mean?” Her answer was “something on the order of six months.”
The next logical question is, “Six months from when?” Yellen said of QE’s end, “we would be looking at next fall.” That totally confused reporters. Did she mean fall of 2015? Nope, Yellen clarified by saying she meant this fall. Now six months from this fall means…a rate hike next spring? Hold on! That’s earlier than the market was expecting.
As a result, stocks dropped on Wednesday, and the middle part of the yield curve bulged. The three-year Treasury yield rose by 16 basis points, and the five-year jumped by 19 points. The two- and three-year Treasuries’ yields reached six-month highs. Utility stocks, which are highly sensitive to interest rates due to their rich yields, took a beating. On the forex market, the yen dropped against the dollar, and that took a 1.5% bite out of AFLAC‘s (AFL) stock during Wednesday’s trading. Gold, which had been doing well, has lost more than 4% this week.
When Will the Fed Raise Rates?
But does Yellen’s timetable make sense? With this latest taper, the Fed will be buying $55 billion in bonds starting with April. Follow me on this. The Fed meets again in April (they meet every six or seven weeks), so presumably another $10 billion taper would bring us down to $45 billion. Then we’d go to $35 billion at the June meeting. For July, we’d be down to $25 billion. Then in September, we’re down to $15 billion.
The next meeting would be on October 28-29. If the Fed wiped out the last $15 billion in one move, that would mean QE wraps up in November, which is indeed in the fall, as Yellen mentioned. But if the Fed tapers by only $10 billion in October, that leaves $5 billion on the table to tapered at the December meeting. That would mean that QE would be done by the end of the year. Counting six months from that, it means we’d see the first rate increase by the middle of 2015. That’s more in line with what the futures market had been expecting.
The market got tripped up by Yellen’s mention of “the fall” and “six months.” So here’s my take: I think this was a rookie mistake by Janet Yellen. I strongly doubt there’s anything close to a majority at the FOMC that thinks interest rates will rise next spring. The economy is getting better, but we still have a ways to go, and the CPI numbers are barely moving.
Let’s also bear in mind that we’re only talking about one measly rate increase. On Wednesday, the one-year Treasury yield skyrocketed all the way up to highest yield in five months — 0.15%! For an investment of $1 million, that works out to about $4 per day.
Make no mistake: higher interest rates are like Kryptonite to a bull market. I think the market is paranoid that a hawkish Fed is suddenly going to spring on them. It’s as if they’ve adopted an attitude of “prove to me that you’re going to let me down.” That, combined with a few misstatements from Chairwoman Yellen, explains what happened. Higher rates are truly something to worry about, but for now, they’re still a long way off.
Stocks rebounded impressively on Thursday. In fact, the S&P 500 barely budged between Tuesday’s and Thursday’s close. But we’re in a new world. Investors need to realize that the Fed will tighten at some point. It’s no longer a distant hypothetical. Currently most FOMC members think short-term rates will be at 1% by the end of next year, and 2.25% by the end of 2016. In other words, the Fed Funds rate will still be less than inflation for a good while more.
Let me add one more point. The FOMC’s policy statements have gotten ridiculously long. Dear Lord, they run on and on, with lots of garbage text. Please. Just tell us the basics. A Fed statement should be no more than 300 words. Period.
Oracle Misses Earnings, but Don’t Fret
After the closing bell on Tuesday, Oracle (ORCL) reported fiscal Q3 earnings of 68 cents per share. This was two cents below Wall Street’s consensus. It was also at the bottom of Oracle’s own guidance. The stock dropped sharply in the after-hours market. But as I said last week, what was more important than the actual earnings report would be Oracle’s guidance for the current quarter.
On the conference call, Oracle said to expect fiscal Q4 earnings to range between 92 and 99 cents per share. The Street had been expecting 96 cents per share, so that left open the possibility of an earnings beat.
On the revenue side, Oracle said it sees Q4 revenues coming in between $11.3 billion and $11.7 billion. Wall Street had expected $11.5 billion. New software sales and subscriptions would range from 0% to 10%. The best news was that hardware sales rose by 8%. That’s Oracle’s first increase since they bought Sun Microsystems four years ago. Total revenue climbed 4% to $9.31 billion, which was $50 million shy of Wall Street’s forecast.
At the start of Wednesday’s trading, shares of ORCL opened down more than $1. Gradually, traders realized that their guidance wasn’t so bad, and Oracle rallied throughout the day. Oracle finally made it into the green and got as high as a 12-cent gain on the day. The rally was later undone by Janet Yellen’s comments, but Oracle moved largely in line with the rest of the market.
Oracle’s business still needs to improve, but I think they’re making the right moves. I expect the shares soon to break $40, which the stock last hit 14 years ago. Oracle remains a good buy up to $41 per share.
Buy List Updates
Our Buy List continues to hold up well. I have a few updates to pass along. Microsoft (MSFT) closed above $40 per share for the first time since 2000 (notice how a lot of tech stocks are hitting 14-year highs). The software king is planning to release Office for the iPad, and Morgan Stanley had good things to say about their prospects. I’m raising my Buy Below on Microsoft to $43 per share.
The Federal Reserve just completed its latest bank “stress test,” and Wells Fargo (WFC) passed with flying colors. The Fed wants to make sure that if things go kablooey, the large banks won’t come running back to Uncle Sam for more bailout cash. Since Wells is so well run, there wasn’t any doubt it would do well.
The next part of the Fed’s decision comes next week when they say who’s allowed to increase their dividend. Again, I’m sure Wells will get whatever they ask for. WFC currently pays 30 cents per share each quarter. I’m expecting that to rise to 32 cents per share, give or take. Shares of WFC just broke out to another new 52-week high. I’m raising my Buy Below on Wells Fargo to $54 per share.
Shares of Qualcomm (QCOM) have been doing well lately. The stock just hit — take a wild guess — a 14-year high. There’s a chance we might get a dividend increase soon. I’m bumping up my Buy Below on QCOM to $82 per share. This is a very good stock.
That’s all for now. Next week is the final full week of the first quarter. We’re going to be getting more economic reports that aren’t tainted by the inclement weather. On Wednesday, the Department of Commerce will release its latest report on durable goods. Then on Thursday, the government will revise the Q4 GDP report. Last month, the original report was revised downward from 3.2% to 2.4%. Be sure to keep checking the blog for daily updates. I’ll have more market analysis for you in the next issue of CWS Market Review!
– Eddy
P.S. Do you know the difference between the different types of stock orders? Don’t be embarrassed. Many experienced investors don’t. Check out my handy guide to the different types of stock orders.

Any long-time reader knows that we routinely draw on lessons from history (sometimes obscure ones) to show that ‘this time is NOT different’.
Whenever advanced civilizations reach unsustainable levels of debt, consumption, and oppression, they get into serious trouble.
This premise is going mainstream. And a recent research paper published by a NASA funded group makes a startling, mathematical analysis about economic collapse.
Given everything that’s happening in the world, they write that “collapse is very difficult to avoid.”
NASA-funded study: Over 32 advanced civilizations have collapsed before us, and we’re next in line.

I definitely recommend you read more about this by clicking HERE – Simon Black.

Obviously an excellent Short Sale trade from Przemyslaw, who recommended short selling Gold & Precious Metal related items in his article GOLD & SILVER TRADING ALERT: A SHORT SALE posted here on tuesday.
As his trading recommendation came just before the two day sudden drop, it seems definitely worth seeing what someone who was absolutely right has to say now in this detailed and well illustrated article below.
For agressive Traders comfortable with shorting, and for those who missed making an initial purchase before the rally & are looking for a place to initiate investment positions at lower prices – Editor Money Talks
Gold & Silver Trading Alert: First Breakdown
Briefly: In our opinion short speculative positions in silver (half) and mining stocks (full) are justified from the risk/reward perspective.
The dollar’s rally and the precious metals’ decline were seen right after comments from the Fed about the planned $10 billion cut in asset purchases. They will now amount to “only” $55 billion per month.
The dollar’s rally and the precious metals’ decline had been already seen in the charts and the Fed comments served as a catalyst.
Let’s see how much has actually changed (charts courtesy of http://stockcharts.com):
(click to enlarge)

Gold moved lower once again but still not low enough to break below the rising support line. Gold is still outperforming silver and mining stocks (taking this month into account), but now the extent of the outperformance is much smaller. Still, with the situation in Ukraine still being tense, gold might hold up relatively well even if the rest of the precious metals sector declines.
At this time we see that gold’s reaction to the events in Ukraine has been very limited. When markets don’t react to factors that should make them move in a certain direction, they will likely move in the opposite direction relatively soon. In this case, it seems that gold will move lower.
The move below the rising support line (marked in red) could symbolize the start of another big downleg regardless of the geopolitical tensions. For now, the price of gold is already close to this support, but not yet below it.
(click to enlarge)

Silver’s decline was not as big as the one that we saw in gold but in today’s pre-market trading silver is once again declining more visibly than gold is. It seems that the decline will accelerate after the breakdown below the long-term rising support lines, and then accelerate further as silver moves below its 2013 low.
Yesterday, we wrote the following:
The miners‘ invalidation of the move above the 61.8% Fibonacci retracement level resulted in further declines, as expected. The GDX ETF hasn’t moved below the rising support line, though, which means that the situation hasn’t become more bearish as far as short term is concerned. It was bearish and still is, but it’s not really more bearish.
For mining stocks, however, the rising support line is much closer than it is the case with gold. If miners break below it (and they likely will), gold might follow.
The GDX ETF is now visibly below the rising support line and also closed below the 50% retracement, which are both bearish factors. We generally wait for a breakdown to be confirmed before opening or adding to short positions, but…
(click to enlarge) 
We saw a big downswing also in the HUI Index and it resulted in a major sell signal from the Stochastic indicator. In the past 3 years all cases (and many cases before 2011) when we saw this signal were followed by major downswings.
Perhaps the GDX ETF’s move below the rising support line is not confirmed yet, and we would normally not take action based on it, but combined with the major sell signal for the HUI Index and the Stochastic indicator, that seems justified.
Before summarizing, let’s take a look at the currencies.
(click to enlarge)

We previously wrote that the Euro Index was likely to decline based on the long-term resistance line being reached and that the precious metals were likely to decline significantly based on that – and they have.
The same goes for the situation in the USD Index. The U.S. currency was about to rally and it finally did. It took only one day to erase the declines of many previous days. Back in 2013 an analogous rally was even bigger, so it might be the case that the rally is not over just yet. In fact, we think the USD Index has much further to go.
All in all, we can summarize the current situation in the precious metals market in the same way we have been summarizing it for the last couple of days:
It seems that the precious metals sector will move lower in the coming weeks, but just in case the situation in Ukraine deteriorates, we are keeping half of the long-term investment position in gold. In fact, gold has been outperforming both silver and mining stocks since Russian troops entered Crimea.
At this time however, the technical picture for mining stocks has deteriorated significantly, and thus in our opinion adding to the currently opened short position in mining stocks is justified from the risk/reward perspective.
It seems to us that if it weren’t for the events in Ukraine, the precious metals sector would be already declining and perhaps testing the 2013 lows or moving below them. This could still take place and it’s quite likely to happen once the situation in Ukraine stabilizes.
To summarize:
Trading capital (our opinion): Short positions: silver (half) and (full) mining stocks.
Stop-loss details:
– Silver: $22.60
– GDX ETF: $28.9
Long-term capital (our opinion): Half position in gold, no positions in silver, platinum and mining stocks.
Insurance capital (our opinion): Full position
Thank you.
Przemyslaw Radomski, CFA
Founder, Editor-in-chief
Tools for Effective Gold & Silver Investments – SunshineProfits.com
Tools für Effektives Gold- und Silber-Investment – SunshineProfits.DE
* * * * *
Disclaimer
All essays, research and information found above represent analyses and opinions of Przemyslaw Radomski, CFA and Sunshine Profits’ associates only. As such, it may prove wrong and be a subject to change without notice. Opinions and analyses were based on data available to authors of respective essays at the time of writing. Although the information provided above is based on careful research and sources that are believed to be accurate, Przemyslaw Radomski, CFA and his associates do not guarantee the accuracy or thoroughness of the data or information reported. The opinions published above are neither an offer nor a recommendation to purchase or sell any securities. Mr. Radomski is not a Registered Securities Advisor. By reading Przemyslaw Radomski’s, CFA reports you fully agree that he will not be held responsible or liable for any decisions you make regarding any information provided in these reports. Investing, trading and speculation in any financial markets may involve high risk of loss. Przemyslaw Radomski, CFA, Sunshine Profits’ employees and affiliates as well as members of their families may have a short or long position in any securities, including those mentioned in any of the reports or essays, and may make additional purchases and/or sales of those securities without notice.

Putin’s Nickel-Plated Gun
Russia has essentially annexed Crimea and is amassing troops at the border of Ukraine. The relationship between the United States and Russia has regressed back to the Cuban Crisis days. While we may not be on the verge of trading nukes, it does seem we are headed for a new Cold War.
Every time Obama draws lines in the sand, Putin steps across them, whistling. Last week, Obama struck back in a surprise move by releasing five million barrels of crude oil from the Strategic Petroleum Reserve. This drove down the cost of West Texas Crude (WTI) from $105 to $98 a barrel.
Russia gets half of its revenue from exporting oil and gas. Obviously the cheaper oil is, the less money Russia makes from its sales. The SPR release was a message to Putin that the financial side of this coming war has begun. Commodity markets will be used as a weapon against the Putin regime starting… now.
But two can play it this way, and Putin has already stated that there will be reprisals for any type of sanctions.
Norilsk Nickel (OTC: NILSY), a Siberian company, is the largest nickel producer in the world, which makes Russia the largest producer of nickel in the world. The metal is primarily used to make stainless steel.
The Big Bear of Nickel
In 2013, Russia exported 238,300 tons of nickel, 8.8% more than in 2012. The exported nickel was worth $3.6 billion, 2.5% less than in 2012, due to a fall in prices. Practically all the nickel was exported to countries outside the Commonwealth of Independent States.
If Putin were to cut nickel exports to Europe and the U.S., nickel prices would jump. Prices have already gone up from $6.50/lb to $7.40/lb over the last 30 days.
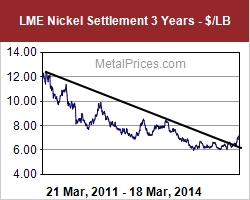 As you can tell by this chart, nickel has been a loser for more than three years now. But the down trend has been broken. The price has bottomed out with almost no volume. And as we know from the great rebound of 2009, when the nickel price starts to move, it can come roaring back.
Supply Problems
Even without the new cold war threat, nickel production is forecast to trail consumption in 2015 as the supply shrinks for the first time in years. You see, after the boom in commodities in the mid-2000s, China switched to using nickel pig iron (NPI) and invested in low-cost rotary kiln electric furnaces. This destroyed pricing power for the nickel producers and sent the price below cost. This, in turn, drove many producers out of business.
Such is the classic business cycle. Lower costs lead to lower production, which leads to supply shortages, which leads to higher costs and more production. Rinse and repeat.
Furthermore, in a cross association with our other investment theories, nickel is used heavily in the liquid natural gas industry. The Japanese use 7% nickel steel as the new standard for cryogenic LNG storage tanks, since this maximizes fracture toughness in a low-temperature environment.
This offers a new source of demand for nickel, especially since there is a good chance the U.S. will start exporting LNG to Europe as it moves away from Russian natural gas.
One way to trade nickel is to buy the iPath DJ-UBS Nickel TR Sub-Idx ETN (NYSE: JJN) like I recommended to my most valued readers of Crisis & Opportunity. We are up marginally since our buy last Friday.
It should be noted that nickel is the only industrial metal up today, a day when copper is looking like the proverbial falling knife.
Keep Your Stick on the Ice,

Christian DeHaemer
Since 1995, Christian DeHaemer has specialized in frontier market opportunities. He has traveled extensively and invested in places as varied as Cuba, Mongolia, and Kenya. Chris believes the best way to make money is to get there first with the most. Christian is the founder of Crisis & Opportunityand Managing Director of Wealth Daily. He is also a contributor for Energy & Capital. For more on Christian, see his editor’s page.
Chris DeHaemer
Ben Graham, Peter Lynch & of course Warren Buffet & Charlie Munger. Many more too in this is an exceptional collection of links to the very gifted’s opinions how to be successful evaluating companies & siezing the advantage in Markets. This author has put together a large collection. Just below is a very small portion of these links in this article. An article one might well review from time to time, especially when things get crazy – Editor Money Talks.
 Ben Graham
- Intelligent Investor
- Security Analysis
- The Interpretation of Financial Statements
- An hour with Ben Graham
- Lectures on Value Investing
- Two illustrative approaches to Formula Valuation of Common Stocks
Peter Lynch
Balance Sheet, Income Statement and Cash Flow Statement
Creative cash-flow reporting, financial shenanigans and Quality of Earnings.
1) What does each accounting sheet/statement hold?
2) Learning the components that make up each line item
3) How each line item can be manipulated for better or worse
….the extensive article & compilation of links HERE


-
I know Mike is a very solid investor and respect his opinions very much. So if he says pay attention to this or that - I will.
~ Dale G.
-
I've started managing my own investments so view Michael's site as a one-stop shop from which to get information and perspectives.
~ Dave E.
-
Michael offers easy reading, honest, common sense information that anyone can use in a practical manner.
~ der_al.
-
A sane voice in a scrambled investment world.
~ Ed R.
Inside Edge Pro Contributors

Greg Weldon

Josef Schachter

Tyler Bollhorn

Ryan Irvine

Paul Beattie

Martin Straith

Patrick Ceresna

Mark Leibovit

James Thorne

Victor Adair