
Stocks & Equities
Stocks blitzed to new highs again in the past few days, capping a remarkable three-week melt-up that’s been sparked by a growing sense that nothing can shake this market. Sentiment is quietly confident, rather than ebullient, as expectations are high among professionals that both GDP growth and earnings growth are set to rebound from anemic levels.
Yet the public is still not buying in, which means the advance is sustainable as more people are encouraged to come off the sidelines.The New York Times reported on Saturday on new research on investors in 16 countries by State Street’s Center for Applied Research that showed retail investors globally were holding an average of 40 percent of their assets in cash, up from 31 percent two years ago.
The lowest levels of cash holdings were in India, at 26 percent, and China, at 30 percent; the highest was 57 percent in Japan. The U.S. was in the middle at 36 percent, but that was an increase of 10 percentage points in just two years.

Despite the run-up in equity markets, the Times reported, people have resisted rushing into stocks and have instead added to cash. They have done this regardless of their age or amount of wealth. The study found that millennials who are under 33 and have the longest time to invest their money were increasing their cash positions at the same rate as baby boomers, who will need to draw on their investments soon.
Why is this happening? The Times asked Suzanne Duncan, global head of research at State Street’s Center for Applied Research, and she chalked it all up to fear; even though it has been more than five years since the S&P 500 hit its low. Amazing.
A low-volatility grind higher in prices such as we have seen in the past two weeks is just the climate that can make people comfortable again. In short, these cash hoarders can be persuaded to invest, and will help add fuel to the fire.
I have been saying for five years that the ultimate destination for the S&P 500 in the bull market that started in March 2009 is around 3,330, which is 53 percent higher than the current perch. This is not a wild guess; it’s 5x the benchmark index’s bear market low of 666, which has been typical for bull markets fueled by the intense capital infusion by central banks. It takes a long time for the medicine to work its magic.
Looking around, there’s plenty of optimism in the air. The IPO market is warming up, with the share of no-profit companies coming to market not seen since the dot-com mania. Look at Uber — the ride sharing/limo app, which just got a financing-round valuation of $18 billion. With a B.

Emotion is a powerful thing. So far, it’s overpowering a stretch of the calendar that is traditionally weak for stocks, as well as a lukewarm Q1 earnings season, and a disappointing -1 percent annualized contraction in the economy in the first three months of the year.
How long will it last? For the answer, keep an eye on Apple (AAPL). Much of the S&P 500′s vertical launch over the past three weeks has been due to the rise in AAPL on excitement over upcoming product announcements, share buybacks and today’s 7:1 stock split. AAPL has a huge influence on the S&P 500 (and the Nasdaq) because of its massive market capitalization.

One way to think about the situation is that as long as investors keep having an AAPL a day, they’ll keep the bears away. Another is to observe that Apple has a whole lot of catching-up to do to chase down the S&P 500, as shown in the chart above. You know I am not a fan of the company’s products or services, but it has probably been punished enough for several years of shameful product management.
Shares are cheap with a forward price/earnings multiple of 13.4x and price/sales of 3x while a comparable firm, Google (GOOGL), goes for 18x and 6x and Netflix goes for 6x and 5.5x. The Parallax Financial model, which is very conservative, has pegged the shares with an intrinsic value of $1,095. That would amount to a 68 percent move up from here.
Could a revitalized Apple be just the rocket fuel the S&P 500 needs to get to 3,300? I’m going to say yes, though with a list of caveats as long as the line outside an Apple store when a new phone goes on sale.
Best wishes,
Jon Markman
P.S. My recent picks are already posting huge gains — with my favorite stock doubling … tripling … and even quadrupling. Now I have 5 red-hot technology stocks for you to check out. Just click here for your FREE copy of my report, New Technology Superstars for 2014.

Long-term capital appreciation in all market cycles by tactically allocating its exposure amongst equities, fixed income, commodities and currencies during periods that have historically demonstrated seasonal trends is the objective of the Thackray Market Letter. The 2014 June letter HERE covers the following topics:
- S&P 500 technical breakout, but weak volume

- Draghi rally will it last?
- Biotech back from the dead
- Gold ready to shine
- Bonds still time to go
- 9 Stocks to Buy, Sell or Hold
…..and much more, the entire Letter HERE
also:
June Videos
(1) Market Update: https://www.youtube.com/watch?v=rUhzeXdmq_c
(2) Sector Update: https://www.youtube.com/watch?v=w1Juw4r27vs
Brooke Thackray

Stocks wasted no time pushing to new highs late last week… thanks to the bears.
Yes, The S&P 500 closed at a new all-time high on Friday. Stocks are up more than 5% on the year now. But a lot of traders are sold on the market’s strength right now…
“[Short sellers] are loading up again, sending bearish wagers in the SPDR exchange-traded fund tracking the Standard & Poor’s 500 Index (VIX) to almost 11 percent of its shares, the highest proportion since 2012,” Bloomberg reports.
No worries. You can make these bearish bets work in your favor. It’s worked before—and it could work again this year.
How?
After bearish bets peaked in 2011 and 2012, Bloomberg notes that the S&P rallied more than 14% in six months.

“One of the best things you could do in the stock market over the last three years has been to buy shares from short sellers,” Bloomberg declares, “who borrow stock with the aim of replacing it once the price falls.”
But it isn’t just the bears who hate stocks. The average investor isn’t down with this rally, either.
“According to a new study published in the Financial Analysts Journal, investors (that’s both individual investors an institutional investors) currently have the lowest percentage of their portfolios invested in stocks since they began collecting data in 1959,” reportsJonas Elmerraji from our trading desk. “Just 37.7% of portfolios are stock positions at last count.”
“How many years of blockbuster returns can investors sit out on before they start acting impulsively and we get a return to a buying frenzy market?” Jonas asks. “My guess is not many more. Even though stocks are hitting new high notes this month, we’re far from being in an irrationally exuberant market.”
Regards,
Greg Guenthner
for The Daily Reckoning
P.S. Jonas sees this fact as yet another reason to believe there’s a lot more upside room for stocks to run in 2014. What for additional short-covering to potentially push stocks even higher in the coming weeks. Sign up for the Rude Awakening for FREE today to see how you can trade these trends for huge gains…

For all those analysts (including this one) who thought the debt binge of the previous decade marked end of the Age of Leverage, well, not so fast. It turns out that memories are short and government printing presses are powerful, and this combination has turned the “Great Deleveraging” into a minor speed bump on the road to something even more extreme. As the following chart illustrates, the growth in total US debt flattened in 2009 and 2010, with government borrowing more-or-less offsetting a decrease in consumer and business loans. But now the trend is once again onward and upward across the board.

Prudent Bear’s Doug Noland publishes a quarterly analysis of the Fed’s Z.1 report of US credit market activity. This is always a must-read, but last Friday’s was truly extraordinary. Among other big, ominous trends, Noland notes the following:
• Total (financial and non-financial) Credit jumped $484bn during Q1 to a record $59.399 TN, or 347% of GDP.
• Total Non-Financial Debt (NFD) expanded at a 5.0% rate.
• Corporate borrowings grew at a robust 9.3% pace
• Federal government debt mounted at a 7.1% rate
• Consumer credit rose at a 6.6% rate
• Household net worth surged $7.98 TN, or 10.8%, over the past year.
• Over the past four years, household holdings of financial assets have surged $22.0 TN, or 49%, to a record $67.2 TN.
What’s happening? The short answer is that zero interest rates have finally begun to work their magic. Corporations, for instance, are using the proceeds from low-rate bonds to buy back stock on a vast scale. See Zero Hedge’s Here’s the mystery and completely indiscriminate buyer of stocks in the First Quarter.
And now cheap credit is leading consumers to start buying cars and using plastic. Here’s an excerpt from a Financial Sense article asking how US consumer spending could be rising while incomes are not:
“One of the questions discussed was “how is this increased spending financed?”. It’s a fair question, given the painfully slow wage growth in the US.
On Friday we got our answer. US consumer credit outstanding spiked way above expectations. While the media focused on the jobs report, this was the key news item:

Source: Investing.com
Unlike in previous Fed reports that showed consumer credit growth driven by student loans and to a lesser extent auto finance, we saw something new this time around. The increase was caused by a jump in revolving credit. Americans are warming up to using plastic again.
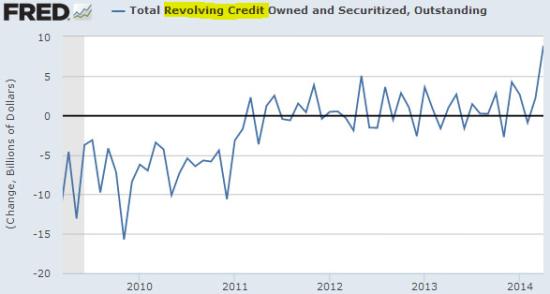
Source: Investing.com
This is certainly a positive signal because it shows that household confidence is improving sufficiently to send consumers shopping. Unfortunately a great deal of what Americans bought came from abroad, causing the US trade deficit to jump unexpectedly. The effect on GDP growth from this jump in consumer spending will therefore be relatively muted.
Some thoughts
It was just six years ago that soaring consumer spending, massive trade deficits and generally excessive debt caused the biggest crisis since the Great Depression, and here we are back at it. The details are slightly different but the net effect is the same: inflated asset prices, growing instability and rising risk of a systemic failure capable of pulling down pretty much the whole show.
All of which creates a fascinating economic landscape in which families are making no more money than they did last year but are borrowing to buy things they don’t need, while corporations sell bonds to pump up their stock prices and by implication their executives’ year-end bonuses. It is, in short, another debt-fueled orgy in which the most vulnerable individuals are being suckered by governments and corporations into mortgaging their futures in order to transfer wealth to the “smart money.” Recall the Z.1 Report finding that household holdings of financial assets have surged by $22 trillion in just four years.
This is sad in one sense because the people being hurt are, as always, not the architects of this latest bubble. But it’s also exasperating because the same thing happened JUST SIX YEARS AGO and should still be fresh in the memories of the adults doing the borrowing and spending. Unless all those food additives and pesticides are impairing the average person’s cognitive functioning (which is a subject for another day) the people using credit cards to buy Chinese-made junk really have no excuse.
For now, the bubble is the story, and the fact that it’s hitting its stride with stocks and bonds already at record levels is a new twist. Just about the only thing that can be said with near-certainty is that the next few years will be more volatile than the last few.
CANADA: Vancouver, Calgary, Edmonton, Toronto, Ottawa & Montréal Housing as well as National MLS Residential Sales and the Average Price of Vancouver, Calgary & Toronto Condos – For Larger Chart Go HERE

The chart above shows the average detached housing prices for Vancouver, Calgary, Edmonton, Toronto, Ottawa* and Montréal* as well as the average of Vancouver, Calgary and Toronto condo (apartment) prices (Left Axis). On the right axis is the MLS Annual Total Residential Sales across Canada. *Ottawa data are combined residential (Not SFD); *Montreal data are median SFD (not average) and usually not reported until 2nd week of the month.
In May 2014 Edmonton average detached single family, Toronto condos, Ottawa combined residential and Montreal median SFDs all hit new record prices although Montreal has been there a total of 5 times in the last 12 months.
The booming markets of Calgary, Edmonton and Toronto force intrepid bidders to scale the wall of disadvantage where vendors currently enjoy a 40-50% absorption rate and a +/- 2 month average listing life (MAR-MOI charts). Elsewhere it’s a grind.
Will the new “posted retail” 5 year fixed rate mortgage low of 4.79% drive the hunger games into overtime? (if you shop around you can get sub-3% on a 5 year fixed) Notice that the seasonally adjusted national MLS sales have plunged and are 12.4% below the 2007 peak.
It is interesting to note that the combined average price of a Vancouver, Calgary & Toronto condo is currently 25% more expensive than a median priced Montreal SFD and note also that in the spring of 2006, those 3-City average condos zoomed 58% in price (over $100,000) in just 3 months as the buy side of the market freaked out over the inversion of the 10yr less the 2yr spread as it went negative (Yield Curve).

-
I know Mike is a very solid investor and respect his opinions very much. So if he says pay attention to this or that - I will.
~ Dale G.
-
I've started managing my own investments so view Michael's site as a one-stop shop from which to get information and perspectives.
~ Dave E.
-
Michael offers easy reading, honest, common sense information that anyone can use in a practical manner.
~ der_al.
-
A sane voice in a scrambled investment world.
~ Ed R.
Inside Edge Pro Contributors

Greg Weldon

Josef Schachter

Tyler Bollhorn

Ryan Irvine

Paul Beattie

Martin Straith

Patrick Ceresna

Mark Leibovit

James Thorne

Victor Adair