
Bonds & Interest Rates
 While many economists and market watchers have failed to notice, we have entered a new chapter in the short and checkered history of central banking. This paradigm shift, as yet unaddressed in the textbooks, changes the basic policy tools that have traditionally defined the sphere of macroeconomic decision-making.
The job of a central banker is supposed to be the calibration of interest rates to achieve the optimal rate of growth for any particular economic environment. It is hoped that successful decisions, which involve perfectly timed moves to raise rates when the economy overheats and lower them when it cools, would bring consistency and stability to the business cycle that many fear would be dangerously erratic if left unmanaged. That’s the theory. The practice is quite different.
Over the past thirty years or so, interest rates have been lowered far more often than they have been raised. This makes sense. Bankers, being human, would rather err on the side of good times not bad. They would rather leave the punch bowl out there a little too long than take it away too soon. Over time, this creates a huge downward bias. But things have really become distorted over the past eight years, a time period during which interest rates have never gone up. They just go down and stay down.
Back in the early years of the last decade, Alan Greenspan ventured into almost unknown territory when he lowered interest rates to 1% and left them there for more than a year. But in today’s terms, those moves look hawkish. In the wake of the 2008 financial crisis, Ben Bernanke brought interest rates to zero, where they have remained ever since.
But old habits die hard, and economists still expect that rates can and will go back to normal. They assume that since the economy is now apparently on solid footing, the period of ample accommodation is over. In reality, we have built an economy that is now so leveraged that it needs zero percent interest rates just to tread water.
Based on statistics from the Bureau of Economic Analysis, from 1955 to 2007 Fed Funds rates were on average 230 basis points higher than average GDP growth (5.7% vs. 3.4%). But from 2008-2013, Fed Funds rates have been less than half the rate of GDP growth (0.44% vs. .92%). Rates lower than GDP, in theory, should stimulate the economy. But instead we are stuck in the mud.
Twenty-odd years ago the textbooks still seemed to work. A recession hit in 1991, which brought GDP close to zero. In response, the Fed cut rates by more than 200 basis points (from 5.7% in 1991 to 3.5% in 1992.) As expected, 1992 GDP rebounded to a reasonably healthy 3.6%. But the rate cuts did little for asset prices. In that year the S&P 500 crept up just 4.4% and the Case-Shiller 10-City Composite Index of home prices actually fell almost 2% nationally.
Compare that to 2013. With Fed Funds still near zero, GDP actually fell to 2.2% from 2.3% in 2012. But asset prices were a different story. Stocks were up 26% and real estate up 13.5%. It would appear that interest rates have lost their power to move GDP and can now only exert pressure on asset prices. As a result, rates are no longer the main attraction in central banking. The real action takes place elsewhere.
The Fed and other central banks have made the active purchase of financial assets, known as quantitative easing, to be there main policy tool. QE is a more powerful drug than interest rates. It involves actual market manipulation by the purchases of bonds on the open market. Whereas zero interest rates could be compared to a general stimulant, QE is a direct shot of adrenaline to the heart. When the next recession comes, the syringe will likely come into greater use.
Since 1945 the U.S. economy has dipped into recession 11 times. The average length of the recoveries between those recessions was 58.4 months, or just under five years. The current “recovery” is already 73 months old, or 15 months longer than the average. How will the Fed deal with another contraction (which seems likely to begin within the next year or two) with rates still at or very close to zero? QE appears to be the only option.
Given that reality, the big question is no longer whether the Fed will raise or lower rates, but by how much they will ramp up or taper off QE. When the economy contracts, QE purchases will increase, and when the economy improves, QE will be tapered, and may even approach zero for a time. But interest rates will always remain at zero or, at the least, stay far below the rate of inflation. This will continue until QE loses its potency as well.
Mainstream economists will be quick to dismiss this theory, as they will say that policy is now on course for normalization. Although economic growth in 2013 was nothing to write home about, the set of indicators that are normally followed by most economists, point to a modest recovery, exuberant financial markets, and falling unemployment. But if that is the case, why has the Fed waited so long to tighten?
The truth is the Fed knows the economy needs zero percent rates to stay afloat, which is why they have yet to pull the trigger. The last serious Fed campaign to raise interest rates led to the bursting of the housing bubble in 2006 and the financial crisis that followed in 2008. This occurred despite the slow and predictable manner in which the rates were raised, by 25 basis points every six weeks for two years (a kind of reverse tapering). At the time, Greenspan knew that the housing market and the economy had become dependent on low interest rates, and he did not want to deliver a shock to fragile markets with an abrupt normalization. But his measured and gradual approach only added more air to the real estate bubble, producing an even greater crisis than what might have occurred had he tightened more quickly.
The Fed is making an even graver mistake now if it thinks the economy can handle a measured reduction in QE. Similar to Greenspan, Bernanke understood that asset prices and the economy had become dependent on QE, and he hoped that by slowly tapering QE the economy and the markets could withstand the transition. But I believe these bets will lose just as big as Greenspan’s. The end of QE will prick the current bubbles in stocks, real estate, and bonds, just as higher rates pricked the housing bubble in 2006. And as was the case with the measured rate hikes, the tapering process will only add to the severity of the inevitable bust.
So while the market talks the talk on raising rates, the Fed will continue to walk the walk of zero percent interest rates. The action has switched to the next round of QE. In fact, since none of the Fed’s prior QE programs were followed by rate hikes but by more QE, why should this time be any different? The most likely difference will be that eventually a larger dose of QE will fail to deliver its desired effect. When that happens, who knows what these geniuses will think of next. But whatever it is, rest assured, it won’t be good.
Best Selling author Peter Schiff is the CEO and Chief Global Strategist of Euro Pacific Capital. His podcasts are available on The Peter Schiff Channel on Youtube
Catch Peter’s latest thoughts on the U.S. and International markets in the Euro Pacific Capital Summer 2014 Global Investor Newsletter!

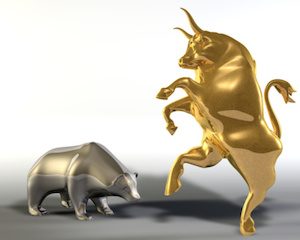
Are Government Bonds Really ‘Safe’?
 One of the striking ironies of our modern economy is that government bonds are considered safe-haven investments, while gold is a “barbarous relic” to be avoided at all costs. Since the 2008 financial collapse, the bond market has been on a tear, thanks to the Federal Reserve’s endless interest rate suppression. This has only served to reinforce the traditional notion that government bonds are “safe.”
Meanwhile, the financial media argues that gold is no longer relevant to today’s investors. They conveniently ignore the fact that gold has been a safe-haven for thousands of years, while government paper has only been around for a handful of decades.
However, government bonds fall short of traditional investment goals. A look at the history of government-issued bonds in the 20th century reveals terrible performance. Applying this historical knowledge to our current economic climate, and bonds don’t stand a chance when compared to time-tested gold bullion.
Government Bonds – An Abysmal Track Record
When making any sort of investment – whether in government bonds, real estate, or gold – a prudent investor aims to not only earn interest on the principal, but also to get the entire principal back. This is Investing 101. In fact, with safe-haven investments, capital preservation is the primary objective and any additional gain is just gravy. So an obvious way to judge the effectiveness of a supposed safe-haven asset would be to look at how well it preserved capital investment in its past.
When it comes to paying back the principal on its debt, governments have an ugly – and lengthy – history. Today I will highlight just that period in history that most closely resembles our current “Great Recession” – the Great Depression following World War I.
The League of Nations – the precursor to our modern United Nations – issued a report showing 62 sovereign states had been loaned a total of $149 billion by 1936. By the end of that year, 27 of the 62 governments were in default on both the interest and the principal on those loans. That is a failure rate of over 40%.
If you look at loans that just the United States made to other nations, the default rate gets worse. Of 40 sovereign states that the American government issued loans to following the First World War, 23 defaulted on their debt obligations. That is nearly a 60% failure rate! Had you been alive then, your chances of seeing any of your principal back on government debt were worse than a coin flip. I wonder what category that falls into over at Moody’s or Standard & Poor’s?
The most notable country at the time to default on its obligations was Great Britain. Its currency, the pound sterling, was the world’s reserve currency. Great Britain’s inability to pay its debts in full after World War I was a precursor to the pound losing its privileged role.
To be fair, governments have a near flawless record when it comes to paying the interest on their debt. But this returns us to the primary notion of using safe-havens for capital preservation. Who in their right mind would lend money to someone who only agrees to pay back a fraction of the principal? That’s not lending, that’s charity.
Are We Any Safer Today?
Snap back to today. The US government has borrowed more than it ever has before, with more than $17 trillion in debt. Consequently, the Federal Reserve’s balance sheet has ballooned to the unprecedented figure of nearly $4.5 trillion. About $2.5 trillion of that is in government Treasury notes, while $1.7 trillion is in mortgage-backed securities.
This represents a huge systemic risk to the liquidity of the entire financial system. The government lacks both the resources and the will to pay back this debt. As we’ve just seen, history shows this lack of will to be the norm, not the exception. This proves true even if your currency is the world’s reserve currency, as was the case with Great Britain.
The United States’ current position is not so dissimilar. Just as Great Britain entered World War II in a vulnerable economic condition, so is the US gearing up for yet another costly offensive (they don’t use the word war anymore) in Iraq. WWII put the final nail in the coffin of the British pound, and perhaps the US government’s military adventurism in the Middle East will do the same for the dollar.
The numbers don’t lie and the conclusions are obvious. When it comes to actually receiving the full principal of one’s loan, government debt is one of the most speculative investments an individual can make.
Welcome to the Monetary Madhouse
Today we live in the monetary madhouse erected by our central banks. Distortion and irregularity prevail, not clarity and stability. Instead of private investors looking for win-win profit opportunities in a free market for money and credit, we have central banks using “forward guidance” to dictate where capital should flow. Today’s bond market and the giant balance sheet of the Fed are a direct result of their intervention.
Nearly all government bonds are bought based on rate speculation and rarely held to maturity. What does that mean? These bonds are traded without a care given to whether or not they will see a dime paid back in principal. The bond market relies almost entirely upon making money based upon changes in the interest rate.
Let that sink in for a minute.
In any other market, the lender is highly concerned with whether or not the interest and the principal will be remunerated in full. The lender would not part with his funds if repayment of the principal were not guaranteed.
This is not the case with government. The government can borrow like no other. It maintains the illusion of solvency by only paying the interest on its debt and rolling over old debt obligations by issuing new debt as a replacement. This means the merry-go-round of debt keeps on spinning but nothing ever gets paid. This is more than enough to make any credit manager’s head spin.
Government debt is simply not a safe play in today’s markets. It’s either speculative or it’s suicidal. On the other hand, there is no speculation about gold. The yellow metal’s value has remained relatively stable for thousands of years without a government’s promise. Gold is no “barbarous relic” – it’s our financial salvation.
About Dickson Buchanan
Dickson Buchanan is Director of International Development and a Precious Metals Specialist at Euro Pacific Precious Metals. He received his MA in Austrian Economics from King Juan Carlos University in Madrid, Spain, and is currently enrolled in the doctorate program. Dickson joined the Euro Pacific Precious Metals team in 2012 after returning from his economic studies abroad. This article first appeared on Peter Schiff’s Gold Blog on September 17, 2014. To learn more about Peter Schiff’s gold & silver dealer, visitwww.europacmetals.com.
 “I’ve been thinking, the people at the Fed may be deceivers and even liars, but they are not stupid. They know that the current system depends on constant, never-ending growth. But they also know that “no tree grows to the sky.” So what are they really thinking? The people at the Fed realize that they have good jobs and that they have prestige.
They also know that they will continue their Keynesian policies for as long as they are employed by the Fed. And then when the system breaks down, which it must some day, they will be retired and the next Fed employees will take over. So enjoy it while it lasts and let the next guy deal with the ugly consequences. The Fed members may be deceitful and given to lies — but they are not stupid.
I guess the worst offender was Alan Greenspan, who while younger wrote a classic piece on the value of the gold standard. Later as Fed head, Greenspan turned his back on gold in favor of Fed-created fiat currency. Talk the truth when you’re young and idealistic. But when it comes to money and prestige, do whatever the circumstances call for. Is honesty and truthfulness just a matter of convenience?
Friday saw the Dow close below the lower band of its trading range. I accepted this as a bearish indication. When an item closes below a major big number such as 17000, it is usual for the item to decline to test the next big number. The next lower big number on the Dow is 16000. I don’t expect the Dow to collapse or crash down to 16000. In fact, I think we could see the Dow fluctuate around for a time before making its way down to 16000. My brilliant friend, Gary Shilling, believes we are in a period of ten years during which the world will deleverage and deflate. Gary believes that we have passed through six of the ten years, and that we have another four years of deflation and deleveraging to go.
I just received The Campbell Real Estate Timing Letter. This is a unique advisory service that treats the real estate industry with a technical approach. Campbell uses a series of six studies to deliver buy (bull) signals for real estate and sell (bear) signals for real estate. At present Campbell is on a bull signal. But he warns, “GAINS IN US HOME PRICES TO LOSE MOMENTUM.” In other words, Campbell’s studies suggest that we are sliding towards a sell signal.
As an indicator of current sentiment, I often use what I call the real estate indicator for NYC real estate. Prices for choice apartments or condos in NYC are in the tens of millions of dollars. The winner is an article in the New York Times stating that garage space for single cars is going for one million dollars in various choice buildings with waiting lines in some cases for space. Many foreigners (Chinese, Russian) have purchased space in NYC “just in case.” A lot of these apartments are unoccupied but are held for “emergency purposes.”
I suspect that a lot of big money is exiting the stock market in this area. And of course it’s doing it quietly and subtly. Distribution days are a good way to track the path of large investors. A distribution day occurs when an average or an index declines on volume above the preceding day’s volume. There are now two distribution days in the S&P and also in the NASDAQ. A collection of four or five distribution days within a two week period can usually halt any rally.
Investor’s sentiment in this area is “beyond white hot,” and every dip in the averages of a few points or more is seen as an opportune “buy spot.”
My old friend, Bob Prechter, of Elliot Wave fame believes that the great super-cycle bull market may now be close to topping out. His studies suggest that the coming super-cycle decline may take the Dow below 4000 near its final conclusion. Bob suggests that the dividend yield at the bear market bottom may be zero, because dividends on all stocks will be omitted. Gad, how bearish is that. But Prechter isn’t kidding, he’s serious!
October is the time when the Fed states that it will halt its quantitative easing. The Fed believes that by that time the US economy will be strong enough to get by on its own without QE. And I wonder whether the Fed actually believes that and whether the Fed will actually jettison QE. Of course, the Fed’s monthly bond-buying has helped to keep bonds higher and interest rates low. Previously when the Fed threatened to cut QE the stock market fainted, but the Fed believes this time it will be different.
Different? Below we see the widely followed 30 year T-bond. It appears to be crashing ahead of the Fed’s action. Of course, as the bond declines, interest rates go up. The US has been managing its huge deficits with the help of zero interest rates. If rates increase (as they are now doing) the management of the US debt becomes a nightmare. So will the Yellen Fed actually eliminate QE? That’s the question of the hour, the day, and the month. My thinking is that they won’t have the nerve to remove QE. And if they continue QE, the markets will take that as a sign that the Fed doesn’t believe the US economy is strong enough to survive without its beloved QE.

I couldn’t resist including this P&F chart of the Dow. Here we see this horrendous break down to the 16350 box. I expect a period of zig-zags and meaningless fluctuation. After a break like this, it’s normal to see some mixed action and an attempt at recovery. Have you ever seen a boxer get knocked to the canvas? He summons all his strength and staggers unsteadily to his feet – and then weaves around until his head clears.

Late Notes – As I suspected, after breaking under 17,000, the Dow is now recovering from that shock, and is bouncing around aimlessly.
Let me make one thing clear: I sincerely hope that the bull market will be reconfirmed and that my weary bones will have a vacation from anxiety. The Fed with its Keynesian vision believes it can hold off a correction forever. In the history of the stock market, that’s never been done.
Confidence and complacency are more acute now than anytime I’ve seen before. All expressions of overvaluation are at historical extremes. Despite this, most money managers remain in the market. The thesis is “if it’s going up, regardless of anything else, I want to be in it.” Perhaps the best indicator of complacency is the VIX which at its current level of 13 tells us that investors see no reason to protect their positions. Every minor decline is seen as a buying opportunity. The rationale is that the Fed would not allow anything worse than a 10% decline. If the stock market starts sinking between now and October 1st, I will be most interested to see if the Fed eliminates QE.
Despite the surging dollar, gold today is well over $1200, suggesting internal strength of the yellow metal. …Thus I think that the gold universe is strong and that we are building a massive base in gold. By the way, the chatter against gold has been almost deafening of late — no doubt inspired by the Fed’s denigration of gold.
Over the next few months, I expect a resumption of the gold bull market that started in the early 1930s. From a price of $20/ounce in 1930, gold has constructed an enormous bull market that has taken the yellow metal, despite a three year long correction, to a price above $1200 today. Remember, every currency that has sent gold packing has either lost its purchasing power or has disappeared. Thus it is only a matter of time before the US dollar meets its demise. RIP.”
The 90 year old Richard Russell still writes market advice daily. Contact his service at Dow Theory Letters HERE

Interest rates, oil prices, earnings, GDP, wars, terrorist attacks, inflation, monetary policy, etc. — NONE have a reliable effect on the stock market
You may remember that during the 2008-2009 financial crisis, many called into question traditional economic models.
Why did the traditional financial models fail? And more importantly, will they warn us of a newapproaching doomsday, should there be one?
This series gives you a well-researched answer.
Here is Part V; come back soon for Part VI.
Myth #5: “GDP drives stock prices.”
By Robert Prechter (excerpted from the monthly Elliott Wave Theorist; published since 1979)
Surely the stock market reflects the nation’s Gross Domestic Product. The aggregate success of corporations shows up as changes in GDP. Stocks are shares in corporations. How could their prices not reflect the ebb and flow of GDP?
Suppose that you had perfect foreknowledge that over the next 3 3/4 years GDP would be positive every single quarter and that one of those quarters would surprise economists in being the strongest quarterly rise in a half-century span. Would you buy stocks?
If you had acted on such knowledge in March 1976, you would have owned stocks for four years in which the DJIA fell 22%. If at the end of Q1 1980 you figured out that the quarter would be negative and would be followed by yet another negative quarter, you would have sold out at the bottom.
Suppose you were to possess perfect knowledge that next quarter’s GDP will be the strongest rising quarter for a span of 15 years, guaranteed. Would you buy stocks?
Had you anticipated precisely this event for 4Q 1987, you would have owned stocks for the biggest stock market crash since 1929. GDP was positive every quarter for 20 straight quarters before the crash and for 10 quarters thereafter. But the market crashed anyway. Three years after the start of 4Q 1987, stock prices were still below their level of that time despite 30 uninterrupted quarters of rising GDP.
Figure 10 shows these two events. It seems that there is something wrong with the idea that investors rationally value stocks according to growth or contraction in GDP.

Interest rates, oil prices, trade balances, corporate earnings and GDP: None of them seem to be important, or even relevant, to explaining stock price changes. But you need not trust your own eyes. In a study that is stunning for its boldness in actually checking basis premises, Cutler, Poterba and Summers in a paper for the Journal of Portfolio Management in 1989 investigated the effect of economic news on stock prices and concluded,
“Macroeconomic news bearing on fundamental values…explains only about one fifth of the movement in stock prices.”
Even here, I would question the conclusion that such news “explains” even 1/5 of the movement in stock prices. Surely a set of football statistics could generate a 1/5 correlation to the S&P. And every correlation, to have meaning, must have a theory to account for it.
What theory accommodates the idea that macroeconomic fundamentals explain 1/5 of stock price changes? If there is no accommodating theory, then the presumed causality involved is tenuous at best.v
(Stay tuned for Part VI of this important series, where we examine another popular investment myth: Namely, that “Wars are bullish/bearish for stock prices.”)
Free Report:
“The Biggest Lie in Stock Market History”
Dear Reader,
We believe risks and opportunities even larger than those of 2007-2009 lie ahead in a bear market of epic proportions.
Only problem is, this bear market is silent right now. It’s not visible to the public, because the government and the Federal Reserve inflate the credit supply and the U.S. dollar to hide its impact.
But make no mistake about it: There is a Silent Crash going on right now in the stock market, and it’s having avery real impact on your spending power.
Read this special report now, free — and see 15 eye-opening charts >>

 I have made no effort to hide the fact that I am very bullish of gold. I am, after all, writing this for a site called GoldStockBull, and in fact mydebut submission to the site was a piece in which I make the case for $10,000/oz.+ gold.
But just because I am bullish long term doesn’t mean I don’t think that the price can drop further. Now generally I am reluctant to make shorter term trading predictions because that’s not the sort of analysis that interests me, yet I think there are various signs that indicate that gold bulls may have to endure one more capitulation to the downside before the next leg of the bull market begins. In what follows I will point these signs out for the reader, and I will follow them with some investment strategies.
What Could Send the Gold Price Lower?
1—Gold Didn’t Test Its 2009 Breakout Point
Gold has experienced two significant corrections since the bull market began at the turn of the century. The first was in 2008 and the second began in 2011 and many investors believe ended at the end of 2013. One thing that differs……continue reading HERE


-
I know Mike is a very solid investor and respect his opinions very much. So if he says pay attention to this or that - I will.
~ Dale G.
-
I've started managing my own investments so view Michael's site as a one-stop shop from which to get information and perspectives.
~ Dave E.
-
Michael offers easy reading, honest, common sense information that anyone can use in a practical manner.
~ der_al.
-
A sane voice in a scrambled investment world.
~ Ed R.
Inside Edge Pro Contributors

Greg Weldon

Josef Schachter

Tyler Bollhorn

Ryan Irvine

Paul Beattie

Martin Straith

Patrick Ceresna

Mark Leibovit

James Thorne

Victor Adair