
Currency
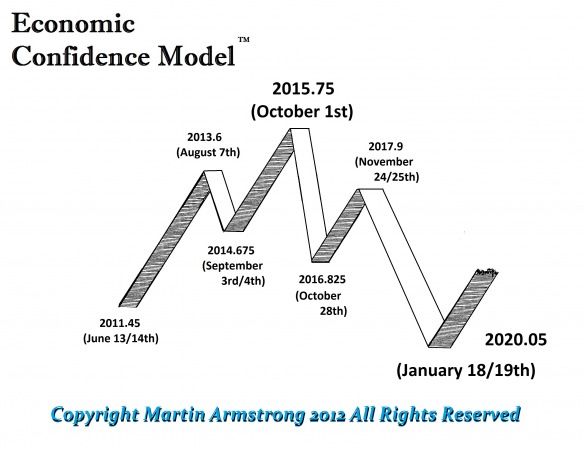
The 2014.675 turning point in the Economic Confidence Model seems to have pinpoint the shift in capital flows. The US dollar is rising and this may yet move into a serious rally that will have the politicians in turmoil have some even talking about protectionism again since morons never learn a lesson. You have to understand that a rally in the dollar isNECESSARY to turn down the economy for 2016-2020. The US economy is the ONLYthing hold up the entire world economy as it stands right now. Economic growth is becoming extinct in Europe, Russia, China, Japan, the Bricks, you name it. Let the first shot be fired between China and Japan and
watch how much dollar buying its in a single day.
 The amount of dollar haters out there is staggering. They just cannot see that the US debt of $17 trillion is not a negative – it is a positive when there is $30 trillion in central bank reserves and country wealth funds. There are NOT ENOUGH dollars to go around when there is no other place to stuff your money. This is a global problem that Europe has decided to inflict upon the world with its brain-dead idea of trying to create a single currency without a single governmednt. OOPS – too late now. Confidence has been lost thanks to France. France’s dream of competing with the USA and surpassing it – well Hollande wiped that dream from the slate – as the Italians would say – Arrivederci Francia.
Even gold has fallen for two weeks since the turn in the ECM. Gold’s Benchmark was 9/15 and that producing a low warns indeed we will see lower prices ahead. The second part to the metals report is Silver. This covers silver in all the major currencies, the silver/gold ratio, and the conclusion for the targets in time and price with respect to gold and silver. The third part is Platinum, Palladium, and Copper. The gold promoters just can’t get it through their head, sometimes there are bigger issues to consider like the global economy and where do the metals really fit in.
 The Euro is trading at the 127 level and it is sinking rapidly. We have critical support at the 122-123 level and a weekly closing below 122.44 will warn we have serious problems ahead for Europe. The Monthly Bearish Reversal lies at 125.52 and is September closes below this level, watch-out for November. Even a monthly closing BELOW 129.78 will be a sell-signal for Europe.
Dean Martin’s Arrivederci Roma may take on the status of a theme song for Europe pretty soon. This is what we get letting lawyers with ego problems run governments when they are obviously highly questionable to have practiced law to start with. We need REALpeople to grab a hold of this mess before it is way too late or perhaps Eric Clapton’s –Good Night Irene might be next to the final song we sing – Don McLean’s – American Pie.
….more from Martin:
Plight of Germany – Down For the Count?
Canada Warns its Citizens Not to Take Cash to USA

“that doesn’t suggest, but rather screams that [junior resource issues are] under accumulation—which is a very, very bullish sign.” – Rick’s justification for that powerful statement can either be listened to or read in full below – Ed moneytalks.net
>>Inteview With Rick Rule (MP3)
Full Transcript:
During a time in which few investors are considering the possibility of a recovery in natural resources, Rick Rule, Chairman of Sprott U.S. Holdings was kind enough to share a few comments.
Speaking towards the overall market Rick noted that, “The market itself is very healthy. You are seeing a transition…a transition that doesn’t suggest, but rather screams that [junior resource issues are] under accumulation—which is a very, very bullish sign.”
When asked if the current recovery might outperform the early 2000’s recovery, Rick indicated that,“[S]tatistically, this market shows it can be done because the bear market that preceded this bull market was a bear market that was more severe… bear markets are the authors of bull markets, and the recoveries in some way, shape, or form are related to the declines.”
Here are his full interview comments with Sprott Global Resource Investment’s Tekoa Da Silva:
Tekoa Da Silva: Rick, we had a meeting at our offices here recently, in which all our brokers, money managers, geologists, sat down around a table for what was a fascinating discussion on the resource markets.
You commented at one point during that meeting that we’re beginning to see a stair step formation building in the charts of the resource market; a series of higher highs and higher lows, suggesting a move of paper from weak hands to strong. Can you talk about that for our readers?
Rick Rule: Sure. I’m not a technical analyst but I have some friends who I think are fairly adept at this, [so I’ll say that], the chart pattern we’re seeing in the junior mining market in particular (but in the precious metals markets as well) is sort of a saucer-shaped recovery that is a slow, gradual recovery featuring higher highs and higher lows.
It’s important to note that the advances then consolidate—and that’s very important. The advances that don’t consolidate tend to [later] consolidate or fall off very rapidly. So what we’re seeing is a market that will advance by 10% or 12%, and then decline by 5% or 6%.
This is unnerving for people who can’t stomach volatility, people who have too much margin in their account, or people who are simply unrealistically impatient with regards to markets. But the fact that it’s frustrating doesn’t have anything to do with the market.
The market itself is very healthy. You are seeing a transition in the better stocks of the GDXJ—a transition that doesn’t suggest, but rather screams that they’re under accumulation which is a very, very bullish sign.
The slowness of the recovery suggests that the recovery is not fragile or over-extended at all. It’s very powerful and very deliberate. So I’m extremely encouraged by that. Most people of course, most speculators, want the later stages of a recovery, the “J curve”. Unfortunately for them, most speculators when they get excited, they buy. So when that J curve takes place, when the strong upward right momentum starts to build in a chart, that’s the time when one should be selling, not buying.
TD: Rick, are there other technical indications that you’re seeing now which suggest the juniors is being aggressively accumulated?
RR: Well, the chart shows just what I’ve described. If you [use] the base of a hundred, the chart would run to 112 or 113 and then consolidate back to 105 and then run to 120 or 121 and consolidate back to 109 or 110…then run to 127 or 130 and consolidate back to 115.
[So] that’s precisely what we’re seeing. It’s interesting that we aren’t seeing extraordinary volumes, just like we didn’t see extraordinary volumes in June, July and August of 2013 which [marked] the bottom.
We saw a situation then where the buyers were exhausted but there was some residual selling. So you had a down to flat market on no volume. Now you have a situation where the sellers are exhausted. It’s going up on limited volume but the buyers have the predominance.
The market will move from this recovery phase to a bull market phase, and exceeding expectations in this market is absolutely inevitable because the expectations for the sector are so low that they can’t help but be exceeded.
TD: Rick, could you comment on your expectations for the strength of this recovery, and do you feel it may be more intense than what we saw in the early 2000s?
RR: That would be difficult. The recovery we saw from the bottom in 2000 through the beginnings of the bull market in 2004 and then through the top of the bull market in 2007 were extraordinarily powerful. That was the best period of performance in my career albeit from a small base.
So outperforming that recovery would be difficult. Now statistically, this market shows it can be done because the bear market that preceded this bull market was a bear market that was more severe. The TSX Venture fell by 75% percent from its top in early 2011 to its bottom in late 2013 and we have seen in a very rough sense that bear markets are the authors of bull markets, and the recoveries in some way, shape, or form are related to the declines.
So from a statistical or empirical sense, I think that what you say could come true. From a practical sense, the recovery from the 2000 bear market was so kind to me personally that it seems disingenuous to expect a replay.
TD: Rick, I was reading the annual statement put together by Ned Goodman at Dundee Corporation who you’ve noted to be a mentor of yours over the years and he indicated that he has learned that you don’t make money when everyone is running into stocks.1 You make money when no one wants to buy.
Despite that statement—few people seem to be interested in investing in resources. What are your thoughts?
RR: It’s common at a bear market bottom that while people empirically understand the goods are on sale and they’re going to make money, that their recent experience has been so bad that they won’t allow themselves to reenter the market until they have confirmation from the market itself that it’s safe and attractive to do so.
It’s amusing to me that you point out Ned Goodman. I remember a speech that he gave at the Prospectors and Developers Association of Canada in 1999 basically saying that the pivot point was in, and the bear market was over.
I would suspect that Ned was within three or four months of being right. I don’t really consider Ned to be a market timer but what he is, is a 76-year-old guy who has been in resource markets for 50 years, and right now, people are saying to Ned with regards to his bullishness on the market that, “Well, Ned has been saying that for a year and a half. Why would anybody possibly listen to him?”
Well, how about the fact that he’s a self-made billionaire? That might be a reason. How about the fact that he was stupendously right in the 1998-2000 bull market? How about the fact that when he spun Dundee Corp. out of Corona in the early 90s bear market, the stock of Dundee went from $.80 cents to $42 in the ensuing bull market?
I’m one of those who believe that past is prologue and I am one of those who believe that self-made billionaires who are still active in the market are people worth listening to. So I think that Ned may be anecdotal data but I think he’s very, very good anecdotal data. Of course it doesn’t hurt that his conclusions are very similar to my own.
TD: I’d like to ask you about the idea of pyramid portfolio allocation. I remember you noting it could be a rewarding strategy for an interested speculator. What are your thoughts on how one could construct a pyramid portfolio in the resource space?
RR: With regards to the precious metals, I think that an investor needs to ask himself or herself first of all if they believe in the precious metals thesis, and if they believe that there is a place in their portfolio for precious metals and precious metals equities; A, because they’re unloved, and B, because they’re traditional antidotes for popular instruments like the U.S. 10-year treasury.
If the answer is yes, then investors and speculators need to ask themselves whether the precious metals they have in their portfolio are sufficient or whether they need to add more. We have found that most general market investors are under-invested in precious metals from our own point of view.
If the investor agrees with that statement, they need to decide further whether they want to hold their precious metals in physical form or in the form of ETFs or trusts. I have chosen (not surprisingly) to hold most of my precious metals in the form of the Sprott Physical Trusts; the Physical Gold Trust, the Physical Silver Trust, and the Physical Platinum and Palladium Trust.
I’ve done that for three reasons. One, because it’s a hassle to hold physical precious metals although I do hold some, two, because the ease with which one can buy and sell on the New York Stock Exchange (as opposed to a coin dealer), favors particularly for an older person like me, a certificated product.
Finally, because the certificated product for American taxpayers (of whom I am one unfortunately), affords one capital gains tax treatment, while on the other hand holding the physical precious metals affords one income tax treatment. So the tax arbitrage between the capital gains and ordinary income rates in the upper tax brackets is very substantial.
So the first thing that one needs to do is decide whether or not their precious metals holdings are sufficient and two, in what form they wish to own them.
The second decision then if you buy the precious metals argument after having achieved the beta of the metals with physical precious metals holdings is—do you want to chase alpha? In other words, do you want the leveraged performance that a precious metals bull market would generate in the equities?
If that’s the case, how do you want to do it? With regards to the big companies, I am increasingly convinced that investors should not be buying the market, or a market cap weighted ETF like the GDX which rewards size, but rather through buying very high quality individual companies or an ETF that concentrates on qualitative rather than size selective measures.
That was the thinking behind Sprott’s launching of the Sprott Gold Miners Index, the SGDM, which is a low fee ETF product that selects stocks not by aggregate size but rather by corporate performance metrics such as increased revenue, which means that their production base is growing rather than declining. A key problem in the gold business is cash flow generation because the industry as a whole doesn’t generate much cash even at higher gold prices, but individual companies such as Franco-Nevada, Goldcorp, or Royal Gold generate substantial cash.
So I would suggest that if somebody wants to capture alpha that they first start with the major mining companies. The high quality major mining companies will be the first to move in the event that the metals prices go up.
Then at the top of the triangle are the speculative juniors that we at Sprott Global are so well-known for and there are two different ways to play those. You can play the after market in those stocks which are free trading shares on the exchange (the higher quality ones of course), and then there’s the tippy top of the pyramid for those investors who are accredited investors. By that I mean participating in private placements in the junior sector. The attractiveness of that is if the private placement is intelligently constructed, you get “warrants” which are the right but not the obligation to buy more stock at a fixed price over time, which you can exercise if the company generates value internally or if the market itself recovers.
TD: Rick, Warren Buffett is known for having said that a bull market is like sex in that it feels the best right before it ends.2 I asked you back in January, your thoughts on the general equities market. I’d like to ask again: When you look at the strength of the S&P 500, reaching all-time highs3 —what are your thoughts?
RR: Well Tekoa, with the caveat that I’m not a general market securities analyst and also with the caveat that I’m not an economist—I’m a credit analyst—the sentiment associated with the broad market seems too strong to me.
I own some general market securities and I have some money managed by others in the broad market, but I have to say I’m nervous. I’m nervous because [the market strength] presupposes that the North American economy (at least) is in recovery and I see no particular evidence of that recovery, although I will say that over the last quarter, there are signs that the biggest companies in the United States are beginning to invest in property, plant and equipment—which is a useful sign.
But I’m not seeing much by way of increased worker’s incomes outside of the oil and gas industry in the United States, so it’s difficult for me to see a recovery happening without rising real wages in the middle class.
If we began to see rising wages, then we would see a consumer cycle where the North American auto fleet and North American durable goods, things like refrigerators and washing machines (consumer durables), begin to get bought because the used inventory – in terms of its age, is at an all-time high. If we had real growth in workers’ incomes, we would be replacing the auto fleet and we would be replacing our durable goods inventories.
If we saw that, then we would begin to see greater property, plant and equipment investments by major companies in the United States. That increased capital employed by workers would continue to increase real workers’ wages. It seems to me like the strength we’re seeing in the S&P 500 presupposes that this is going to happen, and if that’s true, the S&P 500 isn’t expensive. I just don’t know that it’s true.
The second thing that’s worrying to me is that the debt and equity markets rally we’re in is surely the stuff of very, very low interest rates. I talk to investors every day whose behavior is being determined by the very low return that they’re getting on savings.
Investors are getting forced into riskier and riskier activities. They’re going further out the yield curve to increase their income, and remember that debt instrument pricing is set by the delta between their yield and the yield on the U.S. 10-year treasury.
As an example, in the junk debt markets (which more and more people are being forced into), if the median yield is 7%, and the yield on the U.S. 10-year treasury is 2.7%, the delta is 4.3%, something like that. If the yield on the U.S. 10-year treasury were to go from 2.7% to 3.5%, the delta (which is what the pricing is based on) would decline by about 25% or 30%, and it wouldn’t surprise me to see a commensurate impact on the debt markets, meaning a pretty ugly decline, and I could see that spilling over into the equities markets.
So I would tell readers with regard to the general securities markets, please don’t buy the entire market. Buy individual securities where you believe the business will grow of its own volition for old-fashioned reasons, like the company servicing its customers well and as a consequence of that, beating its competitors well. Don’t buy the market. Buy individual stocks.
TD: Rick, in wrapping up, is there anything else you think we may have missed?
RR: No, I think we’ve asked people to understand an awful lot Tekoa. I would ask the readers that if they agree with this way of thinking, that they reach out to us. I espouse what I of course believe to be correct and we would welcome the opportunity to do business with like-minded people.
TD: Rick Rule, chairman of Sprott U.S. Holdings, thank you for sharing your comments.
RR: Thank you Tekoa.
 If the Fed holds its course this autumn then a day of reckoning is coming both for stocks and bonds. For stocks basically the money will run out, the QE lifeline is cut. For bonds higher interest rates are toxic
In such circumstances can the precious metals really fail to rally as safe haven options? This is not 2008-9 when interest rates fell through the floor and boosted bonds to the immediate detriment of gold and silver.
Toxic interest rates
….continue reading this article posted Sept. 24th HERE
Gold and silver end correction as US stocks tumble
posted Sept. 26th
Gold and silver prices enjoyed a sudden surge yesterday as US stocks fell in their worst single day for two months. Is this the end of the precious metal correction and the start of something nasty for stocks?
Gold prices spiked to $1,228 and silver to $17.72 an ounce giving the precious metals respite from a summer correction. Both metals were looking very oversold and an obvious buy from a contrarian perspective with negative market sentiment at a peak.
Correction over?
….continue reading HERE
 Since early 2013 the US stock markets have done nothing but rally, levitating thanks to the Fed’s oft-implied backstop. This incredibly unnatural behavior has left sentiment dangerously unbalanced, with hyper-complacency and euphoria running rampant. Only a major selloff can restore normal psychology. And with the Fed’s third quantitative-easing campaign ending, odds are high such a big downside event looms.
Stock markets are forever cyclical. Stock prices don’t move in straight lines forever, they endlessly rise and fall. Great cyclical bulls that earn investors fortunes are followed by brutal cyclical bears that create the best opportunities to buy low again. The perpetual cyclicality of the stock markets reminds me of Mark Twain’s famous weather quip. If you don’t like current stock prices, just wait a spell and they’ll change!
The rising and falling of stock markets is fractal in nature, repeating at different scales. There are great 17-year secular bulls and bears driven by valuations, the markets’ overarching cycles. Within them are still-large cyclical bulls and bears, generally lasting from 2 to 5 years each. And then in turn these are punctuated by smaller countertrend moves, corrections inside cyclical bulls and bear-market rallies in bears.
These mid-cyclical-bull selloffs are exceedingly important for the bulls’ health. When stock prices rise, the great sentiment pendulum swings ever farther towards the greed extreme of its arc. If the excessive optimism that rising stocks always create grows too unbalanced, all near-future buying is sucked in. So the stock rally soon burns itself out, leaving nothing but sellers. This dynamic is what breeds stock selloffs.
The serious risk today is that these selloffs tend to be proportional to the rallies that led into them. The longer stock markets climb without a major selloff to rebalance sentiment, the more unbalanced trader psychology becomes to the greed side. This necessitates commensurately larger and/or sharper selloffs to bleed off the excess euphoria and bring sentiment back into line. That means we are in for a doozy of one today!
For the better part of two years now, the American Federal Reserve has tirelessly worked to short-circuit every nascent stock-market selloff. Both by actively creating new dollars out of thin air to monetize debt, and by incessantly jawboning about further easing, the Fed convinced stock traders that it would be quick to respond to any stock-market weakness. So they bought and bought, nipping every selloff in the bud.
But with no real selloffs, sentiment couldn’t be rebalanced. Thus greed, euphoria, complacency, and even hubris flourished immensely. This pulled vast amounts of buying forward, effectively bullying far more investors into buying stocks than would’ve otherwise done so in normal markets. This so-called Fed Put led to the most distorted, overvalued, overextended, and risky markets we’ve seen since the early-2000 bubble.
The Fed’s insanely-reckless actions merely delayed the inevitable selloff, and ensured it is going to be a heck of a lot larger than normal. This reminds me of wildfire suppression. The more often firefighters rush to extinguish little fires, the thicker underbrush grows. All that fuel is a time bomb, just waiting for the right conditions and spark. The resulting massive and terrible conflagration finally rebalances the system.
To illustrate just how choked up with tinder-dry greed today’s Fed-distorted stock markets are, I built a couple charts. They superimpose the flagship SPDR S&P 500 ETF (SPY) over the famous VIX implied-volatility fear gauge. Since the Federal Reserve had never done anything remotely like the open-ended QE3 bond monetizations in its entire century-long history, no one has ever witnessed markets like these before.
The Fed’s totally unprecedented third quantitative-easing campaign was hatched back in September 2012, and then more than doubled a few months later in December. That’s when stock traders started to believe the Fed would swiftly arrest any material stock-market selloff, thus the levitation was born. Ever since then, stocks have essentially done nothing but rise. All selloffs were stunted before they could mature.
Stock-market selloffs are categorized by size. Anything under 4% on the benchmark S&P 500 (SPX) is nothing but noise, it doesn’t even qualify for a formal label. Such trivial selloffs naturally do nothing at all to eradicate excessive greed, so they are usually ignored. But thanks to the Fed’s implied backstop on stock markets, they’ve dominated its QE3 levitation. The larger ones are noted in this chart in green.
Once a selloff gets over 4%, it’s classified as a formal pullback. Selloffs of this magnitude start to demand traders’ attention, sending cracks cascading through the universal greed that arises when stocks grow too overbought. In normal healthy bull markets, pullback-magnitude selloffs are seen several times a year or so. But thanks to the Fed, we’ve only seen 4 in this levitation that were oddly clustered in its middle.
Pullbacks certainly aren’t major selloffs, that designation only comes after 10% when downside moves become actual corrections. These do the most work in rebalancing sentiment by far, greatly reducing greed and ramping fear by their ends. Like underbrush getting burned out, that leaves bull markets in a healthy state psychologically ready to be bid higher again. Corrections happen once a year or so on average.
But in the 22.1 months between SPY’s November-2012 bottom and its latest high last week, this mighty S&P 500 ETF has soared 48.7% higher without a single correction-magnitude selloff! With the Fed Put in force, the markets didn’t even get close to 10%. Their largest pullback was merely 6.0% over a month or so in June 2013 when Ben Bernanke initially outlined the Fed’s best-case timeline for tapering QE3.
Nearly two years without a real correction to rebalance sentiment in a powerful bull is an extraordinary span of time. To the best of my knowledge, comparable episodes have only been seen historically in rare times when major bull markets are topping. So much greed and euphoria are generated during a long, low-volatility, correction-less span that future stock buying is universally pulled forward killing the bull.
It’s been so long since the last correction that most epically-complacent stock traders have likely forgotten just how nasty and dangerous they are. On the right side of this chart, I noted the SPY levels necessary for 5%, 10%, 15%, and 20% selloffs from its recent peak. Merely falling 10%, a baby correction, would leave SPY near $182. That would take it back to late-2013 levels, totally erasing this entire year’s gains!
But like those wildfires, the longer without a correction the more greed underbrush grows so the bigger the selloff when it eventually arrives. So the odds are very high that the coming major selloff will stretch far beyond 10%, up into the 15% or even 20% range of full-blown corrections. At 15%, SPY would drop near $172 taking it back to levels first seen over a year ago. Imagine the dire psychological impact of that.
Technically once a selloff hits 20%, it formally becomes a bear market. But major corrections often edge right up to this 20% to maximize their greed destruction and fear generation. Since it’s easier to think in terms of 20% instead of the high 19s, a serious correction would hammer SPY all the way back down near $161. These levels were first seen in the spring of 2013, so that would erase most of the Fed’s levitation!
Major corrections are certainly not trivial events that should be haughtily dismissed. They wipe out a fifth of the capital in the entire stock markets, with the higher-flying stocks popular among traders suffering far worse declines! And with each passing day since the end of the last correction, the higher the odds grow that the next one is imminent. The sentiment pendulum can’t swing into greed territory forever.
Greed and fear are of course ethereal, they can’t be directly measured. But overall market psychology can be inferred through a wide variety of indicators. The premier one is the VIX implied-volatility index. It measures speculators’ collective bets on S&P 500 index options over the coming month. The wider the range of bets in price terms, the greater the volatility expected. And high volatility equates to fear.
Provocatively the three biggest pullbacks of the Fed’s SPX levitation saw the VIX spike above 20. So even if you’ve drank the bulls’ Kool-Aid and believe a major selloff isn’t necessary, not even a meaningful pullback is likely to end until the VIX catapults above 20 again. That means this past week’s selloff, even if the Fed’s stock-market levitation magically continues, still hasn’t generated enough fear yet.
As a contrarian investor, I’ve grown rich betting against popular consensus. That’s the only way to buy low and sell high consistently. So I continue to strongly believe that this Fed-driven anomaly in the stock markets is so extreme fundamentally, technically, and sentimentally that only a new cyclical bear can restore normal balance on those fronts. Remember stock markets are forever cyclical, bears always follow bulls.
This next chart zooms out to encompass the entire cyclical bull since March 2009, most of which was totally righteous. The extreme Fed distortions didn’t come until early 2013, late in this bull’s life. I was super-bullish publicly on the record in March 2009 at this bull’s birth, and then again in July 2010 andin October 2011 when stock markets were bottoming after major corrections. Contrarians buy low during fear.

Normal cyclical bull markets start off with rocket-like ascents out of the extreme fear pervasive at the ends of cyclical bears. But then their trajectories slowly taper off into the horizontal parabola rendered above in yellow. Everything was again normal until early 2013, when the Fed started jawboning about not letting the stock markets sell off. The resulting SPX levitation’s decoupling is crystal-clear in this chart.
The first four years of this bull saw normal and healthy corrections periodically to rebalance sentiment. The first one started 13.5 months into this bull, and the second began 9.9 months after the first one ended. They were major full-blown selloffs at 16.1% in SPY terms over 2.3 months in mid-2010, and a near-the-limit 19.4% over 5.2 months in mid-2011. These corrections kept this bull healthy, bleeding off excess greed.
But since the end of that last correction in early October 2011, it has been a jaw-dropping 35.5 months! That’s an astounding three years without sentiment being rebalanced, without the greed-drenched underbrush being burned away! The amount of complacency, greed, euphoria, and hubris that can grow in such a long, unchecked span of rapidly rallying stocks is epic. It is going to fuel a massive selloff.
Even if you’re one of the legions of optimists somehow betting this cyclical bull has years left to run yet, a long-overdue 20% correction will erase most of the Fed’s levitation. If that’s all we are in for and this geriatric bull still has legs, the all-clear signal will be a gigantic VIX spike higher. This definitive fear gauge had to rocket above 45 before each of this bull’s last two corrections ended. We are nowhere close yet.
But the case for a new cyclical bear is far stronger, nearly ironclad after such an outsized bull. This one has seen SPY nearly triple with a staggering 196.3% gain over 66.4 months. This is far beyond the average size and duration of mid-secular-bear cyclical bulls of a doubling in 34.8 months. Stock bulls simply don’t power higher forever, and thanks to the Fed this one’s magnitude and age are truly extreme.
So much rallying for so long has naturally left stock-market valuations extreme too. Today’s stock prices are simply far too high relative to their underlying earnings by all historic standards. As of the end of last month, the trailing-twelve-month price-to-earnings ratios of all S&P 500 stocks averaged a breathtaking 26.0x! This isn’t far from 28x bubble territory, and nearly twice the century-plus 14x fair-value standard.
And in addition to extreme technicals and fundamentals, sentiment is also extreme. Back in early July, the VIX fell to 10.3. It hadn’t been so low since February 2007, heading into the top of the last cyclical bull in October 2007 before the S&P 500 rolled over into a brutal cyclical bear where it ultimately lost 56.8%! But ominously today’s Fed-manipulated sentiment is even more complacent than back then!
The original old-school VIX which only applied to the top fifth of SPX stocks, the S&P 100, now trades as VXO. It remains a superior fear gauge, as it only looks at at-the-money options of the elite S&P 100 instead of the new VIX’s broader range for the entire S&P 500. During major selloffs, the biggest and best SPX stocks are sold fastest since they have the most liquidity and trading volume to absorb the selling.
In early July 2014, that classic old-school VIX now known as the VXO fell to a mindboggling 8.5. This was its lowest level ever seen, an all-time record! That’s saying a lot for an index that’s been calculated back to January 1986, that saw the extreme complacency before the infamous 1987 stock-market crash and during the early-2000 bubble. Fear at an all-time low measured by the VXO is as extreme as you can get!
So with the Fed’s totally artificial levitation forcing the US stock markets’ technicals, fundamentals, and sentiment to crazy extremes, it’s hard not to imagine a new cyclical bear looming. And the losses that would entail ought to terrify today’s hyper-complacent investors. Cyclical bears tend to cut the stock markets in half! 50% losses are devastating beyond belief for investors, especially older ones nearing retirement.
I marked bear-magnitude losses on the chart above. At 30%, SPY would fall near $141. That would take it back to early-2012 levels erasing about half of this entire bull’s gains. At 40%, SPY would drop near $121 which was first seen way back in mid-2010. And at a full-blown 50% cyclical bear, SPY would ultimately bottom near $101 which would slash it to mid-2009 levels eradicating nearly this entire bull’s gains!
Can you stomach that kind of risk today? Best case even if this bull magically continues for years to come as Wall Street is trying to dupe investors into believing, we are in for a massive correction nearing 20% to rebalance sentiment. Worst case, we are looking at a new cyclical bear that is likely to cut stock prices in half over a couple years. With very-high odds for a major selloff, why take the risk of sitting in lofty stocks?
And greatly amplifying this already-suffocating downside risk, the perfect catalyst for a major selloff is here. At last week’s FOMC meeting, the Fed declared in its statement that “the Committee will end its current program of asset purchases at its next meeting.” That means QE3, the inflationary debt-monetization campaign that levitated the stock markets for nearly two years, is scheduled to end on October 29th!
Just a month from now the QE new-buying era ends, leaving the Fed bereft of the ability to convince traders it is backstopping stock markets. Harsh political realities make launching QE4 risky to the Fed’s very existence. The imminent end of QE3 is the best catalyst we’ve seen for sparking a major correction or new bear market since QE3 was launched. The precedent on this is crystal-clear, the ends of both QE1 and QE2.
The first major correction of this cyclical bull in mid-2010 was triggered when QE1’s buying was ending. And the next major correction in mid-2011 eruptedwhen QE2’s buying was ending. These once again were not trivial selloffs, with SPY plunging 16.1% and 19.4%. And the stock markets then were far less risky, overextended, overvalued, and complacent than they are today. QE3’s impending end is truly ominous.
So what should prudent investors do? Sell dangerously-overvalued stocks high and buy dirt-cheap gold low. While stocks are adored thanks to the Fed, gold is loathed. Its price is due to mean revert radically higher as the artificially-levitated stock markets roll over. Gold is a proven performerduring stock bears, having rallied nicely during the last two since 2000. Alternative investments shine when stocks are weak.
You also need to cultivate an essential contrarian perspective on the markets. Cyclical bears unfold gradually over a couple years or so, and Wall Street won’t admit we are in one until it is almost over and catastrophic losses have already been suffered. The only way to protect yourself and your precious capital from Wall Street groupthink is to learn to fight the herd to buy low and sell high like a contrarian.
That’s what we do at Zeal. We’ve spent decades intensely studying and trading the markets so you don’t have to. We publish acclaimed weekly andmonthly newsletters that draw on our hard-won experience, knowledge, wisdom, and ongoing research to explain what’s happening in the markets, why, and how to trade them with specific stocks. Since 2001, all 686 newsletter stock trades have averaged stellar annualized realized gains of +22.6%! Subscribe today before the markets reverse!
The bottom line is stock markets rise and fall. And thanks to the Fed’s gross distortions of psychology, today’s are overextended, overvalued, and epically complacent. That means a major selloff is long overdue to rebalance sentiment. Best case if the bulls are right, it will be a major correction approaching 20% like at the ends of QE1 and QE2. But far more likely is a new cyclical bear ultimately cutting stocks in half.
Naive investors trapped largely unaware in it will suffer catastrophic losses most won’t have time to recover from. But the smart ones will prudently sell high while this long-in-the-tooth stock bull is still topping. Then they can grow their capital through alternative investments while this looming bear runs its course. They will be perfectly positioned to buy low as it ends, and multiply their fortunes in the next bull.
Adam Hamilton, CPA
September 26, 2014
So how can you profit from this information? We publish an acclaimed monthly newsletter, Zeal Intelligence, that details exactly what we are doing in terms of actual stock and options trading based on all the lessons we have learned in our market research. Please consider joining us each month for tactical trading details and more in our premium Zeal Intelligence service at …www.zealllc.com/subscribe.htm
Questions for Adam? I would be more than happy to address them through my private consulting business. Please visit www.zealllc.com/adam.htm for more information.
Thoughts, comments, or flames? Fire away at zelotes@zealllc.com. Due to my staggering and perpetually increasing e-mail load, I regret that I am not able to respond to comments personally. I will read all messages though and really appreciate your feedback!
Copyright 2000 – 2014 Zeal LLC (www.ZealLLC.com)

One of the worst performing groups of stocks on the market is setting up for a huge bounce.
Since late June, energy stocks have slowly retreated. This previously red-hot sector overheated after a furious rally — and has fallen way behind the rest of the market. That’s the number one reason I’ve been avoiding this sector for the past several months.
Don’t believe me? Take a look at the performance of major sectors over the past three months…
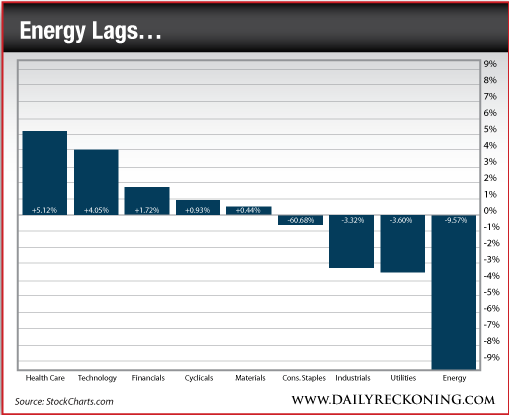
As a group, energy stocks are down nearly 10%. Most investors have left this sector for dead.
However,
I see signs that are pointing toward a significant bounce. If you have the guts to buy these stocks now, you could even have a shot at riding these energy names to new highs by the end of the year…
There are three main reasons I want you to take a shot at energy stocks right now…
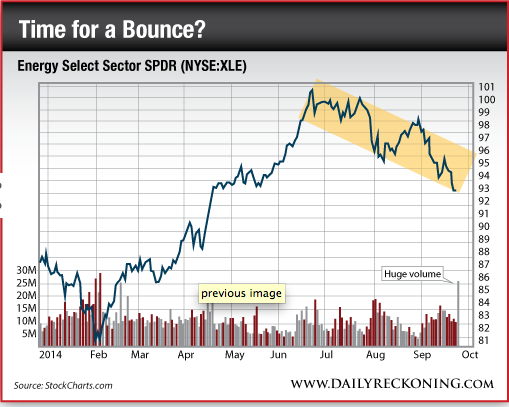
1. Buyers are appearing toward the bottom of XLE’s trading range
Energy names have been drifting lower for three months in an orderly fashion. Yesterday, many of these stocks surged off their lows on heavy volume. That gives you a low-risk entry point right near potential support.
2. XLE looks primed for a big bounce off its long-term moving average
$92 is an important price for XLE. It’s just above its 200-day moving average (not pictured in our chart). It’s also right next to horizontal support that formed back in May when energy names were consolidating for their big run higher in early June.
3. The 3-month round trip gives you a shot at a “reset trade”.
Here’s where your reset trade comes in. That big move back in June that sent energy stocks parabolic? It’s been totally wiped out. 100% of those gains from June are gone and XLE has backed out of nosebleed territory. The shareholder base has turned over. All the momentum players who were trying to book quick gains in June have disappeared and investors who were late to the party have been stopped out.
June’s surge was unsustainable. By the end of the month, most energy stocks were extremely overbought by almost every metric you can imagine. These stocks needed a hard reset — and that’s exactly what they received over the next three months…
Now, you have the perfect low-risk opportunity to buy energy stocks for a potential bounce.
Those damn millennials are up to no good again!
Their music is strange. They won’t look up from their phones. And they’re going to ruin the stock market.
At least, that’s the story we’re hearing these day. But here’s the problem…
The aging baby boomers are still very much in control of the investment world.
“The Baby Boomers are still the ones really driving the bus in the stock market,” Bloomberg reports. “Consider the leadership of the stock market this year: health-care shares are up more than 16 percent for the biggest advance among 10 groups in the Standard & Poor’s 500 Index. Companies that rely on discretionary consumer spending are barely up 1 percent, the worst performance.”
Good point…
It’s also important to note that the bulk of millennials haven’t hit their “investing primes” just yet. In fact, most of them are just now beginning to form households. It will take several years for them to hit their earnings stride and really start to sock away some money in the markets.
For now, the oldies of the baby boom generation are still at the wheel. It’ll be some time before the big shift occurs…
Regards,
Greg Guenthner
for The Daily Reckoning
Greg Guenthner, CMT, is the managing editor of The Rude Awakening. Greg is a member of the Market Technicians Association and holds the Chartered Market Technician designation.

-
I know Mike is a very solid investor and respect his opinions very much. So if he says pay attention to this or that - I will.
~ Dale G.
-
I've started managing my own investments so view Michael's site as a one-stop shop from which to get information and perspectives.
~ Dave E.
-
Michael offers easy reading, honest, common sense information that anyone can use in a practical manner.
~ der_al.
-
A sane voice in a scrambled investment world.
~ Ed R.
Inside Edge Pro Contributors

Greg Weldon

Josef Schachter

Tyler Bollhorn

Ryan Irvine

Paul Beattie

Martin Straith

Patrick Ceresna

Mark Leibovit

James Thorne

Victor Adair