
Energy & Commodities
Now that oil has made a lower intermediate low warning bells are ringing that the commodity complex has more than likely begun the move down into its three-year cycle low. That bottom isn’t due until May or June of next year at the earliest.
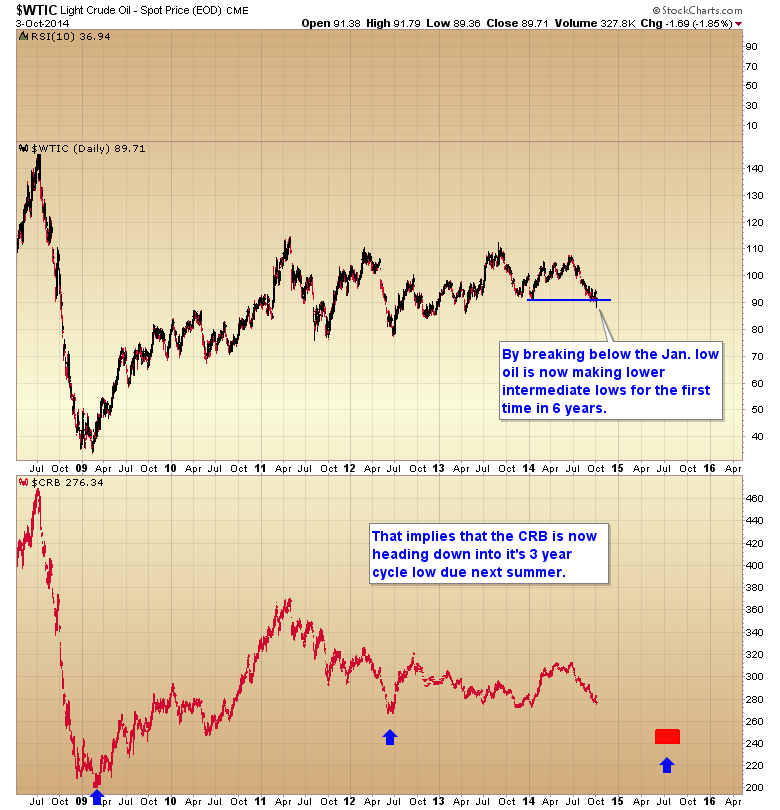
With the larger three year cycle forces now in control, and the commodity complex in decline, intermediate cycle lows (ICL’s) will tend to be exceptionally vicious affairs. We are already seeing this play out in the gold market as it tests (and will probably break below) the $1180 support zone sometime next week. Silver and platinum have already broken below their summer 2013 lows, and it should only be a matter of time before gold follows. This is going to cause a major panic in the gold bug community, and that is to be expected during ICL’s with the CRB now in the grip of its three-year cycle decline.
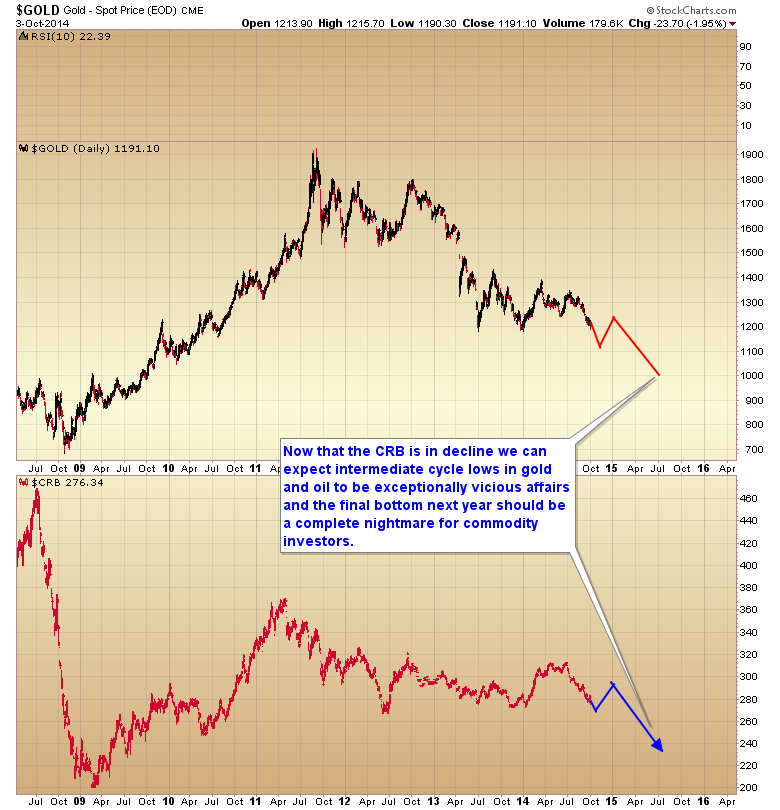
Now before one gets too bearish and starts to short the commodity complex willy-nilly, remember that we are close to an intermediate cycle low here and we’re going to get a convincing countertrend rally soon. Just understand that the rally is almost certainly going to fail to make new highs and will ultimately roll over and move down into the three-year cycle low next summer. And as scary and frustrating as the current intermediate decline is, the upcoming decline next summer is going to be a nightmare of catastrophic proportions for commodity investors. As I have been suggesting for months now I think traders need to focus mainly on the stock market for the next 8-12 months and let the commodity sector finish the move down into its three-year cycle low.
During this period, as commodity prices trend generally lower, a tailwind for the economy will be created as living expenses will decrease giving consumers more money for discretionary spending. Input costs for businesses will decline causing profit margins to expand. All in all, I think this could create the environment for stocks to deliver a final parabolic blow-off top at roughly the same time that the CRB hits its three-year cycle low.
Now for the silver lining. At bear market bottoms, which we are going to get in the commodity and gold markets sometime next summer, valuations will reach levels that have no basis in reality. They will be purely driven by irrational fear. For those that can bide their time, wait patiently, and get to a bear market bottom with their cash intact, this is where real opportunities are created.
I believe at the next major multiyear cycle bottom next summer, we are going to see an opportunity in the commodity complex, especially in precious metal mining stocks, that only comes around once every 40 or 50 years. This is the spot where millionaires and billionaires will be created for those with the ability to buy at that bottom.

I suggest resource investors curb their animal spirits for now, and focus on the stock market. Our time will come. We just need to make sure we get to the bottom with our capital intact.
For more in-depth analysis of how these larger cycles are likely to unfold, consider a subscription to the nightly SMT newsletter.

 Alan Greenspan, former Chairman of the Fed, had an article entitled “Golden Rule – Why Beijing Is Buying” published in Foreign Policy, the journal of the influential Council on Foreign Relations in which he extols the virtues of gold as “universally acceptable.”
Greenspan, former Chairman of the Federal Reserve Board of the United States from 1987 to 2006, and a key architect in the global financial crisis, points out that if the world’s largest gold consumer, China, used a portion of its massive $4 trillion foreign exchange reserves to buy enough gold bullion it could displace the U.S. as the world’s largest holder of gold bullion. The U.S. holdings are believed to be just over 8,500 tonnes with an estimated value of just $328 billion as of spring 2014.
….related: Currency Wars ! Russia, Kazakhstan Buy Very Large 30 Tons Of Gold In August

VIX Voodoo Analysis
The Volatility Index (VIX) seems to be indicating something big is brewing. Let’s investigate taking a bottom up approach beginning with the daily chart.
VIX Daily Chart

Since the low back in July 2014, price has developed a pattern of higher highs and higher lows – a bull trend. The Stochastic and Moving Average Convergence Divergence (MACD) indicators have just turned bearish so perhaps price is now headed down to put in yet another higher low. Where is this next low likely to be?
I have drawn a green highlighted circle which shows a gap. The high of the gap is 13.13 while the low of the gap is 12.61. I expect this gap to be filled before any continuation of the uptrend.
I have added a Fibonacci Fan from the low to recent high. Price looks to show some nice symmetry with this fan. Looking retroactively we can see price has found support a couple of times at the 76.4% angle. Perhaps price is headed back down for another test of the angle support.
I have added Fibonacci retracement levels of the move from low to recent high. The 76.4% fan angle is just above the 76.4 retracement level at 12.08. This is where I’m looking for price to make its higher low and can be seen in the orange highlighted circle.
VIX Weekly Chart

The Bollinger Bands show price bobbing up and down between the upper and middle bands over the last couple of months. Price looks headed back down now and perhaps the middle band will provide support once again. Let’s see.
The Parabolic Stop and Reverse (PSAR) indicator shows a bullish bias after price busted the dots to the upside last week. These dots will be support for any move down now and if this support holds then it can act as a springboard for price to surge higher. The dots are just below the previous low of 11.52.
The MACD indicator shows a recent bullish crossover and this is coming on top of a quadruple bullish divergence. Something big looks set to take place here shortly.
VIX Monthly Chart

If a quadruple bullish divergence on the weekly chart wasn’t enough, how about on the monthly chart?! Both the Relative Strength Indicator (RSI) and MACD indicator are showing quadruple bearish divergences. The MACD is also bullish so conditions are certainly ripe for an explosion higher.
The PSAR resistance held price in its attempt already this month to crack higher. Price looks headed down now but perhaps if price can turn back up this month it will be successful on its second attempt.
As for where price may come back to, I favour price consolidating the September candle. The open price for September was 12.32 and I suspect price can trade back to that level.
Let’s now zoom out for some big picture perspective with the yearly chart.
VIX Yearly Chart

I have added some simple Elliott Wave annotations which show the spike high in 2008 as the end of wave 1. That seems hard to believe but taking out the emotion that was the first major top after the all time low.
Price now looks like it is setting up a higher low which would be the end of wave 2. That implies wave 3 has already begun which should see price explode higher above the all time high of 96.40. I know this seems far-fetched but could it really be possible?
The RSI looks to be building strength with a pattern of higher highs and higher lows.
Momentum also appears to be building and it will be interesting to see if it takes out its own 2008 high. One possibility is price makes a new high while momentum does not. Time will tell.
This VIX analysis suggests something terrible and devastating is likely to happen to the stock market. Bears would be licking their lips.
Let’s quickly look at the yearly chart of the Dow to see if this VIX analysis fits with its long term picture.
Dow Yearly Chart

This yearly chart begins in 1900.
The RSI looks set to show a triple bearish divergence on this top.
The Stochastic indicator looks like it is having one last hurrah in overbought territory.
The MACD indicator shows the averages have diverged wildly which looks in need of some “regression to the mean”.
Momentum looks to have fallen off a cliff.
Hmmm. I don’t really think I need to comment further.

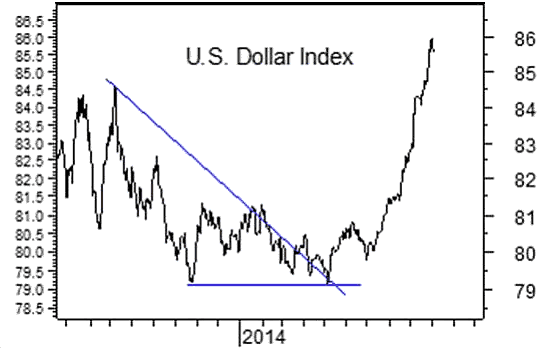
The dollar is on a tear. And the world is scrambling to figure out what it means.
Beginning with the always-interesting Martin Armstrong in a recent Financial Sense interview:
“I know a lot of people that hate the dollar, but you have to understand the dollar is really only the game in town. Yes, we have a big debt but that debt is absorbed by central banks just having to hold reserves. They’re holding it in U.S. government debt. You can’t hold debt of Greece. Debt of Germany just went negative…France is in trouble as well as Spain and Italy…
You go to New York and it’s all foreigners buying the top-end real estate; same thing in Florida. China is the number one buyer of the highest priced real estate in the U.S. Canada is the number one buyer of real estate as far as the number of properties…
So, this is the trend as war develops more in the Middle East and also in Europe and Asia. Capital has no place to go but the United States and this is going to push the U.S. dollar up higher…”
Another positive take comes from Monty Guild, also on Financial Sense:
Investors, Pay Attention: Causes and Implications of U.S. Dollar Strength
A rising U.S. Dollar has benefits, including higher demand for U.S. Treasuries, lower borrowing costs for the Federal government, foreign demand for U.S. assets (including stocks), lower commodity prices, and especially lower oil prices, which will hurt Russia and benefit the U.S consumer by lowering the cost of gasoline.
Overall, until any negative effects begin to manifest, a stronger Dollar suggests money will continue to be attracted to the U.S. stock market, especially stocks whose sales are primarily domestic, and not international, and particularly for large-cap stocks. This has already begun; larger companies have been outperforming small- and mid-cap companies since early summer. Investors should focus on large U.S. companies that do not get a major share of their profits from abroad. Stocks of companies that sell globally will see their foreign earnings somewhat diminished by a lower value of their foreign currency sales in U.S. dollar terms.
Caroline Valetkevitch at Reuters takes the other side, pointing out that some of those negative effects are already manifesting:
Surging dollar may be triple whammy for U.S. earnings
The suddenly unstoppable U.S. dollar is posing a triple threat to American companies’ profits: driving up the costs of doing business overseas, suppressing the value of non-U.S. sales and, perhaps most worryingly, signaling weak international demand.
The dollar has been on a tear, with an index tracking it against six other major currencies notching roughly an 8 percent gain since the end of June. Few analysts see its breakout performance stalling out anytime soon since the U.S. economy stands on much firmer footing than most others around the world, Europe’s in particular.
For companies in the benchmark S&P 500, that’s a big headwind because so many are multinationals, and as a group they derive almost half of their revenue from international markets.
“You will get some companies that have failed to meet expectations based on the weakness we’re seeing overseas, so it is going to be a source of disappointment,” said Carmine Grigoli, chief investment strategist at Mizuho Securities in New York. Moreover, that weakness, especially in Europe, “is going to be critical here,” he said. “It’s an important component of (U.S.) earnings going forward.”
And while investors and analysts have begun to figure in the negative effects of a fast-strengthening dollar with regard to the approaching third-quarter reporting period, the risk to the fourth quarter and 2015 remains largely unaccounted for.
For instance, third-quarter profit-growth expectations for S&P 500 companies have fallen back to 6.4 percent from about 11 percent two months ago, Thomson Reuters data showed. By contrast, the fourth-quarter growth forecast is down just slightly, to 11.1 percent from a July 1 forecast of 12.0 percent. And profit-growth estimates for 2015 have actually increased in that time from 11.5 percent to 12.4 percent.
“If you try and extrapolate out to the fourth quarter and how much that currency effect is going to be, your guidance is probably going to come down for a good slug of the multinationals on the S&P,” said Art Hogan, chief market strategist at Wunderlich Securities in New York.
WARNING FROM FORD
Ford Motor Co.’s disappointing forecast this week may be a hint of what’s to come. The No. 2 U.S. automaker cut its forecasts for pretax profit this year, citing steeper losses in Russia and South America. “Not to extrapolate too broadly from one company, but I think the negative sentiment . . .has been pretty dramatic,” said Michael James, managing director of equity trading at Wedbush Securities in Los Angeles. Ford shares lost 10.7 percent last week.
The onslaught of quarterly results begins soon, and the next two weeks bring reports from U.S. companies with some of the highest levels of overseas sales. Among them, fast-food restaurant operator Yum Brands, which derives roughly 77 percent of its sales overseas, is due to report on Tuesday, while results from chipmaker Intel, with about 83 percent of its sales coming from overseas, are due on Oct. 14.
Finally, Automatic Earth’s Raúl Ilargi Meijer goes downright apocalyptic in his recent The US Dollar Is About To Inflict Carnage All Around The Planet, where he quotes some representative reports:
“The weakening yen is starting to squeeze Japanese consumers as prices rise for everything from Burgundy wine to instant noodles, threatening Prime Minister Shinzo Abe’s plans to revive the country’s economy. The currency slid to 110 yen to the dollar yesterday, the lowest level in six years, making imported goods and materials more expensive. Though inflation is one of Abe’s monetary goals, the yen’s sharp slide undermines steps to boost consumer spending and endangers public backing for his economic program…. Japan’s GDP shrank an annualized 7.1% in the April-to-June period, the most since the first quarter of 2009.”
“The yen’s slide to a six-year low is amplifying a rout in emerging-market stocks as investors shift their focus to Japanese companies with earnings in dollars, according to Morgan Stanley. The MSCI Emerging Market Index tumbled 7.6% in September, the most since May 2012, led by China and Hong Kong. That compares with a 3.8% drop for the Topix Index in the period. The yen depreciated 5.1% versus the dollar to the weakest level since August 2008 last month, while a gauge tracking developing-nation currencies retreated 3.8%.
Net inflows to U.S. exchange-traded funds that invest in emerging-markets tumbled 82% to $977.9 million in September, led by a 90% decline to China and Hong Kong, data compiled by Bloomberg show.”
“After ticking just above 110.00, USDJPY has been a one-way street lower and that means only one thing… Japanese stocks are cratering. From Friday’s highs, The Nikkei 225 has crashed over 1000 points (despite Abe’s promises yet again of more pension reform buying of stocks). Of note, perhaps, is that, Japanese investors bought a net $3.6 billion of foreign stocks last week – the most since January 2009 – perfectly top-ticking global equities… Well played Mrs. Watanabe.”
“Inflation expectations in the US have just followed the eurozone by plunging lower. Until very recently, the Fed and the ECB had been quite successful at keeping inflation expectations in their normal range – this despite their clear failure to control actual inflation itself, which has consistently undershot expectations. Investors are beginning to realise that contrary to their confident actions and assurances, the Fed and the ECB have failed to prevent a dreaded replay of Japan’s deflationary template a decade earlier in the West.”
Meijer’s conclusion: “It’s going to be carnage out there.”
Some thoughts
Wow. If the world wasn’t already interesting enough, a soaring reserve currency definitely adds some spice.
There are clearly benefits to a strong currency. And in recent years a lot of very smart people have made favorable foreign exchange trends a centerpiece of their analysis, generally citing a strong currency as an investment positive. But there seems to be a missing piece to that scenario, which is debt.
True, other things being equal a strong currency is a sign of (relative) confidence and generally a good thing for a country that has its financial house in order. Appreciating money makes its citizens’ savings more valuable and its corporations better able to snap up cheap acquisitions abroad. On balance, the strong currency society gets richer.
But for an over-indebted country, where local savings are dwarfed by local debt, a strong currency makes the debt burden even heavier, so the net effect is negative. For a real-world test of this thesis, simply look at who had the last batch of strong currencies. Between 2009 and 2013 that would be Japan and Europe, which are now tipping into recessions that threaten to become something much worse.
Which is why the dollar is soaring. Europe and Japan — along with nearly-as-over-indebted China — need weaker currencies not to thrive, but survive. US policymakers, while recognizing the downsides of a soaring dollar, no doubt see taking one for the team (i.e., the global economy) as better than a list of alternatives that includes widespread Depression.
Now the question is whether the strong dollar will do to the US what the strong yen and euro did to Japan and Europe. That is, will America in 2015 be an island of stability in a sea of chaos or will it be a yet another deflationary basket case?

With the summer near end and the kids back in the classroom (unless you’re in BC) investors are looking to the latter four months of the year to see how 2014 will shape up. The TSX has enjoyed solid returns year-to-date, up over 14% since the start of the year, which is the best performance we have seen from the index since 2009. When we remove 2009 from the equation, which had the significant advantage of picking of the pieces of a 35% decline in the previous year, we would have to go all the way back to 2005 to find an 8 month period from January to September that was as astoundingly profitable for investors.
But right now, there is a bit of a debate surrounding the markets about whether or not they are primed for a correction. Many expected to see a full force correction in the summer but to their surprise, the market largely chugged forward. With the summer now beyond us, look to the fall for a possible pullback.
There is also some discussion that September and October are notably poor months for the market. There is even a theory called the “October Effect” which states that stocks tend to decline in the month of October. At KeyStone, we always urge investors to look at the markets from a long-term perspective and warn against employing seasonal strategies. But from a purely informational perspective, it is always a little fun to go back through time and size these proclamations up against actual statistical evidence.
The table below provides month’s percentage price returns for September and October over a 10 year period from 2004 to 2013.

What this data tells us is that from a historical perspective (at least over the last 10 years), the months of September and October actually produce good returns, with both months ending positive in 7 out of 10 years. Now this isn’t to say that history will repeat itself in 2014. We have enjoyed very solid returns through the summer in absence of strong economic data which would indicate that the market may be poised for a healthy correction. But the next time you hear someone talk about September and October being bad times to be in the market or the “October Effect,” you will know that the proclamations are not backed up by the data.
KeyStone’s Latest Reports Section


-
I know Mike is a very solid investor and respect his opinions very much. So if he says pay attention to this or that - I will.
~ Dale G.
-
I've started managing my own investments so view Michael's site as a one-stop shop from which to get information and perspectives.
~ Dave E.
-
Michael offers easy reading, honest, common sense information that anyone can use in a practical manner.
~ der_al.
-
A sane voice in a scrambled investment world.
~ Ed R.
Inside Edge Pro Contributors

Greg Weldon

Josef Schachter

Tyler Bollhorn

Ryan Irvine

Paul Beattie

Martin Straith

Patrick Ceresna

Mark Leibovit

James Thorne

Victor Adair