
Timing & trends
“The world is a mess right now, geopolitical trouble brewing all over the place, and now we see the Ebola virus threatening to become a worldwide pandemic. Hong Kong, Ukraine, ISIS, Libya, Gaza, Irannukes, North Korea, Secret Service, for starters. This is what happens during major Bear Markets, which is what we now have, Grand Supercy-cle degree wave {IV}down. This is because we are measuring the collective psyche of mankind with technical analysis, which is now telling us we are entering a period of se-vere strife. It is going to get a lot worse.
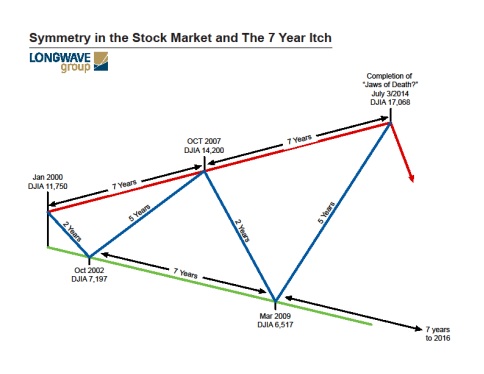
Those patterns look to have topped on September 19th, 2014. That looks to be the top for the multi-decade Jaws of Death pat-tern that started in 1987, and looks to be the top for Grand Super cycle degree wave {III}, which was centuries in the making.”
In his book, “The Coming Economic Ice Age” Dr. Robert McHugh warns readers that we are nearing a very major decline in equities given the massive “megaphone” formation that is taking shape in the Dow and many other major indexes around the world. In the book he shows that the same formation was present before other major equity market declines such as 1929, 1957, 1966, 1973, 1987, 2000 and 2008. In fact all major declines since the 1930s have had a widening megaphone which McHugh labels “The Jaws of Death.”
…..continue reading HERE

Wednesday, October 8, 2014, looked like another bash down of the already battered precious metals sector, before a dramatic price reversal on massive record volume. Is it “the bottom”? Well, a price reversal on record volume is certainly what a “bottom” is supposed to look like from a technical standpoint. Not only that – but gold has now constructed a bullish “triple bottom” reversal pattern, by printing three sequentially “higher lows”.

Larger Image (Click Twice)
Of course, there is much work to be done by gold bugs, who must now manage to reverse the trend of lower
highs to higher highs, by first taking out the $1,346.80 level. But a potential reversal pattern, 16 months in the making, will have to do for now.
In the meantime, the much despised and ridiculed (by some) junior miners, as represented by GDXJ, also reversed yesterday on massive record volume. GDXJ continues to outperform gold & silver on a relative basis, and is still in the process of constructing a bullish reversal pattern in the form of a rather mangled, but still intact inverted head and shoulders formation.

Larger Image (Click Twice)
From a fundamental standpoint, we have now come to a point where it is less expensive for silver miners and some gold producers to buy their metal on the open market rather than mine it! Only in precious metals, and especially silver, could such a circumstance exist, where the earth is still flat, pigs fly, mining executives put their shareholders first, and your government loves you!
Ruben Varela, Jr. is an independent trader specializing in the precious metals sector. Email: rtvarela@yahoo.com.


Today’s videos:
Russell Index Leads Dow Wipeout Charts Analysis
Gold First The Drop And Now The Pop Charts Analysis
Silver Fuel Cells Accumulation Charts Analysis
GDX Support & Resistance Charts Analysis
GDXJ Fuel Cell Volume Charts Analysis
Thanks,
Thanks,
Morris
Super Force Precious Metals Video Analysis
posted Oct 10, 2014
“Our main format is now video analysis…”‘
Oct 10, 2014 Super Force Signals special offer for Money Talks Readers:
Send an email to trading@superforcesignals.com and I’ll send you 3 of my next Super Force Surge Signals free of charge, as I send them to paid subscribers. Thank you!
The SuperForce Proprietary SURGE index SIGNALS:
25 Surge Index Buy or 25 Surge Index Sell: Solid Power.
50 Surge Index Buy or 50 Surge Index Sell: Stronger Power.
75 Surge Index Buy or 75 Surge Index Sell: Maximum Power.
100 Surge Index Buy or 100 Surge Index Sell: “Over The Top” Power.
Stay alert for our surge signals, sent by email to subscribers, for both the daily charts on Super Force Signals at www.superforcesignals.com and for the 60 minute charts atwww.superforce60.com
About Super Force Signals:
Our Surge Index Signals are created thru our proprietary blend of the highest quality technical analysis and many years of successful business building. We are two business owners with excellent synergy. We understand risk and reward. Our subscribers are generally successfully business owners, people like yourself with speculative funds, looking for serious management of your risk and reward in the market.
Frank Johnson: Executive Editor, Macro Risk Manager.
Morris Hubbartt: Chief Market Analyst, Trading Risk Specialist.
website: www.superforcesignals.com
email: trading@superforcesignals.com
email: trading@superforce60.com
SFS Web Services
1170 Bay Street, Suite #143
Toronto, Ontario, M5S 2B4
Canada
The US dollar has relentlessly blasted higher in recent months, achieving its longest consecutive-week rally in history. Speculators have flooded into the world’s reserve currency for a variety of reasons, ranging from Federal Reserve rate-hike hopes to festering Eurozone worries. But the resulting massive dollar surge has left it super-overbought while breeding universal bullishness, the precursors to a sharp selloff.
While only a small fraction of traders speculate in currencies, the foreign-exchange market is the largest in the world by far. Trillions of dollars change hands in currency trades every day, dwarfing all the other markets! And currency prices, particularly the fortunes of the dominant US dollar, can greatly affect everything else in the financial-market and economic realms. No one can afford to ignore the US dollar.
When the dollar is strong, the rest of the world’s currencies as well as popular commodities including oil and gold are forced lower. Higher dollar prices also retard US exports, making goods produced here more expensive for foreign customers. This cuts into corporate profits, which in turn adversely impacts stock prices. But a strong dollar also reduces import costs, giving Americans more purchasing power.
And of course the opposite is true when the US dollar weakens. Other currencies and commodities rise, US exports grow, and importing gets more expensive for consumers and corporations alike. The dollar’s impact is truly universal, so investors and speculators must pay attention to it. Particularly in times like today witnessing extraordinary moves, where the dollar’s influence on global markets waxes large.
The most popular way to track the US dollar’s price levels is through the venerable US Dollar Index. The USDX was born an impressive 41 years ago in March 1973, and measures the dollar against a basket of 6 leading world currencies. This flagship index is dominated by the euro, which accounts for 57.6% of its weight. This is followed by the Japanese yen and British pound sterling at 13.6% and 11.9%.
The US Dollar Index was initially set at 100.0 all those decades ago. And today stock traders can gain direct USDX exposure through the PowerShares DB US Dollar Index Bullish Fund USDX ETF which trades as UUP. And given the euro’s heavy weighting, the USDX is effectively the anti-euro. So stock traders can bet against the dollar with the leading CurrencyShares Euro Trust euro ETF which trades as FXE.
The mighty currency markets often slumber, and the USDX listlessly ground sideways for two-and-a-half years leading into mid-2014. But starting in early July, the US dollar began climbing. The initial catalyst was the European Central Bank, which currently holds policy meetings on the first Thursday of every month. On July 3rd, the ECB did nothing to combat the super-low inflation plaguing the Eurozone.
So the euro dropped, which naturally pushed up the US Dollar Index with its heavy euro weighting. And after that triggering event, the dollar buying persisted for various reasons. First the US stock markets started to top and then drop, leading to dollar safe-haven buying. Then upside momentum built on hopes the Fed would end its zero-interest-rate policy sooner rather than later, raising the dollar’s effective yield.
Generally the higher prevailing interest rates are, the more attractive a currency becomes in the eyes of foreign investors. This dynamic led the euro to plunge in early September after another ECB meeting where it surprised by slashing its main interest rate to effectively zero. So the zero-yielding euro was sold aggressively by futures traders while the zero-yielding-but-not-forever US dollar was snatched up.
With the US dollar soaring, euphoria started setting in which seduced in even more capital. Wall Street has long loved a strong dollar, led by perma-bulls like Larry Kudlow nearly worshipping it as “King Dollar”. They believe that a rising dollar attracts foreign investment into US financial markets, which is certainly true to an extent. This deeply-held bias left Wall Street eager to jump on to the strong-dollar bandwagon.
As a result, the US Dollar Index blasted 9.5% higher in the 4.9 months between early May and early October. While this was far from the dollar’s largest rally in history, it happened to be the first time the USDX has ever rallied for 12 consecutive weeks! If you look at a one-year dollar chart, the recent surge looks parabolic. This anomalous rally has wreaked havoc on commodities including oil and gold.
Since commodities are globally priced in dollar terms, the higher the dollar travels the fewer of them it takes to buy a base unit of commodities. So American futures speculators, particularly in the oil and gold markets, closely watch the USDX for trading cues. The great majority of the sharp recent weakness in oil and gold was the result of heavy futures selling by speculators in response to the dollar’s big gains.
But the mighty US dollar has moved up too far too fast, it is super-overbought. Such anomalously sharp rallies quickly ramp greed and euphoria, which soon burn themselves out. Exciting widely-watched jumps to major highs suck in all willing and available capital, pulling future buying forward. That leaves nothing but sellers, resulting in sharp corrections that usually completely unwind the preceding fast rallies.
This first chart reveals that critical dollar-trading symmetry, fast moves up are nearly always followed by fast moves down. And the recent sharp dollar surge looks big even in longer-term context. The USDX just catapulted up toa 51.8-month high, levels not seen since soon after 2008’s once-in-a-lifetime stock panic. Incidentally that crazy event sparked the biggest and fastest USDX rally ever witnessed, on safe-haven buying.

When stock markets start falling fast, like during that crazy stock panic, cash truly is king. Sellers rush to park capital in US dollars and short-term US Treasuries, leading to serious dollar spikes. In the second half of 2008 the USDX skyrocketed an astounding 22.6% higher in 4.2 months, its largest rally ever by far. The US dollar has a strong inverse correlation to the US stock markets, especially in times of turmoil.
But it’s critical to understand the strategic context. The mighty US dollar, despite Wall Street’s perpetual calls for a new bull, has been mired in a secular bear since July 2001 when the USDX crested at 120.9. As usual at major tops, bullishness was astounding. I was one of a very small handful of contrarian traders calling for a new dollar bear back in the summer of 2001when most believed the dollar would rally indefinitely.
Between that euphoric secular-bull peak and April 2008, the USDX had dropped a breathtaking 41.0% to an all-time low of 71.4! Strong dollar my foot, that notion is a total fallacy. The US dollar was very low and oversold heading into 2008’s bond panic closely followed by that notorious stock panic. There wasn’t exactly universal dollar bearishness then since Wall Street loves it, but there was great euro bullishness.
Major new lows coupled with negative sentiment creates the ideal cauldron for brewing major uplegs, so the bullish USDX setup heading into the stock panic couldn’t have been better. And that stock panic, the first one since 1907, sparked the greatest fear superstorm we’re likely to see in our lifetimes which led to extremely anomalous safe-haven US dollar buying. That’s why that USDX rally was its biggest ever.
Yet even in those perfect dollar conditions, that huge USDX rally collapsed near 88 which was still quite low in the context of the dollar’s secular bear. The catalyst was the US stock markets bottoming and bouncing sharply in November 2008, reversing the safe-haven capital flows back out of the US dollar. The USDX plunged dramatically after that, and didn’t reverse higher until the stock markets dropped lower again.
The USDX again soared in early 2009 as the stock markets weakened in dread of the horrendous new taxation and regulatory burdens the new Obama Administration was talking about saddling Americans with. Again the USDX peaked right when the US stock markets bottomed. And again the USDX started to plunge right after that sharp rally. In March 2009, it suffered its largest down day in history thanks to the Fed.
While the Fed’s first quantitative-easing campaign of creating new dollars out of thin air to monetize bonds had been underway for months, it was formally expanded at the FOMC’s March 2009 meeting. The USDX plummeted 2.9% that day! FOMC meetings and their subsequent minutes have long been major catalysts for sharp US dollar moves, so this week’s FOMC-minutes-driven dollar drop shouldn’t have surprised anyone.
The USDX again took off in early 2010, rocketing higher in the lower end of its secular-bear trading range. Once again the primary catalysts were sharp US-stock-market selloffs, along with growing fears of the Eurozone fracturing as profligate Greece received its first bailout. That led to heavy euro shorting by futures traders, boosting the US dollar since they are merely opposite sides of the same currency coin.
But again after that sharp and massive US dollar upleg peaked in mid-2010, the USDX didn’t stabilize but it fell sharply. That same phenomenon happened again at a smaller scale in both mid-2012 and mid-2013. The moral of the story is impressive USDX surges haven’t marked the births of new secular bulls as Wall Street perpetually hopes, but simply bear-market rallies with no fundamental foundation.
How can the dollar’s fundamentals ever improve until the Fed fully unwinds its quantitative-easing bonds bought, and fully normalizes interest rates? Why should foreign investors want to own a currency that a central bank is rapidly inflating while artificially forcing its yield to zero? It is hard to imagine this secular dollar bear ending before pre-2008 normalcy returns to the Fed’s balance sheet and interest rates.
In the first 8 months of 2008 before the stock panic, the Fed’s balance sheet averaged $875b. Today thanks to quantitative easing, it is a staggering $4408b. The Fed doesn’t just need to stop new bond buying, but to sell the mind-boggling $3.5t of bonds it monetized since late 2008! And in the quarter-century between the early-1980s rate spike and 2008’s stock panic, the benchmark federal-funds rate averaged 5.3%.
Fundamentals can’t support a new secular dollar bull with trillions of new dollars of supply and this currency trapped in the Fed’s zero-interest-rate-policy environment. Global demand just isn’t sufficient to absorb this deluge of inflation. And heading into the stock panic, central banks around the world were actively diversifying out of the US dollar thanks to its terrible performance for the better part of a decade.
Thus I strongly suspect that the recent sharp USDX rally that has generated such excitement will collapse just as fast and hard as the rest of the post-stock-panic QE-era US dollar rallies. And that has huge bullish implications for the battered euro and commodities, particularly gold. And this may have begun with this week’s FOMC minutes, as the euphoric USDX was already super-overbought heading into them.
Overboughtness arises when prices move too far too fast. One way to measure this is to look at a price relative to its 200-day moving average. Many years ago I developed a trading methodology based on this calledRelativity Trading. It divides a price by its 200dma, yielding a multiple that tends to form a horizontal trading range over time. And the USDX is super-overbought by this standard over recent years.

The USDX has generally traded between 0.93x its 200dma on the low side to 1.05x on the high side since the stock panic, support and resistance. While the epic stock-panic safe-haven rally and its echo in 2010 on stock-market selling pushed the USDX way above those relative multiples, those were extreme anomalies. Ever since 2011, the USDX has generally peaked once it gets around 5% above its 200dma.
Just last Friday, the USDX blasted 1.2% higher on that blowout upside surprise on the US’s September jobs report. Currency speculators figured that raised the odds the Fed would hike rates sooner rather than later, and higher yields should make the USDX more attractive. That pushed the USDX to 86.7, a 52-month high, and propelled the relative USDX multiple to 1.07x which was also the highest since mid-2010.
Major currencies usually move gradually, sharp moves are uncommon in these gargantuan markets since they have supertanker-like inertia. So to see the US Dollar Index a whopping 7% above its own 200dma in the absence of usual drivers like a sharp stock-market selloff was ominous. This currency had risen too far too fast, and Wall Street was getting euphoric on it as evidenced by many CNBC interviews.
There was major downside risk because any economic data or stock-market weakness that started to be perceived as staying the Fed’s hand on rate hikes could lead to fast selling of the crowded dollar long positions. Not to mention fast covering of the extreme euro and yen futures shorts, which would also hammer the dollar. And that’s what happened this week, the overbought dollar started collapsing fast.
When the minutes from the September FOMC meeting came out Wednesday and were uber-dovish, the USDX fell hard. The FOMC members were worried about slowing worldwide economic growth, and the strong dollar itself hurting US exports. Traders interpreted this as the FOMC being very reluctant to hike interest rates too soon. I had warned our Zeal Speculator subscribers about this the day before, writing…
“Much of the bullish psychology that is behind the dollar’s near-parabolic surge hinges on the belief the Fed will start hiking rates soon. What if that thesis starts to fade due to weaker economic data and weaker US stock markets? The downside risks to the euphoric dollar are just huge if anything looks to delay rate hikes at all. And futures speculators will rush to buy gold as the dollar rolls over.” And so it was.
The core message traders extracted from those FOMC minutes on rates waslower for longer. And the longer the Fed’s ZIRP policy stays in force, and the slower the pace of rate hikes to normalize interest rates afterwards, the longer the US dollar’s secular bear will persist. Against this backdrop, odds are the super-overbought US Dollar Index will plunge fast as the momentum traders on the bullish side quickly abandon it.
And a weaker dollar will directly boost the euro and other currencies, and also oil and gold. Gold in particular has exceptional upside potential as the US dollar retreats. Futures speculators used the strong dollar as an excuse to recently catapult their highly-leveraged short-side bets on gold to their third-highest levels of its secular bull if not ever. Their heavy shorting will be unwound fast as the dollar falls.
In addition the wildly-overextended and dangerously-overvalued US stock markets are long overdue to decisively roll over into a major selloff. As the stock markets weaken, the Fed will be far less likely to hike rates since higher rates really weigh on stock prices. That will ensure ZIRP lasts for longer than the dollar bulls anticipated, which will extend this currency’s longstanding Fed-driven secular bear market.
One of the hallmarks of our hardcore contrarian trading approach at Zeal is we constantly watch the global financial markets as a whole, and always consider their interrelationships. You can’t trade stocks or commodities successfully without watching the currency markets, which greatly affect them from time to time. So considering the US dollar’s most-likely near-term direction is essential for timing other trades.
You can reap the profitable fruits of our decades of market studies and trading through our acclaimed weekly and monthly newsletters. They draw on our hard-won experience, knowledge, wisdom, and ongoing research to explain what’s going on in the markets, why, and how to trade them with specific stocks. They will help you cultivate that rare contrarian perspective essential to thrive. Subscribe today!
The bottom line is the US dollar is super-overbought. Wall Street has always had a perpetually-bullish bias on the dollar, so mainstream traders were eager to pile on as it rallied sharply in recent months. A combination of ECB decisions hitting the euro, US stock-market selloffs, and hopes of the Fed starting to hike rates sooner rather than later catapulted the US Dollar Index up for a record 12 weeks in a row.
But such sharp dollar rallies to overbought levels, especially within the dollar’s secular bear when its supply-and-demand fundamentals remain very negative, soon crumble. The dollar falls as fast and far as it rose, reversing all the peripheral trades that suffered during the dollar’s rally. So sell the US dollar high when everyone loves it, and buy euros, yen, oil, and gold while they are still low before they rebound.
Adam Hamilton, CPA
October 10, 2014
Please consider joining us each month for tactical trading details and more in our premium Zeal Intelligence service at …www.zealllc.com/subscribe.htm
Copyright 2000 – 2014 Zeal LLC (www.ZealLLC.com)

fortune by speculation and kept it.” – Andrew Carnegie
The stock market decided to get a whole lot more interesting this week. On Thursday, the S&P 500 fell 2.09% for its worst day in six months. This was surprising, considering how calm the markets had been. Earlier this year, there was a three-month stretch when the index never had a 1% day. Now it’s happened four times in the last five days.
During Thursday’s trading, the Volatility Index spiked to over 19. Just a few days ago, it was less than 12. In the last few issues, I’ve talked about the distorting impact that the strong dollar has had on the markets. Now we’re seeing some of the negative fallout. On Thursday, the S&P 500 closed at 1,928.21. That’s a two-month low, and it’s a loss of 4.13% from the all-time high close of September 18.

That’s not a big loss, but remember, we haven’t had a 10% correction in three years. I should remind all investors that every few years, stocks go down. It’s just the nature of the beast. But now we’re in earnings season, and this is when every stock is judged by the market. For disciplined investors, we also want to pay close attention to the earnings guidance from our stocks.
In this week’s issue, I’ll walk you through what’s been roiling the market. I’ll also highlight three of our Buy List stocks which have earnings reports coming next week. For the broader market, I’m expecting a mild earnings season. Nothing great, but not terrible either. I’ll also have some updates on our Buy List stocks, but first, let’s look at what has the market so rattled lately.
Volatility Makes a Comeback
…..read more HERE


-
I know Mike is a very solid investor and respect his opinions very much. So if he says pay attention to this or that - I will.
~ Dale G.
-
I've started managing my own investments so view Michael's site as a one-stop shop from which to get information and perspectives.
~ Dave E.
-
Michael offers easy reading, honest, common sense information that anyone can use in a practical manner.
~ der_al.
-
A sane voice in a scrambled investment world.
~ Ed R.
Inside Edge Pro Contributors

Greg Weldon

Josef Schachter

Tyler Bollhorn

Ryan Irvine

Paul Beattie

Martin Straith

Patrick Ceresna

Mark Leibovit

James Thorne

Victor Adair