
Gold & Precious Metals
Gold is currently getting a reprieve as it trades close to $1240 which is above important weekly support at $1200. It’s safe for the time being but we believe that Gold will ultimately break back below $1200 and below $1100 before the end of the already long in the tooth bear market. Because Gold is somewhat of an anti-asset, it’s important to chart its course against other asset classes. Gold performs best when its strong against all other classes. Moreover, prior to recent important bottoms Gold bottomed first against other classes before bottoming in nominal terms. It appears that could happen again.
The first chart looks back at the 2008 bottom. We plot Gold against foreign currencies, commodities, global equities and the S&P 500. Gold’s lowest tick was late October 2008 while its daily low was in November 2008. Against other asset classes, Gold bottomed before then. Gold bottomed against foreign currencies and the S&P 500 in September while bottoming against global equities in May and commodities in June.

We should also note that while Gold bottomed in April 2001, it bottomed in real terms (against foreign currencies, equities and commodities) months before then.
Let’s look at the same charts today. While Gold has only recently emerged from a weak triple bottom, it is showing more strength against the other asset classes. Against foreign currencies Gold is nearly 10% above the December 2013 low. Gold is very close to an 11-month high against commodities and is trading at a 7-month high against global equities. Gold remains weak against the S&P 500.

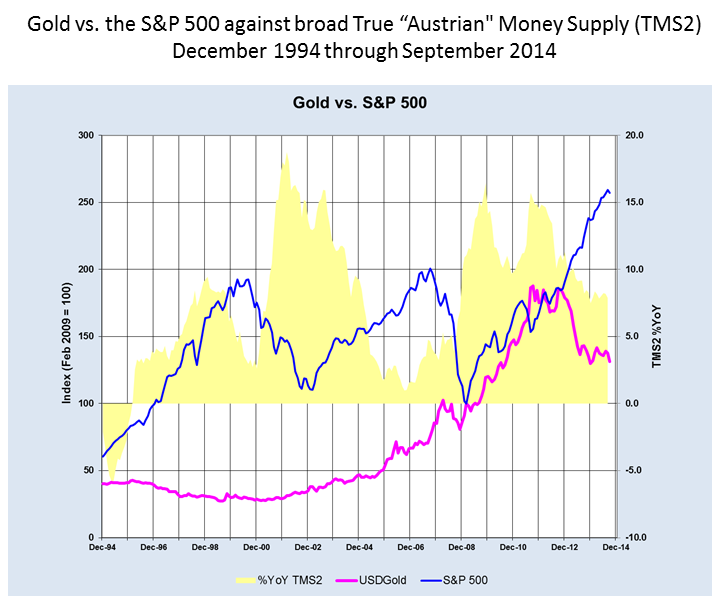
Going forward there are a few things we will be watching. Assuming Gold breaks back below $1200 and eventually below $1100, will it be able to hold these recent lows against the other asset classes? If yes then that will show that though Gold is declining it is maintaining the kind of relative strength that was in place at previous major bottoms. Secondly, the Gold vs. S&P 500 ratio is very important. US equities and precious metals have been on a divergent course since the summer of 2011. If we get a weekly close in the ratio above 0.75 then it would signal a major turning point in favor of Gold.
In the meantime we would advise continued caution. Gold and Silver have bounced but only from an extreme oversold condition. Though Gold has rallied $50/oz the miners have done nothing. The large caps (GDX, HUI) are trading dangerously close to recent lows while the juniors (GDXJ) have tread water at best. They are hinting that this rally won’t last. Please stand aside for the time being. I see a potential lifetime buying opportunity emerging in the months ahead. Consider learning more about our premium service including a report on our top 5 stocks to buy at the coming bottom.
Good Luck!
Jordan Roy-Byrne, CMT

According to the financial media, the global economy is supposedly rolling over causing a glut of inventories producing a deflation in the prices of many commodities. If this is the case… someone should tell that to King of base metals… Copper.
Something doesn’t seem to be making sense in the copper market as the price continues to decline, so are the level of global copper inventories. You would think the opposite would be the case, but we must remember in the new Financial Paradigm — Paper assets such as Derivatives, Stocks and Bonds are KING, while Gold-Silver and commodities are GARBAGE. Which is why (according to their mentality), financial assets are what we should EAT, while gold-silver and commodities are what we flush down the toilet once we are done digesting and consuming them (put another way–CRAP).
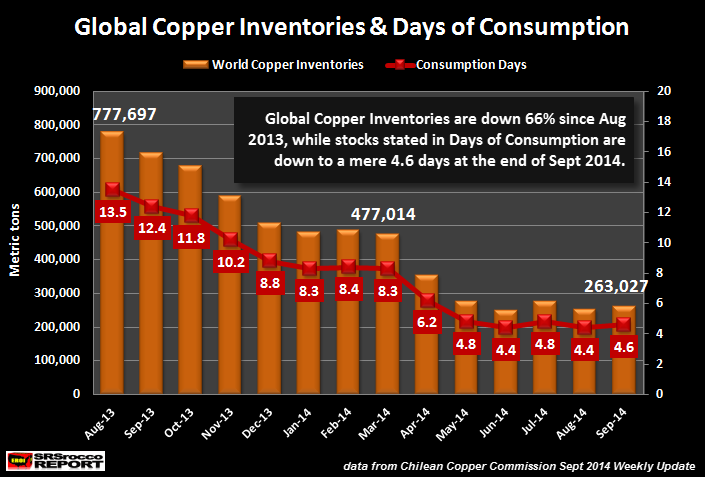
If we look at the chart below, we can see a very interesting trend taking place in global copper inventories. Not only are we are near record lows, we are down to less than five days worth of copper inventories:
(Data from the Chilean Copper Commission website Weekly Updates)
In August 2013, the world held 777,697 metric tons (mt) of total global copper inventories–a 13.5 day supply. During that time, the price of copper was trading in the $3.30-$3.40 range. If we move over toward the middle of the chart, by March 2014, the global copper stocks declined to 477,014 mt (8.3 day supply), while the price of copper traded in the $3.00 range.
So, after a near 40% decline in world copper inventories, the price of copper fell 10%. Interestingly, this is the same the price of silver fell from $25 (Aug 2013) to $20 in March 2014.
Now, if we look at the current data, shown on the right side of the chart, total global copper inventories are now at 263,027 mt at an impressive 4.6 day supply (sarcasm). And of course, the price of copper fell from a high of nearly $3.30 in June, to around 3 bucks today.
Let’s compare copper inventories at the end of September, going back to 2009.
Global Copper Inventories
SEP 2009 = 490,773 mt
SEP 2010 = 553,737 mt
SEP 2011 = 658,851 mt
SEP 2012 = 427,733 mt
SEP 2013 = 717,232 mt
SEP 2014 = 263,027 mt
Here we can see that end of September copper inventories in 2014 are the lowest in six years…. and at a 4.6 day supply.
Just maybe the copper traders know that inventories are going to header higher by the end of the year if the global economy continues to shrink. However, a 4.6 day supply of copper doesn’t seem like the demand for the king base metal is really falling all that much… or am I missing something here.
Lastly, there is speculation that the Chinese may be buying and hoarding copper that isn’t recorded in the “Official Inventories.” I say… so what.
If I were Asian or Chinese, I would rather spend $1.8 billion to purchase the rest of the 263,000 mt of global copper inventories than spend another lousy RED CENT on U.S. Treasuries that will become worthless at some point in the future.
NEW UPDATE 10/18/14:
After reading some of the comments below the article, I did additional research that might help answer some of the questions raised. However, the more I looked into to the global copper market, the more bizarre it became.
While it’s true that China recently had a probe into its Copper Financial Deals (now gone bad), this became public in 2013 and was addressed early this year. If it is true that China has all this extra copper in inventory… then why did Chinese Copper imports increase 18.7% year-over-year in the first seven months of 2014??? (source of data from this Reuters article).
Again, if we knew that the Copper Financing Deals were coming apart back in May of last year (Zerohedge: The Bronze Swan Arrives: The End of China’s Copper Financing), wouldn’t this copper market imbalance be worked through by now? I mean, its been nearly a year and a half. By the way, thanks reader houstskool for posting that link in the comment section.
I went back and looked at the data from the Chilean Copper Commission and found some interesting trends. From Jan-May 2014, global copper production increased 5.6% y-o-y, from 7.28 million metric tons in 2013, to 7.7 million metric tons in 2014. So, we have an INCREASE IN COPPER PRODUCTION.
Now, from Jan-Apr 2014, the world consumed -2.3% less copper, from 5.4 million metric tons in 2013, to 5.3 million metric tons in 2014… a DECREASE IN COPPER CONSUMPTION. This isn’t much of a decline, but you would think for the first four months of the year, we would have seen a build in global copper inventories… due to an increase in production and a decline in consumption. However, if we look at the chart above, global copper inventories actually DECLINED IN A BIG WAY in April, 2014.
Global copper inventories fell from 477,014 mt in March, to 355,075 mt in April. This was a drop of 25% from a 8.3 day supply, down to a 6.2 day supply.
So, here’s the question. Why would global copper inventories be falling if global production is increasing, demand falling and China with a supposed GLUT of copper inventories to work through? Does that make any sense whatsoever?
In one of the comments below, a reader put a link to a BNN interview with a copper analyst about the global copper market, which you can watch at the link HERE. Basically, he goes on to say that they look at all the different Chinese warehouses and state there is a 250,000 mt global surplus of copper. If that is the case… then WHY IN THE HELL aren’t global copper inventories RISING instead of FALLING over the past year???
You see, something just doesn’t make sense when we look at all the data. Again, why did Chinese copper imports increase 18.7% Jan-Jul if they had all this surplus copper they could work through???
In conclusion… all I can say is SOMETHING FISHY THIS WAY BLOWS in the Global Copper Market.
Please check back for new updates and articles at the SRSrocco Report. You can also follow us at Twitter below:

Central bank credibility is at all-time highs. As a consequence, we suggest, equities are near all-time highs too while gold is scraping multi-year lows. A change though may be in the offing with all three. Not today, nor tomorrow. But perhaps sooner than most think.
So here we are…
Here’s how we see it…continue reading HERE

 It’s a challenge to put a finger on what was the most significant event that took place in financial markets this past week. It might have been the price of crude oil further deteriorating to touch below 80 dollars a barrel for a brief instance on Wednesday, or the volatility index, the VIX coming within a hair of a 30 print. For certain, the most revealing of all markets was for US Treasury bonds as investors in a herd fashion reached for the safe haven and saw yields dip below the 2 handle and touch a low of 1.85 per cent. It is uncertainty that continues to be the theme that casts a shadow over economic growth prospects, but as commentators noted this week, investor complacency amongst the masses leading to excessive risk taking is what is fundamentally shifting these markets.
This correction we are witnessing in the equity markets almost seemed long overdue, and the supply glut in the global oil market was perhaps the catalyst that acted to push these markets over the edge. The S&P500 moving over 1000 trading sessions without seeing that down move of 10 per cent or greater has left behind a number of investors waiting to participate in the rebound of US equity markets, and as the buying that took place on Thursday and Friday of this week, and the speedy rebound (for the time being) highlighted how welcomed this correction was.
But perhaps there was another factor contributing to the turnaround we saw towards the end of the week, and it was
inspired by comments from St. Louis Fed President James Bullard. Bullard made the point that the FOMC should remain adaptive to when they choose to end their bond purchase program, and even hinted that an end to Quantitative Easing, expected to be announced at the end of this month, could only be temporary as they stand ready to support financial markets and continue to artificially boost asset prices. Bring on the speculation for QE4.
Former PIMCO CEO, Mohammed El-Erian comments that investors should be careful what they wish for. One of Ben Bernanke’s famous quotes when justifying the Fed’s accommodative policy was that the benefits were always outweighing the costs and risks. If the Fed was to embark on QE4, it would become incrementally harder for their policy committee to justify whether the benefits would outweigh the increasing costs and risks.
The US economy continues to experience record low interest rates. Falling oil prices will ultimately create yet another significant boost to an economy that is 70 per cent consumer driven and now sees gasoline prices 25 percent off their summer highs. And employment as a whole continues to see strong and stable growth above 220 thousand new positions a month. The takeaway though is not what’s driving the US economy via Fed policy. It’s how Fed policy is impacting financial markets, and that’s the reason for concern.
As has always been, the single biggest risk of the Fed’s accommodative policy is how investors have become dependent on their asset purchases in order to see risk assets trade higher. Thursday and Friday are further evidence of this. A sobering reminder comes with this, which is how overcrowded consensus trades have become, and really a question about how deep the liquidity or support in these markets really is when the majority of investors with the same mentality are all selling.

 Russell: Gold – I can’t prove it yet but I believe the last decline in gold knocked out the last of the gold bugs and gave gold, technically, a clean slate. I believe we saw the ultimate bottom of the gold bear market on Friday (Oct. 10th Ed.)
I believe this is the time to invest in gold and silver if you have not done so already.
If I am correct, gold should act like the release of a compressed spring. Gold above 1300 would make me even more certain of my opinion, and gold above 1350 would represent a major buy signal…..continue reading HERE
Martin Armstrong: Sell Signal Elected: US Share Market for Week of Oct 13, 2014
 We have elected a Weekly sell signal in the Dow and this is warning that we may yet see that November low during the week of November 3rd.
-
I know Mike is a very solid investor and respect his opinions very much. So if he says pay attention to this or that - I will.
~ Dale G.
-
I've started managing my own investments so view Michael's site as a one-stop shop from which to get information and perspectives.
~ Dave E.
-
Michael offers easy reading, honest, common sense information that anyone can use in a practical manner.
~ der_al.
-
A sane voice in a scrambled investment world.
~ Ed R.
Inside Edge Pro Contributors

Greg Weldon

Josef Schachter

Tyler Bollhorn

Ryan Irvine

Paul Beattie

Martin Straith

Patrick Ceresna

Mark Leibovit

James Thorne

Victor Adair