Gold & Precious Metals

Update: How Will We Know That the Bottom Is In?

Przemyslaw has covered the balance of his profitable long trading position this morning. It should be noted that prior to this long position Przemyslaw covered his profitable short gold short positions on Sep. 25. Here is a summary why he has covered the other half of his long position today:

“It’s tempting to try to ride this rally until it’s definitely over and exit very close to the top, but let’s forget about this for a minute and consider if we would open a long position today if we hadn’t had one already, the answer is “no”. It’s too risky given the proximity of the resistance levels in gold and silver (not to mention silver’s turning point) and the underperforming mining stock sector.” Yesterday’s article below – Money Talks Editor

Briefly: In our opinion speculative long positions (half) in gold, silver and mining stocks are justified from the risk/reward perspective.

Yesterday, gold closed higher than it did in the previous several weeks, which seems like a very bullish development for the entire precious metals market until one realizes that miners are still close to their most recent lows.

In short, in our opinion, the answer to the title question is that miners could rally some more in the short term, but we don’t expect the rally to be significant. We expect to see significant rallies after the final bottom is reached (in a few weeks – months), but not before that – at least not based on the information that we have available today. Furthermore, it seems that the next local top will be reached shortly, but that it’s not in just yet.

Why? The USD Index is likely not done declining and the long-term resistance lines in gold have not been reached. What we wrote about these markets yesterday and on Friday remains up-to-date. Still, we would like to show you the latest short-term USD chart as we have added a target area to it (charts courtesy of http://stockcharts.com).

sc-3

The target area is relatively close in terms of both time and price. Most of the decline is probably behind us. We have previously written that we expect the USD Index to correct to the 38.2% Fibonacci retracement level and the biggest unknown is what the retracement should be based on – the May-Oct. or Jul.-Oct. rally. The former seems a bit more likely because the 38.2% based on the May-Oct. rally coincides with the 50-day moving average (blue line on the

above chart).


scz

Click Chart for Larger Image

As we have mentioned earlier, gold closed higher once again, which allowed for closing part of the long positions with greater profit yesterday.

As a reminder, we took previous profits off the table by closing short positions on Sep. 25 and we went long with half of the regular position on the same day (gold closed at $1,222.50, but the intra-day low was $1,206.60 and we changed the positions well before the markets closed). On Sep. 30 (when silver was below $17 and gold closed at $1,209.10) we wrote about doubling the long positions.

Yesterday’s move, however, materialized on relatively low volume. It was lowest in a few weeks, so the rally itself was not bullish. The price-volume combination suggests that the rally is running out of steam and the local top is close. This is in tune with what we can infer from the USD Index charts and from the long-term gold chart.

sc-1

The USD Index is not the only thing that moves in cycles. The silver market has a cyclical nature as well. The white metal is likely to turn around in the next several days, and the most recent short-term move has been up. Consequently, we are quite likely to see a local top relatively soon.

The declining resistance line is now relatively close – about $0.27 away and more or less at the previous intra-day Oct high. Consequently, we could see the local top more or less at this price level. It seems that it would quite likely coincide with gold moving to its target price.

sc-2

Now, in the case of mining stocks, what we see on the above chart per se is less important than what we learn when we compare it with the chart of gold. The above chart tells us that miners rallied yesterday, but the miners-gold link tells us that miners are still weak. This is particularly discouraging because the general stock market moved higher once again yesterday. In other words, we saw Friday’s bearish signal once again – miners did not soar or catch up with gold, even though they “should have”.

Overall, we can summarize the situation in gold, silver and mining stocks in a way that is similar to what we wrote yesterday. However, before we write the final paragraph, we would like to reply to a few questions that we received yesterday.

The first one is “how will you know we reach the final bottom for precious metals and the mining stocks? Will $1,000 and $14 be the final one or could we see a rebound and another plunge lower?” Our reply is similar to what we have written previously. We will be looking for confirmations at these levels. Significant support levels in gold and silver being reached – this is one thing that is likely to be seen at the final bottom, but there are also other things that we would like to see:

– We would like to see USD Index at a major resistance level.

– We would like to see the gold stocks to gold ratio plunge (but we would like gold stocks to show strength after a while, thus refusing to follow gold’s declines).

– We would like to see the silver to gold ratio plunge very visibly (to the point that it’s scary and most investors/traders panic).

– We would like to see websites dedicated to gold freeze for a while when people are so interested in the volatile downswing and keep refreshing these websites for latest prices (did you know that something like that occurred in 2011 right before the final top?).

– We would like to see a very bearish (preferably hateful or otherwise emotional) article on gold in the mainstream media.

– We would like our non-investing friends to call us asking what’s going on with gold as they’ve heard that it has declined so badly.

– We will see other sings that investors and traders sentiment toward gold is very bad.

In other words, we will be looking for confirmations that the bottom is in. The price itself is not enough. At this time it seems that the $1,000 – $1,100 area for gold, $14 – $16 for silver and 150 or so for the HUI Index will stop the decline, but there are no sure bets in any market. We will keep monitoring the situation and report to you accordingly.

The second question that we received is if we will let you know when we think the final bottom is in and if we will plan to take advantage of it using ETFs or quality mining stocks. The answer to the first questions is “yes”. In more detail, we will let you know when we think that the situation looks favorable enough to get back into the precious metals market with the long-term investment capital and when to open speculative long positions. As far as ETFs / mining stocks are concerned, we will quite likely use both.

We will most likely use ETFs / ETNs for speculation in the case of gold and silver (trading capital) and we will use quality mining stocks for investment purposes (individual mining stocks are also useful in the case of speculative trades).

In general – as you have read in the bottom part of each recent alert – we are now out of the precious metals market with the long-term investment capital. The gold & silver portfolio report shows you how the portfolio looked (in case of 3 sample investors: Eric, Jill, and John) before we exited the long-term positions. When we come back to the precious metals market, you can expect a similar structure. We will probably move more into platinum than we will into gold, though.

The third question was what stocks we prefer to buy when we think the bottom is in. The short answer is – the ones with the best outlook. How do we determine that? Using the Golden StockPicker and Silver StockPicker tools. We created these tools a few years ago based on our experience and insights and we have tested their performance several months ago – they have proven to be very helpful in case of both: selecting stocks for speculative trades, and in case of long-term investments.

Each day these tools create rankings of stocks based on their recent performance relative to gold. If they don’t give you the big bang for your gold-and-silver-exposure-seeking buck, stocks rank lower. If they do, and they provide leverage, they rank higher.

There are multiple ways to use these tools, but in short, for long-term investment purposes, the aim – in most cases – is to buy the best 5 stocks and then rebalance them (every 20 trading days in the case of silver stocks and every 50 trading days in the case of gold stocks). This approach created a lot of value as compared to the simple buy-and-hold approach. We conducted  very thorough research on rebalancing mining stocks (the most comprehensive there is, to our knowledge) and you can read the corresponding report in our reports section. The report also features a few approaches regarding speculative purposes. In most cases, selecting top 2 mining stocks seems justified. For instance, take the current/last trade. We wanted to provide you with an example of how the Golden StockPicker works so we saved its results that were based on the Oct. 3 session.

Here’s the input screen:

gsp-input


Here’s the output screen (top 5 stocks):

gsp-outputs

The top 2 gold stocks were: GOLD and RGLD. The above readings were available on Oct. 6 so we will take Oct. 6 and yesterday’s (Oct. 20) closing prices into account. The HUI Index moved from 193.49 to 191.16 (thus moving lower by about 1.2%). At the same time, GOLD moved from $67.23 to $68.55 (thus moving about 2% higher) and RGLD moved from $65.36 to $68.04 (thus moving about 4.1% higher).

Of course, these tools are no crystal balls and they will not select top performers each and every time, but – as we have shown in the rebalancing report – they are very likely to improve the results that one gets on the mining stock trades.

To summarize, when the risk/reward ratio is favorable enough to get back in the precious metals market with the long-term investment capital, Golden StockPicker and Silver StockPicker will provide the mining stock rankings.

Summing up, while the situation in USD Index and in gold and silver suggests higher prices in the short term (not much higher, though), the bearish signal from the mining stocks makes the overall short-term outlook for the precious metals sector less bullish than was the case previously.

What’s next? We’ll be paying close attention to the events as they unfold and will let you – our subscribers – know when we think further adjustments (either taking the rest of the profits off the table, or adding to / changing positions) are justified from the risk/reward point of view.

To summarize:

Trading capital (our opinion):

It seems that having speculative (half) long positions in gold, silver and mining stocks is a good idea:

Gold: stop-loss: $1,172, exit order: $1,257, stop loss for the UGLD ETF $11.29, exit order for the UGLD ETF $13.75

Silver: stop-loss: $16.47, exit order: $18.07, stop loss for USLV ETF $23.94, initial target price for the USLV ETF $31.73

Mining stocks (price levels for the GDX ETF): stop-loss: $19.94, exit order: $23.37, stop loss for the NUGT ETF $18.25, initial target price for the NUGT ETF $28.99,

In case one wants to bet on higher junior mining stock ETFs, here are the stop-loss details and initial target prices:

GDXJ stop-loss: $28.40, exit order: $37.14

JNUG stop-loss: $6.19, exit order: $16.34

Long-term capital (our opinion): No positions

Insurance capital (our opinion): Full position

Thank you.

Przemyslaw Radomski, CFA

Founder, Editor-in-chief

Tools for Effective Gold & Silver Investments – SunshineProfits.com

Tools für Effektives Gold- und Silber-Investment – SunshineProfits.DE

* * * * *

Disclaimer

All essays, research and information found above represent analyses and opinions of Przemyslaw Radomski, CFA and Sunshine Profits’ associates only. As such, it may prove wrong and be a subject to change without notice. Opinions and analyses were based on data available to authors of respective essays at the time of writing. Although the information provided above is based on careful research and sources that are believed to be accurate, Przemyslaw Radomski, CFA and his associates do not guarantee the accuracy or thoroughness of the data or information reported. The opinions published above are neither an offer nor a recommendation to purchase or sell any securities. Mr. Radomski is not a Registered Securities Advisor. By reading Przemyslaw Radomski’s, CFA reports you fully agree that he will not be held responsible or liable for any decisions you make regarding any information provided in these reports. Investing, trading and speculation in any financial markets may involve high risk of loss. Przemyslaw Radomski, CFA, Sunshine Profits’ employees and affiliates as well as members of their families may have a short or long position in any securities, including those mentioned in any of the reports or essays, and may make additional purchases and/or sales of those securities without notice.

Copper, Nickel & Zinc Won’t Be Cheap for Long

moneyful580The all-powerful U.S. dollar is currently hammering base metals and base metal equities. Haywood Securities Mining Analyst Stefan Ioannou says that increasing demand and near-term supply shortages make base metals a bargain that won’t last. In this interview with The Mining Report, Ioannou argues that juniors with good deposits and low costs are in a unique position to benefit, and lists several companies that look to do just that.

The Mining Report: What effect is the strong U.S. dollar having on base metal prices and base metal equities?

Stefan Ioannou: Base metals are priced in U.S. dollars, so as the dollar rises in value, base metals fall in value. Right now, copper is testing the $3 per pound ($3/lb) level, and zinc is drifting down toward $1/lb. And, of course, lower base metal prices are reflected in lower valuations of base metal equities.

TMR: Why is the U.S. dollar becoming stronger?

SI: Because of a strengthening U.S. economy or at least the perception of one. To give one example, the job creation figure for September was expected to be 215,000, but the number came in at 248,000.

TMR: How long will this U.S. dollar trend last?

Screen Shot 2014-10-21 at 12.44.37 PMSI: With quantitative easing seemingly over, which is still arguable, the big question for the U.S. economy is when and by how much will interest rates be increased. Elsewhere in the world, the other major economies seem to be, if not slipping, not really growing significantly. Europe is kind of flat. China is still growing but not nearly as fast as people had hoped for or expected. As a result, most world currencies are down relative to the U.S. dollar.

TMR: What are your forecasts for base metal prices?

SI: Our metal price forecasts for 2015 forward include $3.25/lb copper, $8.50/lb nickel and $1.15/lb zinc.

TMR: What are the economic assumptions underlying these forecasts?

SI: We try to pick metal prices that are arguably conservative, but we do take into account some of the major supply-demand fundamentals coming down the pipe. For example, zinc is facing a significant supply deficit into 2016, so we could see zinc rise above $1.50/lb fairly quickly. Would it stay there for more than two or three years? Probably not, given the anticipated increase in higher-cost Chinese production that higher zinc prices would trigger. Nevertheless, we see a medium-term investment opportunity emerging.

TMR: Given how important China is to world economic growth, how much do we really know about the Chinese economy?

SI: China has always been a bit of a mystery. The September Purchasing Managers Index (PMI) number was the same as August: 51.1. Anything over 50 indicates expanding growth, but it is subdued growth. The market has been looking to 7.5% GDP growth in China this year, but it looks as if it won’t make that.

The worrisome aspects to the Chinese economy are an ailing property market, industrial overcapacity and high levels of corporate debt. Housing is about 25% of the Chinese economy, so policymakers are now considering loosening mortgage restrictions.

Screen Shot 2014-10-21 at 12.44.45 PMTMR: Why do you believe the world faces a copper deficit in the near future?

SI: On the supply side, the majors have in the last few years focused on cutting costs at existing operations. That’s obviously great for their bottom lines today. However, it also means new mines and greenfield developments are being deferred. So by 2017–2018 we will face the consequence of a lack of new supply, which is demand outweighing supply.

TMR: Does the world face a near-term nickel deficit as well?

SI: A big driver for nickel is the steel market, and this has been relatively bearish. This year, however, Indonesia, which provides 25% of world supply, banned the export of nickel ore. Indonesia wants the economic benefits of processing its ore in country, but it will take a couple of years to build its infrastructure so that this lost supply will re-enter the global market.

The Philippines is also now considering an export ban of its own. This country supplies less than 10% of the world market, but it’s still a significant number. Nickel ore stockpiles in China and elsewhere are still high, but are now being drawn down toward potentially critical levels. There is a bullish argument that we could see the nickel market slip into deficit by as early as mid-2015.

TMR: What’s your view of the junior copper space?

SI: Everything I cover has come down in valuation. I think there is opportunity here. The best place to start is with the producers because they are generating cash flow and have positive balance sheets. One such company is Copper Mountain Mining Corp. (CUM:TSX). Its Copper Mountain mine in British Columbia—owned 25% by Mitsubishi Corp. (8058:JP)—has had a long start-up. The company has just installed a new secondary crusher, which is finally going to bring it to nameplate capacity: 35,000 tonnes per day (35 Kt/day) of throughput. This is the turning point, and I think Copper Mountain Mining is poised for a rerating.

TMR: You just raised your target price, correct?

SI: Yes, from $3 to $3.50. We just saw the company’s Q3/14 production numbers. The crusher integration went smoothly over the latter half of the period and was handling over 35 Kt/day in late September, which should set the stage for a strong Q4/14.

TMR: What other producers did you want to discuss?

SI: Capstone Mining Corp. (CS:TSX) and Nevsun Resources Ltd. (NSU:TSX; NSU:NYSE.MKT). Capstone has three mines which, for the most part, are operating well: Pinto Valley in Arizona, Cozamin in Mexico and Minto in the Yukon. Pinto Valley was bought from BHP Billiton Ltd. (BHP:NYSE; BHPLF:OTCPK) last year for $650 million ($650M). The market was skeptical at the time, but the company immediately drilled and expanded the project’s five-year reserve, which now supports a mine plan through 2026. This has been a game changer for Capstone’s capacity.

Screen Shot 2014-10-21 at 12.44.56 PMTMR: As a result, you wrote in August that Minto’s position as a “core asset” has been diminished.

SI: Minto has been a very successful mine over the years. But it’s getting to the point now where the remaining resource is for the most part lower grade and higher cost to produce. Cozamin, Capstone’s third mine, is also smaller than Pinto Valley, but it’s got very good grade and a lot of exploration potential. It’s an underground mine, so Capstone is going to continue to add reserves over time. Plus, there’s a fair bit of zinc coming out of it.

TMR: Is Nevsun an example of the perils of overstating political risk? The Bisha mine is in Eritrea, but it is nonetheless a success story, right?

SI: Very much so. I give the Eritrean government a lot of credit. It established a well-defined and well-considered mining code that lays out exactly how the government will participate and the steps that need to be taken to move a project into production. Bisha is now 60% owned by Nevsun and 40% by the government. The government got 10% for free, which is pretty standard across Africa, and proceeded to pay fair value for the other 30%.

Nevsun has close to $400M in cash and no debt. That works out to $2/share, and so half of the company’s share price is actually cash. Nevsun’s biggest issue going forward is what its next acquisition is going to be.

TMR: Bisha began with gold mining and then with copper. What is its future?

SI: Bisha is a 40 million ton (40 Mt) volcanogenic massive sulfide (VMS) deposit, world-class in size and high grade. For the first few years Nevsun mined 8 grams per ton (8 g/t) gold from an open pit that had basically no strip ratio to it. Now the company is into the second layer of the VMS cake: supergene copper. It is mining grades well north of 5% now in an open pit. As Nevsun moves into the third layer, toward 2016, there will be zinc and copper, hopefully just as the zinc price really starts to pick up.

TMR: What are the prospects for resource growth at Bisha?

SI: Bisha has always been a very prospective land package, but this is the first year Nevsun has spent significant money on regional exploration. VMS deposits typically occur in clusters, and Nevsun has already found a few smaller ones outside Bisha: one called Harena is 10 kilometers south. Assays released September 23 included 0.85% copper, 3.96% zinc, 0.4 g/t gold and 43.6 g/t silver over 41.6 meters. Nevsun has already outlined a 1.2 Mt reserve that remains open for expansion. Ore from the deposit will be trucked to the Bisha plant for processing.

TMR: Which copper project most interests you?

SI: Highland Copper Company Inc. (HI:TSX.V), which is in Michigan’s Upper Peninsula, an area with a really productive copper mining history. The company originally had two smaller, high-grade deposits: 543S and G2. Then in February, the company bought the Copperwood mine from Orvana Minerals Corp. (ORV:TSX) for $25M. This is an advanced-stage project: feasibility done, essentially permitted, ready to go. And then Highland bought the historic White Pine mine and surrounding property. The idea now is to consolidate those deposits and build a centralized facility. Highland could produce upward of 200 million pounds (200 Mlb) a year, a number that will attract the interest of midtier producers.

TMR: After consolidation, how much will this project cost?

SI: My ballpark number would be $650M for a 16 Kt/day operation.

TMR: But Highland wouldn’t be doing this on its own.

SI: It’s going to be a 50/50 joint venture (JV) with AMCI Group. Highland’s bringing the project to the table, and AMCI’s bringing the money: $45M by December 15, which is basically all the funding required to take the project through feasibility, which is expected by early 2016.

TMR: Which nickel project most interests you?

SI: Talon Metals Corp. (TLO:TSX) and its Tamarack nickel-copper-platinum project in Minnesota. This is a JV with Rio Tinto Plc (RIO:NYSE; RIO:ASX; RIO:LSE; RTPPF:OTCPK). Talon has the option to spend $37M over the next three years to own 30%. At that point Rio Tinto has a decision to make. If a resource gets defined to the point where it’s big enough, Rio Tinto will build the mine as a 70/30 JV. Or if Rio Tinto decides it’s not big enough, Talon can buy out Rio Tinto for $107M.

TMR: The company announced an initial resource estimate September 2.

SI: This is a high-grade nickel-sulfide deposit of about 6 Mt now, with more than 2% nickel equivalent. It’s close to infrastructure. From a geological perspective, it’s similar to Voisey’s Bay. The deposit is shaped like a tadpole. The 6 Mt is located in the tail, which is wide open and could contain 10–20 Mt. The head, which hasn’t been drilled, holds the real blue-sky potential for a very large discovery. I think that’s why Rio Tinto has kept an interest in it. Even if the deposit turns out not to be large enough for Rio Tinto, it’s already looking as if it could be one heck of a deposit for a junior to midtier producer.

I should mention that Rio Tinto had another nickel deposit in the northern U.S.: Eagle, which it sold to Lundin Mining Corp. (LUN:TSX) last year for $325M. Eagle is going to be a mine, but Rio Tinto sold that one and kept Tamarack. That should tell you something.

TMR: Are there other projects similar to Voisey’s Bay?

SI: North American Nickel Inc.’s (NAN:TSX.V) Maniitsoq project in Greenland has a similar type of geology. One of the things the market really likes to see in the nickel space is sulfide-nickel projects, like Maniitsoq, instead of laterite nickel. Processing is just a lot simpler and good grades are common. Maniitsoq hit some very high grades right off the bat in 2013. It didn’t get those barnburner grades this year, but I don’t think this story is over.

North American Nickel is owned 30% by VMS Ventures Inc. (VMS:TSX.V), whose primary asset is a VMS deposit in Manitoba called Reed, itself a JV with HudBay Minerals Inc. (HBM:TSX; HBM:NYSE). VMS Ventures is getting cash flow out of that. One way to play the Maniitsoq story is to buy VMS shares. Then you get cash flow, plus the potential benefits from Greenland.

TMR: What about other nickel-sulfide projects?

SI: Balmoral Resources Ltd. (BAR:TSX; BAMLF:OTCQX) has made a high-grade nickel sulfide discovery at its Grasset project in Quebec, which has garnered a lot of attention. There is also Royal Nickel Corp.’s (RNX:TSX) Dumont project in Quebec. Production start-up is targeted in 2016. On the one hand, it’s low grade at ~0.3% nickel. On the other, it contains billions of tonnes, which translates into a long mine life and a pretty significant production profile. The company’s in the midst of permitting and shoring up project financing, which will likely entail a partnership.

TMR: According to Royal’s website, this would be the fifth-largest nickel sulfide operation in the world. When you add low grade to that, you’re talking a big capital expenditure (capex).

SI: $1.2B is the feasibility study number.

TMR: Is Dumont dependent on a rise in the price of nickel?

SI: Considering its capex, to generate an 18% internal rate of return, Dumont would probably require a nickel price of at least $9.00/lb. That said, the deposit’s size underpins a mine plan that would span multiple metal price cycles.

TMR: Which zinc producer stands out?

SI: We believe that Trevali Mining Corp. (TV:TSX; TREVF:OTCQX; TV:BVL) is poised to become the marquee name in the zinc space. Zinc is facing a significant medium-term supply issue because of mine closures. Last year, the Brunswick #12 mine in New Brunswick, an Xstrata Plc (XTA:LSE) operation, was depleted. Soon, China Minmetals Corp.’s (CMIN:CH) Century mine in Australia and Vedanta Resources Plc’s (VED:LSE) Lisheen mine in Ireland will close, too. Within the next two years, something on the order of 10–12% of world production will be lost.

The flip side is that there are no significant advanced-stage projects in line to make up this deficit. Almost by default, anyone who has zinc in its name or has a zinc association is poised to do well. Trevali is the leader of that pack. It is in production now at Santander in Peru, about 40 Mlb a year currently. Caribou in New Brunswick is slated to begin commissioning in the second quarter of next year. When it is up and running at full scale capacity, it will add about 90 Mlb a year. Santander is scheduled for an expansion, probably in 2016–2017, to 80 Mlb. At the end of the day, we are looking at a zinc company with over 170 Mlb of annual zinc production on its books.

TMR: Which other North American zinc projects interest you?

SI: Foran Mining Corp.’s (FOM:TSX.V) McIlvenna Bay project began its preliminary economic assessment last month. It’s a VMS deposit with zinc, copper and other metals. It’s in Saskatchewan, just over the border from Manitoba. Geologically, it’s within the Flin Flon Greenstone Belt and at 25 Mt is the third-biggest discovery in the world-class mining camp. It has proximity to HudBay’s infrastructure, and it could be strategic to HudBay at some point in the future.

TMR: HudBay’s share price rose from $8 in the spring to about $11.50 and then fell to $9.25. Was its takeover of Augusta Resource Corp. and its Rosemont copper project in Arizona a mistake?

SI: I would argue that it was a pretty strategic move for HudBay. The company put in an early bid, before Rosemont’s permitting was completed. It took a chance, but got Rosemont at a discounted valuation. HudBay already has its development plate full with Lalor in Manitoba and probably even more so with Constancia in Peru. So it is taking a longer-term view on Rosemont’s development timeline relative to the project’s previous owner.

TMR: HudBay completed a $170M debt financing in August. How do you rate its expansion versus its bottom line?

SI: Well, HudBay has to be careful. The company is currently spending a lot of money to grow its production profile at multiple operations. Constancia is a $1.7B project. But the good news is that we were down at the site in September, and it is tracking on schedule and on budget. It’s 92% complete as we speak.

TMR: What about any projects in Alaska?

SI: There is Zazu Metals Corp.’s (ZAZ:TSX) LIK project. It has silver, as well as zinc. And some lead, as well, but zinc is its main focus. LIK is very close to Teck Resources Ltd.’s (TCK:TSX; TCK:NYSE) Red Dog zinc mine, the world’s largest, with about 5% of world production.

TMR: LIK is a JV with Teck, is it not?

SI: Yes, but it’s slightly different than your typical junior-major JV. In this case, Zazu is spending $18M to own 80% and Teck will not have a subsequent back-in right.

TMR: What do you think of the project?

SI: There’s very good established infrastructure, and just across the project boundary Teck has a deposit called Su. The area is basically one big deposit. If and when Teck puts Su into production, it would make almost no sense to do it without a combined Su/LIK open pit. Furthermore, Red Dog is very high grade, but it’s also underpinned by an onerous royalty structure with a First Nations company called NANA Regional Corp. Eventually, NANA will get a 50% net proceeds interest (NPI) royalty from Red Dog. LIK and Su have lower grades, but there NANA does not hold an NPI royalty on potential production from the deposits.

The other consideration is that two years ago Zebra Holdings, which is the Lundin family’s affiliated trust, bought 20% of Zazu, arguably bringing Lundin Mining into the picture. And we expect that with the zinc price rising, established producers are going to be looking for assets.

TMR: It has been said that the low-hanging fruit in base metals has all been picked. Thus, future projects will be more difficult and expensive, so people are just going to have to get used to permanently higher base metals prices. Do you agree?

SI: As the majors have gotten bigger, the size of the deposits they require to actually make a difference to their bottom lines needs to be bigger. Unfortunately, grade and tonnage are inversely proportional. Generally speaking, big deposits are going to be low grade. And so costs will be higher. Right now, the middle of the cost curve for copper is on the order of $1.50–1.75/lb. As we mine more and more lower-grade deposits, I wouldn’t be surprised if that position on the cost curve reached $2/lb.

TMR: Doesn’t this suggest a particular opportunity for what we might call high-grade boutique projects?

SI: For sure. At the end of the day grade is king. I think it always will be. If you can find something that has a reasonable tonnage and a good grade, you could be off to the races. Such projects can be company makers. For instance, Talon has the potential to mine a modest-sized nickel deposit with very good grade. Again, probably not big enough for Rio Tinto but very lucrative for Talon. That’s where the opportunity lies for some of these smaller companies.

TMR: Stefan, thank you for your time and your insights.

Stefan Ioannou has spent the last eight years as a mining analyst covering mid-cap base metal companies at Haywood Securities. Prior to joining Haywood, he worked with a number of exploration and mining companies, as well as government agencies as a field geologist in Nevada and throughout the Canadian Shield in both the gold and base metal sectors.

Want to read more Mining Report articles like this? Sign up for our free e-newsletter, and you’ll learn when new articles have been published. To see recent interviews with industry analysts and commentators, visit The Mining Report home page.

Related Articles


DISCLOSURE: 
1) Kevin Michael Grace conducted this interview for Streetwise Reports LLC, publisher of The Gold Report, The Energy Report, The Life Sciences Report and The Mining Report, and provides services to Streetwise Reports as an independent contractor. He owns, or his family owns, shares of the following companies mentioned in this interview: None. 
2) Stefan Ioannou: I own, or my family owns, shares of the following companies mentioned in this interview: None. I personally am, or my family is, paid by the following companies mentioned in this interview: None. My company has a financial relationship with the following companies mentioned in this interview: Highland Copper Company Inc., Royal Nickel Corp., and Trevali Resources Corp. I was not paid by Streetwise Reports for participating in this interview. Comments and opinions expressed are my own comments and opinions. I determined and had final say over what companies would be included in the interview based on my research, understanding of the sector and interview theme. I had the opportunity to review the interview for accuracy as of the date of the interview and am responsible for the content of the interview.
3) The following companies mentioned in the interview are sponsors of Streetwise Reports: North American Nickel Inc., Balmoral Resources Ltd. and Trevali Mining Corp. Streetwise Reports does not accept stock in exchange for its services. The companies mentioned in this interview were not involved in any aspect of the interview preparation or post-interview editing so the expert can speak independently about the sector.
4) Interviews are edited for clarity. Streetwise Reports does not make editorial comments or change experts’ statements without their consent. 
5) The interview does not constitute investment advice. Each reader is encouraged to consult with his or her individual financial professional and any action a reader takes as a result of information presented here is his or her own responsibility. By opening this page, each reader accepts and agrees to Streetwise Reports’ terms of use and full legal disclaimer.
6) From time to time, Streetwise Reports LLC and its directors, officers, employees or members of their families, as well as persons interviewed for articles and interviews on the site, may have a long or short position in securities mentioned. Directors, officers, employees or members of their families are prohibited from making purchases and/or sales of those securities in the open market or otherwise during the up-to-four-week interval from the time of the interview until after it publishes.


Inching Closer to “Discredit Time” on Monetary & Fiscal Policy Failure…

Quotable

“Life is a series of natural and spontaneous changes. Don’t resist them – that only creates sorrow. Let reality be reality. Let things flow naturally forward in whatever way they like.”

                                                                                  Lao Tzu

Commentary & Analysis

Inching closer to “Discredit Time” on monetary and fiscal policy failure…

(be sure to read Jack’s summary of Lacy Hunt’s work at the end of this article – MT Ed)

1413911361436

I am going to try to keep this simple, because it is too easy to make it all so damn complicated.  First let’s state the premise of this missive:

            We are very close to what the great Charles Kindleberger referred to as “discredit.” 

He identified three stages market movements:

1413911473868

We know these three stages by other names such as markup, distribution, and mark-down….But I think Professor Kindleberger’s term, especially “Discredit,” are much more apt in this cycle, as it better describes the mind-set at work that eventually leads to an unraveling of all that speculative excess those Wizards implementing monetary and fiscal policy have worked so hard to sustain. 

As we know, those in the know are the ones that distribute to those not in the know.  This is the “Revulsion” stage.  This is why major bull markets tend to roll over gradually, given the ubiquitous “they,” time to unload.  I think we are in the midst of that stage now, as the market “corrects.” 

The next stage will be “Discredit.”  This is the point at which even your soccer mom friends understand the policies of credit expansion heaped on us by the world’s largest governments and central banks were a complete disaster for the “average” person.  This is panic selling time.  This is recession/depression in key parts of the globe time.  This is bankruptcy for individuals and institutions time.  This is social unrest time. This is debt Jubilee time.  

Why do I believe we will reach this stage?  Because the numbers are telling us so; assuming we care to listen…

Before I give you the ugly details, let me digress just a bit, set the stage, and pat myself on the back for getting something right, I think. 

Just after the credit crunch, about six years ago, Black Swan created the chart you see below to help our readers better understand the powerful and negative feedback loop between debt and demand

1413911306906

This nasty feedback of debt’s impact on aggregate demand was also part and parcel to our view deflationary pressures would continue to build in the global economy—reserves in the banking system didn’t matter as it isn’t inflationary in the standard sense of the word until those reserves lead to chasing real prices in the real economy higher.  It hasn’t because of debt.  But if we look at the stock market, I think it is fair to say there is a whole lot of inflation there thanks to the leakage of all these reserves, among other reasons. 

We penned a special report back in September of 2009 on deflation.  At the time we caught plenty of flak from the “there must be inflation” crowd (you can view the report by clicking here). 

I remember Marc Faber was making the rounds when we penned out Deflation Rising report; he of course was telling everyone it was 100% guaranteed we would be witnessinghyperinflation because of quantitative easing.  I noticed since the stock market corrected a bit, Mr. Faber is again seeking out microphones and cameras, as usual, to share his doom.  So how did that short bond trade work out for you Marc?

And of course Jim Rogers was singing the praises of inflation which would no doubt lead to a never-ending bull market in commodities at the time; yup quantitative easy is sending us into the Weimar Republic land of runaway inflation good old Jim told us.  Food was where it was at.  How’s that long wheat trade working out for you Jim? Coincidently Jim has emerged from a summer hibernation to start pontificating again. 

The point is not to slam these two guys for being wrong (though it’s fun to do).  Both have been very right many times throughout their careers and have made a lot more money than I have.  But I share to make a point they and many others missed: debt matters when it reaches a critical level. It is about money AND CREDIT…not just money. 

Now some six-years after the credit crunch and what have our Best and Brightest in government and Central Banks wrought:  an even greater level of debt in the global economy.  I keep saying that if you made this stuff up no one would believe you. 

Some of the guys I like did get it right early on when it comes to deflationary forces in the economy; they included Gary Schilling, Bob Prechter, and my favorite of all Lacy Hunt.  These guys seem to do their thinking before they run in front of a microphone.  I don’t have numbers to back this up, but I would bet Lacy Hunt has been more right on the bond market for more time than any other financial economist in history.  The guy is plain brilliant in my humble opinion.  

That said, why re-create the wheel.  I have summarized some numbers from Lacy’s latest economic missive to show why monetary and fiscal policy has been an abject failure in this cycle and will lead to “discredit.” 

  • Real median household income stands at the same level it did seventeen years ago.
  • Econometric studies have shown that a country’s growth rate will lose about 25% of its ‘normal experience growth’ when combined public and private debt reach 250%-275% of GDP.  The US debt to GDP is about 334%.
  • The US is in better shape than Europe or Japan; their debt levels are 460% and 655% to GDP, respectively.   It helps explain why the US is growing faster than Europe and Japan, even though US growth is tepid at best and well below historical trends. 
  • Key point here: If the debt [created] is unproductive or counterproductive, meaning that a sustaining income stream is absent, or worse the debt subtracts from future income, then V [monetary velocity] will fall.  If debt is productive and produces an income stream to repay principal, then V [monetary velocity} rises.  [Auto and home loans are being pumped up again by lower credit standards—this is an example of unproductive debt.]
  • 1413911227978
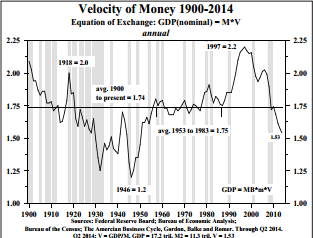
If we assume the equation:  Nominal GDP = Monetary Base x Monetary Velocity; then we how can we expect growth to be strong when money supply numbers globally are flat at best and monetary velocity is crashing through the floor?  [This is a global phenomenon, not just a US problem.]

“Contrary to widely held beliefs, the world has not yet begun to delever and the global debt-to-GDP is still growing, breaking new highs.” Further, it is a “poisonous combination” when world growth and inflation are lower than expected and debt is rising.  “Deleveraging and slower nominal growth are in many cases interacting in a vicious loop, with the latter making the deleveraging process harder and the former exacerbating the economic slowdown.” […as per Black Swan’s graphic in the chart on page two.]

And for those of you who still believe emerging markets will help pull us out of this muck, Lacy writes:

This research [Geneva Reports] also identifies two other highly significant trends. First, global debt accumulation was led by developed economies until 2008. Second, the debt build-up since 2008 has been paced by the emerging economies. The authors write that the rise in Chinese debt is especially “stunning”. They describe China as “between a rock (rising and high debt) and a hard place (lower growth).” In addition to China they identify India, Turkey, Brazil, Chile, Argentina, Indonesia, Russia and South Africa as belonging to the “fragile eight” group of countries that could find themselves in the unwanted role of host to “the next leg of the global leverage crisis.”

  • Increasing the flow of credit is extremely counterproductive when the fundamental problem is too much debt, and excessive debt can fuel asset bubbles.
  • Even as the monetary base exploded from $1.7 trillion in 2009 to $4.1 trillion today, and stock prices have soared, the US economy has experienced the worst economic expansion on record.
  • Rising relative yields and growth means more money will continue to flow to the United States.

As I read the news and various economic commentators, I get a feeling some have caught on, and many more are catching on, to the fact central bank and government fiscal policy has failed the real economy mightily.  And now we are faced with the prospect of clearing that debt, at some point.   Mr. Market being freed to clear away the dead wood of debt (malinvestment) is the “discredit” point Professor Kindleberger talks about in his appropriately named book: Manias, Panics, and Crashes. 

I leave you with this tidbit taken from Murray Rothbard’s masterpiece, The Great Depression; the comments that follow are from our Deflation Rising report back in 2009:

To prolong a Depression…

1)   Prevent or delay liquidation.  Lend money to shaky businesses, call on banks to lend further, etc.

2)   Inflate further.  Further inflation blocks the necessary fall in prices, thus delaying the adjustment and prolonging the depression.

3)  Keep wages up.  Artificially maintenance of wage rates in a depression insures permanent mass unemployment.

4)  Keep prices up.  Keeping prices above their free-market levels will create unsalable surpluses, and prevent a return to prosperity.

}5)  Stimulate consumption and discourage savings.  We have seen the more saving and less consumption would speed recovery; more consumption and less saving aggravate the shortage of capital even further.  As a matter of fact, any increase in taxes and government spending will discourage saving and investment and stimulate consumption, since government spending is all consumption.  Some of the private funds [taxed away] would have been saved and invested; all of the government funds are consumed.

The real threat is government’s attempts at a solution is not only prolonging, and possibly dooming, subpar global growth for years to come, but it could be sowing the seeds of yet another crisis, or double-dip recession.  This is especially dangerous when you consider central banks and global authorities are already running low on ammunition to counter the impact of deflationary pressures.

Nuff said!

Jack Crooks

President, Black Swan Capital

www.blackswantrading.com ,

info@blackswantrading.com

Twitter: @bswancap


Richard Russell: “The Moment of Truth is Here”

Expect An Avalanche Of Fiat Money Creation. The Fed and the central banks of the world will not tolerate deflation.

Already several members of the Fed have released feelers to the effect that QE should be extended into the future, and interest rates must be kept at zero.


This is what’s holding gold up in the face of global deflationary pressures. As I see it, we’ve arrived at the moment of truth. Will the central banks be successful in avoiding a deflationary depression? Or will manmade monetary creation keep us prosperous?

As I write, gold continues to advance. Technically, gold is on the handle of a cup and handle pattern. Gold is trading at 1244, with 1253 the point for an upside breakout…..continue Reading HERE

Gold at 6:37am PST 10/21/14 H=1254 L=1251.8 C=1253.3

Screen Shot 2014-10-21 at 6.36.44 AM

…continue Reading HERE

Everybody Now Bullish U.S. Dollar – So Expect a Powerful Contra-Move

Screen Shot 2014-10-21 at 7.16.54 AM

HAI: The U.S. dollar has been rising and hit a four-year high earlier this month. Is the dollar going to continue to rally from here?

Marc Faber : The trade and current account deficit of the U.S. has been coming down because the balance in the energy trade has improved a lot. The U.S. is almost oil self-sufficient. It’s become the largest crude oil producer in the world.

And even though the U.S. economy is not doing particularly well, it’s in a slightly better position than the European economy. Thus, there are some reasons the dollar should be stronger.

That said, based on sentiment figures, everybody is now bullish on the U.S. dollar. Usually when you have this kind of consensus, what can happen is a powerful contra-move. In other words, the dollar could weaken for a while. That would be good for stocks and precious metals.

Additionally, if the Fed finds that the dollar is too strong, it can print money. But you just don’t know what these academics will eventually decide to do. That’s why I recommend investors have a diversified portfolio, because nobody knows what the world will look like five years from now.

…related:

Marc Faber : Gold Has Bottomed

Oil Prices can go down for a While but won’t stay Down


test-php-789