
Timing & trends
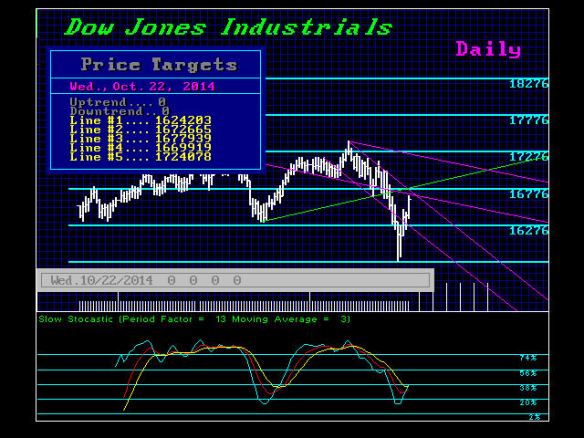
The resistance in the Dow Jones Industrial Index for today (Oct 22nd) stands in the mid 16700 zone on a technical basis. Targets in time for this week were Wed and Friday with the latter being the main target. ONLY a closing back above 17010 would signal that the low is in place for a broader term. This week should produce a reaction high. A closing on Friday at least below 16880 will keep the market in check. A closing BELOW 16660 will signal that a drop back into the week of Nov 3rd is possible with a new low.
Retail participation remains at record lows so this crash we will call the Rich Man’s Panic of 2014. The same trend is witnessed everywhere, including Asia and Europe. While the press was bashing the little guy saying he has missed the entire rally,
The stats show that the total size of the world stock market capitalizations closed 2013 at $54.6 trillion which was only
25% of the total world market capitalization – the rest being bonds.The bond market is larger than the stock market for various reasons. Whereas only corporations issue stocks, governments and corporations both issue fixed income securities. The U.S. Treasury is the largest issuer of bonds worldwide. Because U.S, Treasury bonds provide the bulk of reserves which are just over $30 trillion.
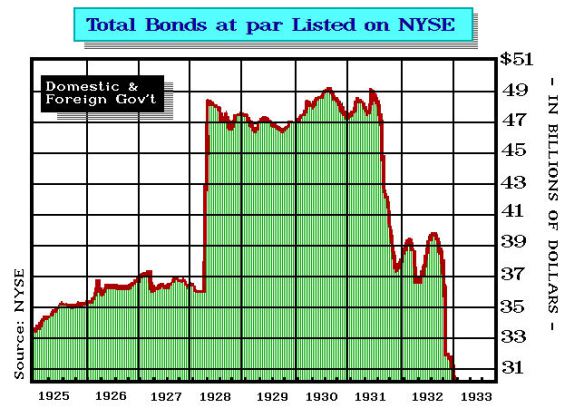
This is the real bond bubble. Capital is so accustomed to just hiding in bonds, it knows no other alternative. We can see that debt increased sharply in 1928. However, the collapse with the Sovereign Debt Crisis is what really made the Depression so Great. You can drop the stock market by 50% and you will not create a prolonged depression. Reduce the bond market by 33% and you get a depression.
 This is why Andrew Mellon first boasted during the 1929 that conservatives were not hurt – “Gentlemen buy bonds.” However, soon the Crash of 1929 turned into a serious Depression and that comes NOT by taking stocks down, but by wiping out the bond market.
In 1987 we predicted the low, and the very day of the low we stated the low was in place and new highs would be made by 1989. Just as at the low on this move I stated the low should hold temporarily. The numbers always define the market – NOT my personal opinion.
In 2011 even Barron’s reported that I was again warning new highs would be made and again they unfolded with the turn in the ECM. Each and every turn, even 1985 and 1998 in the middle of the Long-Term Capital Management Crisis, that low was followed by new highs BECAUSE the bond market was intact. Undermine the bonds, and then we have a crisis. If you do not look at absolutely all markets and how they function, you will be wrong. You simply CANNOT forecast anything be it gold, stocks, bonds, or commodities, unless you look at the interconnections and for that – sorry you need centuries of data not just back to 1971.
The central banks trying to stimulate the economy with lower interest rates have set the stage for the greatest crash of all time. You cannot imagine the bloodbath if interest rates go back to just 8% where they began this Phase Transition in bonds. We will see the worse economic bubble burst all over the street and this will be the real “GREAT” event of all time.
…related:


Investing is about piecing together different bits of information into an illustrative picture—sort of a Wall Street version of the connect-the-dots game we played in kindergarten.
That’s why the headline below from Bloomberg made my investment antennae stand up and motivated me to look for either confirmation that the real estate market was indeed slowing down or contrary evidence to explain if the weak summer sales numbers were just a temporary aberration.

What that Bloomberg article showed was that home prices in 20 US cities increased at the slowest pace in almost two years ending in July, rising at an uninspiring annualized pace of 0.5%. Those are, by the way, the worst numbers since November 2011.
That’s a change from the healthy real estate gains that we’ve seen for two years, and there are lots of other reasons to think that real estate is headed for a rough patch, if not downright trouble.
Warning Sign #1: Worrywart Homebuilders
You know who knows more about real estate than the Gucci-wearing loafers on Wall Street? The people swinging the hammers and putting their own capital on the line with every real estate project they start.
The National Association of Home Builders index of builder confidence dropped by five points from 59 in September to 54 in October.

Each of the index’s three components were sharply lower in October: the current sales conditions index fell 6 points to 57, expectations for future sales fell 3 points to 64, and traffic of prospective buyers dropped 6 points to 41.
Warning Sign #2: Widespread Use of Sales Carrots
Surveys are useful but far from perfect. A better gauge of builder sentiment is how many incentives—such as upgraded cabinets, wood floors, and high-end appliances—they’ll include to close a deal.
Make no mistake: builders don’t give away incentives unless they have to and builders are giving away tens of thousands of dollars in incentives to goose slumping sales.
“Incentives have increased because builders aren’t selling as well as they would like. … Rather than reducing prices (outright), they use incentives,” said John Burns of real estate research firm John Burns Real Estate Consulting Inc.
A Wells Fargo survey of 150 homebuilders reported that that percentage of builders using incentives rose to 26% from 17% in August of 2013 and 21% in July of 2014.
Homebuilder Lennar admitted that it gave away incentives worth $20,400 per house last quarter. Moreover, that $20,400 amounted to 5.8% of the sales price. That’s a heavy hit on profits!
Warning Sign #3: Sales Slowdown
In a recent report, Toll Brothers warned Wall Street that its sales are slowing. Its sales contracts dropped by 4% in the last quarter and it now expects to sell 5,300 to 5,500 homes this year, down from its previous high-end forecast of 5,850 homes.
Moreover, as the above chart shows, home appreciation is now nonexistent and is threatening to turn negative.
Warning Sign #4: Profit Plunge Next?
Slumping sales and stagnant real estate prices are the precursor to profit disappointment. “Construction of single-family homes has been weak,” said CBRE Global Chief Economist Richard Barkham.
The first homebuilder profit warning was just delivered by KB Home, who is selling fewer and fewer homes. KB Home delivered 1,793 homes last quarter, down from 1,825 delivered in the same period a year ago.

That translated into weaker profits. KB Home reported earnings per share (EPS) of $0.28 on $589.2 million of revenue; however, Wall Street was expecting $0.40 EPS and $646.76 million of sales.
Warning Sign #5: Watch the Real Estate Food Chain
There is a lot more to the real estate industry than just homebuilders—the furniture industry, for example.
Stanley Furniture just reported its quarterly results and delivered a loss of $2.3 million and 5.0% drop in sales.
“The demand for upscale wood residential furniture in the industry’s traditional channels of distribution remains relatively weak,” warned CEO Glenn Prillaman.
My vegetable farmer father was one of those people that thought real estate prices would never go down. The 2008 financial crisis and accompanying real estate crash proved that wasn’t the case and the growing number of worrisome data points are warning me that stocks in all the parts of the real estate food chain could be headed for trouble.
Tony Sagami
30-year market expert Tony Sagami leads the Yield Shark and Rational Bear advisories at Mauldin Economics. To learn more about Yield Shark and how it helps you maximize dividend income, click here. To learn more about Rational Bear and how you can use it to benefit from falling stocks and sectors, click here.

 We’ve all heard horror stories of Canadians in the US without travel or medical insurance.
What you may not know about are losses by Canadians who own US recreation or investment properties. Flash floods in Palm Springs and Arizona, wild fire and windstorm damage to name a few.
If you have questions about your US home, auto, travel or medical protection – we can help.
Call HUB’s toll free line 1-844-SNO-BIRD that’s 1-844-766-2473
Or CLICK HERE to email us with a suggested time you would like to be contacted by a HUB cross-border representative. Please include your phone # and hometown.

“Mining, processing, and pumping heavy oil sands from remote positions in Canada are much more costly than conventional oil and even shale oil in the U.S. While short-term operating costs are only around $40 per barrel, new projects need prices well above $90 per barrel to be in the money.”
U.S. oil production in the Eagle Ford, Bakken, and Permian could actually break even at just $60 per barrel
Much rides on the decision making of officials in Saudi Arabia with costs at only $25 per barrel. Background in following article – Money Talks Ed.
Low Oil Prices Hurting U.S. Shale Operations
Slumping oil prices are putting pressure on U.S. drillers.
The number of active rigs drilling for oil and gas fell by their most in two months, according to the latest data from oil services firm Baker Hughes. There were 19 oil rigs that were removed from operation as of Oct. 17, compared to the prior week. There are now 1,590 active oil rigs, the lowest level in six weeks.
“Unless there’s a significant reversal in oil prices, we’re going to see continued declines in the rig count, especially those drilling for oil,” James Williams, president of WTRG Economics, told Fuel Fixin an interview. “We could easily see the oil rig count down 100 by the end of the year, or more.”
Baker Hughes CEO Martin Craighead predicted that U.S. drilling companies could begin to seriously start removing rigs from operation if prices drop to around $75 per barrel. Some of the more expensive shale regions will not be profitable at current prices. For example, the pricey Tuscaloosa shale in Louisiana breaks even at about $92 per barrel.
 But that also reflects the high costs of starting up a nascent shale region.
Much of the shale basins that are principally responsible for America’s oil production will not feel the effects of low prices as quickly as many are predicting.
Better-known shale formations, such as the Eagle Ford in South Texas, can break even at much lower prices. That’s because exploration companies have become familiar with the geology and fine-tuned drilling techniques to specific areas.
Productivity gains have allowed drillers to extract more oil for each rig it has in operation. For example, in North Dakota’s prolific Bakken formation, an average rig is producing over 530 barrels per day from a new well in October. Less than two years ago, that figure sat at around 300 barrels per day. Extracting more barrels from the same operation improves the economics of drilling, which means shale producers are not as vulnerable to lower prices as they used to be.
Another factor that could insulate U.S. oil production is that companies also factor in sunk costs. That is, if they have already poured in millions of dollars into purchasing land leases and securing permits, throwing in a little extra money to drill the prospect is probably the rational thing to do even at current prices. It is only projects in their infancy that may not be economically feasible.
This should delay the drop in rig count, and delay the drop in overall U.S. oil production. As the Wall Street Journal notes, given these assumptions, U.S. oil production in the Eagle Ford, Bakken, and Permian could actually break even at just $60 per barrel.
Much rides on the decision making of officials in Saudi Arabia. Although exact calculations vary, the world’s only swing producer needs oil prices between $83 and $93 per barrel for its budget to break even. But that may not be as important of a metric as it appears. Saudi Arabia has an enormous stash of foreign exchange, and could run deficits for quite a while without too many problems. With average costs of oil production from wells in the Middle East sitting at only $25 per barrel, the Saudis can clearly wait out U.S. shale if they really want to.
But it may actually be Canada’s oil sands that end up being the first victim, the Wall Street Journal reports. Mining, processing, and pumping heavy oil sands from remote positions in Canada are much more costly than conventional oil and even shale oil in the U.S. While short-term operating costs are only around $40 per barrel, new projects need prices well above $90 per barrel to be in the money.
Rig counts are starting to drop, but due to the long lead time for most oil projects, it could be a while before production begins to decline in a significant way. What happens next will be largely determined by the outcome of the next OPEC meeting in Vienna on Nov. 27, where all eyes will be on Saudi Arabia.
By Nick Cunningham of Oilprice.com

-
I know Mike is a very solid investor and respect his opinions very much. So if he says pay attention to this or that - I will.
~ Dale G.
-
I've started managing my own investments so view Michael's site as a one-stop shop from which to get information and perspectives.
~ Dave E.
-
Michael offers easy reading, honest, common sense information that anyone can use in a practical manner.
~ der_al.
-
A sane voice in a scrambled investment world.
~ Ed R.
Inside Edge Pro Contributors

Greg Weldon

Josef Schachter

Tyler Bollhorn

Ryan Irvine

Paul Beattie

Martin Straith

Patrick Ceresna

Mark Leibovit

James Thorne

Victor Adair