
Stocks & Equities
The main U.S. stock market indexes were virtually flat on Friday, as investors continued to hesitate following recent advance, despite some important economic data releases.
Briefly: In our opinion, no speculative positions are justified.
Our intraday outlook is neutral, and our short-term outlook is neutral:
Intraday (next 24 hours) outlook: neutral
Short-term (next 1-2 weeks) outlook: neutral
Medium-term (next 1-3 months) outlook: neutral
Long-term outlook (next year): bullish
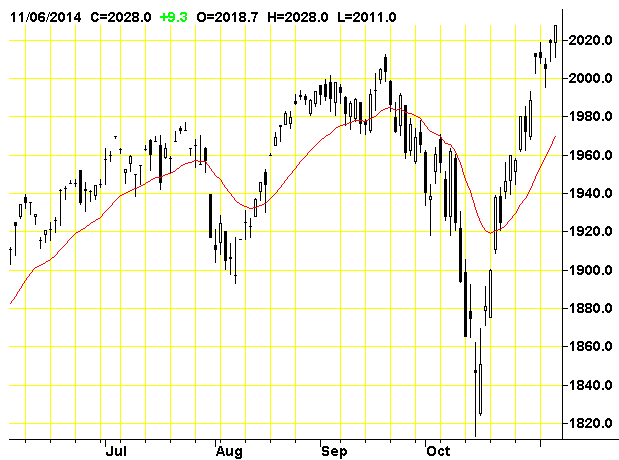
Our Friday’s neutral intraday outlook has proved accurate. However, the S&P 500 index has managed to reach yet another new all-time high at the level of 2,034.26. The nearest important level of resistance is at around 2,030-2,035. On the other hand, the support level is at 2,020, marked by previous high, and the next support level is at around 2,000. There have been no confirmed negative signals so far, however, we can see some overbought conditions which may lead to a downward correction:

Expectations before the opening of today’s trading session are slightly positive, with index futures currently up 0.1-0.2%. The European stock market indexes have gained 0.3-0.5% so far. The S&P 500 futures contract (CFD) trades along the level of 2,025. The nearest important resistance level remains at around 2,035, and support level is at 2,020, among others:

The technology Nasdaq 100 futures contract (CFD) extends its short-term consolidation, as it fluctuates along the level of 4,160. The resistance level is at 4,180, marked by local highs, and support level remains at 4,120-4,140, as we can see on the 15-minute chart:

Concluding, the broad stock market extends its short-term consolidation, following recent move up. There have been no confirmed negative signals so far. However, we can see some short-term overbought conditions which may lead to a downward correction at some point in time. We still prefer to be out of the market, avoiding low risk/reward ratio trades. We will let you know when we think it is safe to get back in the market.
Thank you.

 There is a saying: “The rich just keep getting richer”. And by all accounts, since the 2008 financial crisis, they have. Unfortunately, for the struggling poor and middle class, wealthy asset holders have been the only beneficiary of six years of Federal Reserve easy-money policies. Under the tutelage of Ben Bernanke, the Fed introduced QE in March of 2009 with the hope it would save the economy from economic collapse. The goal was to create a new vibrant market for borrowing to replace the former vibrant market for borrowing that had just blown up, taking the economy with it. I am sure Ben Bernanke began this ruse with good intentions and the misplaced belief that real economic prosperity could be manufactured from creating new money.
But as they say, hind sight is 20-20, and here we sit six years and 3.5 trillion dollars later with the realization this money printing scheme did not work as planned. Don’t just take my word for it. According to Wall Street Journal, Former Fed Chairman Alan Greenspan said the QE program had failed to achieve its primary goals. As a means of boosting consumer demand, the asset purchase program, he said, “has not worked,” though it did a good job of increasing asset prices.
Bond king Bill Gross agrees, noting that the roughly $7 trillion pumped into the financial system since the financial crisis by the world’s three biggest central banks has succeeded mostly in lifting asset prices rather than workers’ wages: “Prices go up, but not the right prices.”
And Hedge fund manager Paul Singer recently noted “The inflation that has infected asset prices is not to be ignored just because the middle-class spending bucket is not rising in price at the same rates as high-end real estate, stocks, bonds, art and other things that benefit from quantitative easing.”
Why QE Hasn’t Worked
The U.S. Government has done a splendid job of continuing its borrowing spree, as Federal debt has increased from $9.2 to $17.9 trillion. But if we learned any lessons from these last few years, it should be that government borrowing and spending in the form of transfer payments (such as food stamps) doesn’t grow an economy.
The Fed hoped that printing $3.5 trillion would encourage private companies to borrow money and grow their business by investing in property, plant and equipment. Unfortunately, growth doesn’t happen in a vacuum. With the consumer tapped out, business was more realistic about demand. The idea that low interest rates and available credit would spur growth similar to what we saw in the 1990’s with the technology boom did not manifest. Therefore, instead of borrowing at low rates to grow their businesses, many companies just took on cheap debt and bought back stock–growing their EPS but not the economy. This kept the “beat the expectation” crowd on Wall Street happy but did nothing to encourage sustainable growth.
Central banks have failed to realize that lasting economic growth only comes from real savings and investment, which leads to an increase in labor hours and productivity. The government’s borrowing and printing scheme left the banking system intact, but did nothing to help the average consumer. While the Fed was frantically printing money to re-inflate asset prices, the majority of American’s incomes have decreased, as real after tax income has actually fallen by -5.9%. In fact, in this recent election, we learned 65% of Americans are still primarily concerned with the economy, and nearly the same amount believe they are worse off since the great recession began. This is despite manipulated data from the Federal Government meant to persuade them otherwise.
With the prospect of viable economic growth pushed further out of reach and the Federal Reserve out of the QE game, deflationary forces should prevail and equity prices should be falling. But, if there is one thing Central Banks are famous for, it’s not learning from past mistakes. Fittingly, taking a page from the hyperinflationary playbook, Japan has gone on a kamikaze mission to destroy its currency; announcing an escalation of its bond purchase rate to $750 billion per year. In addition to this, Japan’s state pension fund (the GPIF), intends to dump massive amounts of Japanese government bonds (JCB’s) and double it allocation to equities, raising its investment in domestic and international stocks to 24% each. The BOJ is also planning on tripling its annual purchase of ETFs and other equity securities. Japan has taken the baton from Yellen and will run with it until the nation achieves runaway inflation and its currency is completely destroyed.
Central bankers across the globe have succeeded in hallowing out the middle classes, but have failed miserably in achieving viable growth. This game will continue until the inevitable currency collapse unfolds and investors lose faith in government-manipulated asset prices. The tsunami resulting from currency, sovereign debt and equity market destruction will soon begin rolling in Japan. The problem is that Japan isn’t some isolated banana republic — it is the world’s third largest economy. When its currency collapses it will wipeout worldwide markets and economies as well. And then, hopefully, investors will insist on putting their faith and wealth in money that can’t be destroyed by a handful of unelected and unaccountable government hacks.
Signs Of The Times
“Russia scrapped its second bond auction after the ruble’s retreat spurred bets that interest rates will increase.”
– Bloomberg, October 21.
“Russia’s international reserves shrunk for a ninth week, tumbling $7.9 billion in a little more than five months.”
– Bloomberg, October 23.
That week crude was trading at 84, nine weeks earlier it was trading at 98.
Recently it has been below 80.
“Russian tycoons seek to trim debt as [weakening] commodity demand hits values of holdings.”
– Bloomberg, October 28.
“Americans are less concerned than ever about another 1930-like Depression.”
– Rasmussen, October 23.
The numbers were that 27% thought it was “somewhat likely” and 62% polled “unlikely”. The report included that the poll was “more closely divided in 2009”.
And now for something completely honest – stupid but honest!
“Hillary: ‘Don’t Let Anybody Tell You That Businesses Create Jobs’ “
– Breitbart, October 24.
Perspective
While the stock market gets most of the attention during a boom, we all know it is not an isolated phenomenon. We have been talking about the connections to the credit markets, but the culmination of a bull market seems to be part of a universal euphoria.
On the stock side this showed up as a very low number of only 13.3% bears, the lowest since 1987. On the social side it shows up in this week’s Conference Board’s Consumer Confidence number. From 89.0 in September it soared to 94.5. This is not only a big jump, it is the highest reading since October 2007.
The low at its worst in 2009 was 39.8.
The University of Michigan’s Consumer Sentiment number for October rose from 84.6 to 86.4, which is the highest since July 2007.
The low in 2009 was around 56.
Perhaps there is a new economic law. Consumer confidence is inversely proportional to interest rates. Well, it must hold for central bankers as well.
Stock Markets
Some have attributed the stock market rebound to a bullish utterance by James Bullard, a normally “hawkish” Fed employee. As interpreted by the street, the Fed was getting concerned about the severity of the correction. At less than 10%, this was severe?
This is ironical as we have never been impressed by the school of research that imagines what the Fed would do given whatever the current circumstances are. The problem with this school is that every swing in the stock market, including every irresistible transition from boom to recession has to be rationalized in FedSpeak. In the 1970s the belief was that recessions were deliberately induced to bring the rate of CPI inflation down. Well, you had to be there.
Initial selling pressure set the low for the S&P on September 16th and our ChartWorks of the next day noted the excesses on the plunge in JNK had become acute.
This prompted the relief rally and the next Pivot noted that the volatility has changed from huge Daily swings to equivalently huge Weekly swings. We have been thinking that this “Weekly” swing is getting overdone.
This has shown up in last Friday’s Inverted Springboard readings in both JNK and the S&P. As noted in Monday’s “Volatility To Resolution” piece, the sharply overbought condition seems to be leading to the expected big test in November.
The most obvious S&P targets are the lows with the last hit. These are 1860 set on the October 16th close. On the extreme it could hit 1820, which was the intra-day low. Our theme since September has been the transition from Exuberance to Divergence to Volatility to Resolution. History has made it past the first three and is working on the Resolution to another outstanding financial mania.
On the way to the Resolution, the S&P seems to be within Ross’s “ABC” rally pattern.
Credit Markets
The Inverted Springboard signal on JNK was likely to have some effect this week. The index, without interest payments, set its rebound high at 40.56. This was at the 50-Day ma and the price has slipped to 40.30. This ma was also effective on the September rebound to 40.79.
The low close on the sharp setback in June 2013 was 38.72, which looks like a reasonable target for this hit. The low close on this decline was 39.22.
Whether this will be sufficient to correct the excesses of the biggest bond bubble in history remains to be seen. At any rate we have been out of the play since the big overbought in June.
Over in Europe the excesses have also been wondrous. Understandably, as central bankers, institutions and retail have all been speculating. The ECB, in so many words, has been “pounding the table” on bonds.
This drove the yield on Greek bonds down to 5.55% in June. This broke out at 6.69% in September and in a panic soared to 8.89% in the middle of the month. The retreat was to 7.34% on the 24th and it has increased to 8.18% today. Breaking above 8.89% would have serious implications.
In the middle of the month, Russian yields broke out at 9.90% and they reached 10.22% yesterday. The post-crisis low was 6.53% set in March 2013 and the crisis high was 12.90% set in February 2009. The chart follows.
The bond future can rally on the next decline in equities.
Commodities
Many commodities have rallied out of the oversold for the stock market.
Grains (GKX) have recovered well. The low was 290 and last week we noted that if the rise got through resistance at 310, the rally could run into the spring. That was accomplished on Friday and at 320, the index is comfortably above the 50-Day ma. In getting above 325, the move could make it to the 200-Day at 355. This seems to be the best chance for a rally since January.
On base metals (GYX) we have been looking for copper to lead us down to a tradable low in November. The low for the index was 340 on the low day for the S&P and metals rallied to 358 and stopped at the 50-Day ma.
The low needs to be tested and this could be accomplished on a seasonal low sometime within the next four weeks.
Crude oil has been likely to find a seasonal low in December, but the bounce with the stock market has taken it from 78.65 to 82.51 yesterday. The next low could set up a tradable rally.
Precious Metals
This week’s slump in the sector seems tied to the rebound in stocks and low-grade bonds.
Commodities rebounded as well giving our Gold/Commodities index a needed correction.
Otherwise, gold’s real price has been rising since June and we take this as the early stages of a cyclical bull market. This will eventually drive share prices up.
When will the latter start?
We had thought that the buying opportunity would be found towards the end of this month. Last week we still thought that the time had not arrived.
The HUI has extended its decline from 251 in June to 166 today. The cyclical high was 638 in 2011. It is worth mentioning that we use momentum on the silver/gold ratio to determine important tops. In 2011 the RSI soared to 92 when we noted that level had not registered since the magnificent blow-off in January 1980. We advised that speculation had reached a “dangerous” level.
The main force on the sector has been that it has been in a cyclical bear while the orthodox world has been in a cyclical bull.
This is in transition.
Another “Rotation” in most commodities seem possible and this would help precious metal stocks.
Iron Ore Prices
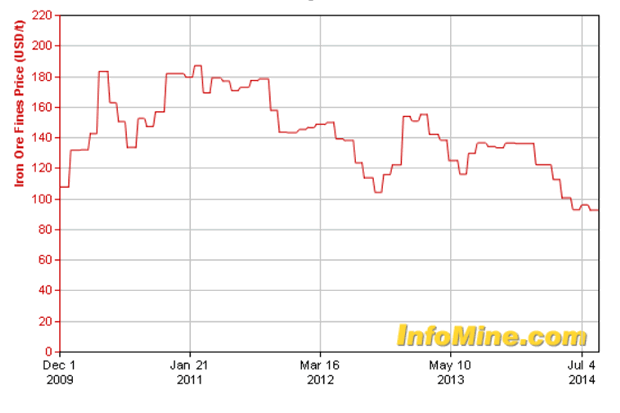
- The cyclical high was set in March 2011.
- This occurred with the cyclical peak in many commodities.
- Our proprietary model, the Momentum Peak Forecaster, gave a rare “Sell” that fateful April.
- The model does not provide “Buys” and it is uncertain when the general bear market will end.
Russia Ten-Year Note Yield

- Yields in Russia have been rising since the low of 6.50% in May 2013.
- Of interest is that it was a seasonal low with the rush of enthusiasm that can run into May-June.
- This was also the case with the decline from 9.52% to 8.38% in May of this year.
- This year’s breakout level was at 9.85% and that was accomplished on October 10th.
- This was a warning on most lower-grade bonds and the yield is now at 10.22%, which hasn’t been seen since 2009.
How Can Europe Service Its Debt Bubble?
Link to October 31st Bob Hoye interview on TalkDigitalNetwork.com: http://talkdigitalnetwork.com/2014/10/japan-injects-surprise-stimulus-to-world-markets

As a general rule, the most successful man in life is the man who has the best information
Demand
Global gold demand was 964t in Q2 2014, significantly reduced from the record high in Q2 2013.
ETF outflows slowed sharply.
Central Banks continued to buy gold for the 14th consecutive quarter in Q2 2014. CB’s purchased 118t in Q2 2014 up 28% over Q2 2013. The announcement of a fourth CBGA in the second quarter also reiterated that sales will not be forthcoming from some of the largest holders.
Jewellery demand weakened year-on-year, but the broad, 5-year uptrend remains intact. Jewellery accounted for 53% of gold’s global demand and is by far and away the anchor of gold’s market.

World Gold Council
Supply
China is the largest producer in the world, accounting for around 14 per cent of total production. East Asia as a whole produces 21 per cent of the total newly-mined gold. Latin America produces around 18 per cent of the total, with North America supplying around 15 per cent.
Around 19 per cent of production comes from Africa and 5 per cent from Central Asia and Eastern Europe.
Recycling accounts for around one third of the total supply of gold.
Thanks to the World Gold Council you now know where gold comes from, whose buying it and what they use if for.
Deeper into the #’s
Gold comes from three sources:
- Central Banks – sales stopped and are staying stopped.
- Recycling – mostly flat in 2014.
- Mining
Global gold demand across all sectors in 2013 was 4,065.60t.
The top 2013 six gold producing countries – China 420t, Australia 227t, U.S. 226t, Russia 220t, Puru 150t, South Africa 145t and Canada 120t – together produced 1,653.00t.
Other top gold producing countries include Mexico 100t, Ghana 85t, Brazil 75t, Indonesia 60t and Chili 55t.
According to GFMS estimates total gold mine supply reached 2,982 tonnes in 2013, up 4.1% from 2012.
High grading & refocusing
Two mostly unrecognized influences are at work in the global gold market, unsustainable production levels and a shifting of demand focus.
Many miners are processing greater quantities of ore to maintain revenue and contain costs at today’s lower gold prices.
It’s also very possible some companies are focused on solely mining the higher grade portions of their mines. The result is higher production and lower costs over a short term, but it is not sustainable and means a much higher gold price is needed to economically mine the lower grades left.
The focus of the gold industry is shifting east.
The key driver of gold’s price over most of the last decade was institutional investors buying gold bullion through exchange-traded funds (ETF). That changed in 2013 with investors dumping 800t or 31m ozs.
On the other side of the trade was an enormous physical, almost insatiable, gold demand coming from Asia. According to GFMS China imported unprecedented amounts of gold from the rest of the world and became the world’s largest consumer of jewellery last year, with demand rising 30% to 724 tonnes.
The quest for gold
Here’s a few facts from SNL Metals & Mining’s 2014 edition of ‘Strategies for Gold Reserves Replacement.’
Over the past two dozen years mining companies have discovered 1.66 billion ounces of gold in 217 major gold discoveries. That’s a lot of gold!
But it wasn’t enough – there were 1.84 billion ounces produced over the same period. That’s a shortfall of 180 million ounces of gold for reserve replacement over the 24 year period or a shortfall of 7.5m ozs a year.
The amount of gold discovered and the number of major discoveries has been trending downward – from 1.1 billion ounces in 124 deposits discovered during the 1990s to 605 million ounces in 93 deposits discovered since 2000.
“The amount of potential production from these major discoveries is particularly concerning when looking at the discoveries made in the past 15 years. Assuming a 75% rate for converting resources to economic reserves and a 90% recovery rate during ore processing, the 674 million ounces of gold discovered since 1999 could eventually replace just 50% of the gold produced during the same period.
However, considering that only a third of the discovered gold has been upgraded to reserves or has already been produced, and that many of these deposits face significant political, environmental or economic hurdles, the amount of gold becoming available for production in the near term is certainly much less.
Between 1985 and 1995, 27 mines with confirmed discovery dates began production an average of eight years from the time of discovery. The time from discovery to production increased to 11 years for 57 new mines between 1996 and 2005, and to 18 years for 111 new mines between 2006 and 2013.
The length of time from discovery to production is expected to continue trending higher: 63 projects now in the pipeline and scheduled to begin production between 2014 and 2019 are expected to take a weighted-average 19.5 years from the date of discovery to first production.” Kevin Murphy, mining.com
Conclusion
The production of mined gold remains well below market demand. As long as demand exceeds mined supply how can gold’s bull run be over? Your author doesn’t believe it can be.
The best way to profit is to buy when everyone else has sold and assets are at rock bottom prices. That would be now.
Your best bet for high returns will be to invest in junior resource companies.
After all, they find the deposits, so they own the world’s future mines, yeah that’s right, junior resource companies own the gold the gold miners need to replace their reserves.
Why don’t we all ignore the endless bombardment of economic white noise spewing from mainstream media outlets and instead concentrate on gold’s fundamental supply problems?
I’ve got a couple promising junior gold companies on my radar screen. Do you have a few on yours?
If not, maybe you should.
Richard (Rick) Mills
Richard lives with his family on a 160 acre ranch in northern British Columbia. He invests in the resource and biotechnology/pharmaceutical sectors and is the owner of Aheadoftheherd.com. His articles have been published on over 400 websites, including:
WallStreetJournal, USAToday, NationalPost, Lewrockwell, MontrealGazette, VancouverSun, CBSnews, HuffingtonPost, Beforeitsnews, Londonthenews, Wealthwire, CalgaryHerald, Forbes, Dallasnews, SGTreport, Vantagewire, Indiatimes, Ninemsn, Ibtimes, Businessweek, HongKongHerald, Moneytalks, SeekingAlpha, BusinessInsider, Investing.com and the Association of Mining Analysts.
Please visit www.aheadoftheherd.com
If you are interested in sponsoring Richard’s site please contact him for more information, rick@aheadoftheherd.com
***
Legal Notice / Disclaimer
This document is not and should not be construed as an offer to sell or the solicitation of an offer to purchase or subscribe for any investment.
Richard Mills has based this document on information obtained from sources he believes to be reliable but which has not been independently verified.
Richard Mills makes no guarantee, representation or warranty and accepts no responsibility or liability as to its accuracy or completeness. Expressions of opinion are those of Richard Mills only and are subject to change without notice. Richard Mills assumes no warranty, liability or guarantee for the current relevance, correctness or completeness of any information provided within this Report and will not be held liable for the consequence of reliance upon any opinion or statement contained herein or any omission.
Furthermore, I, Richard Mills, assume no liability for any direct or indirect loss or damage or, in particular, for lost profit, which you may incur as a result of the use and existence of the information provided within this Report

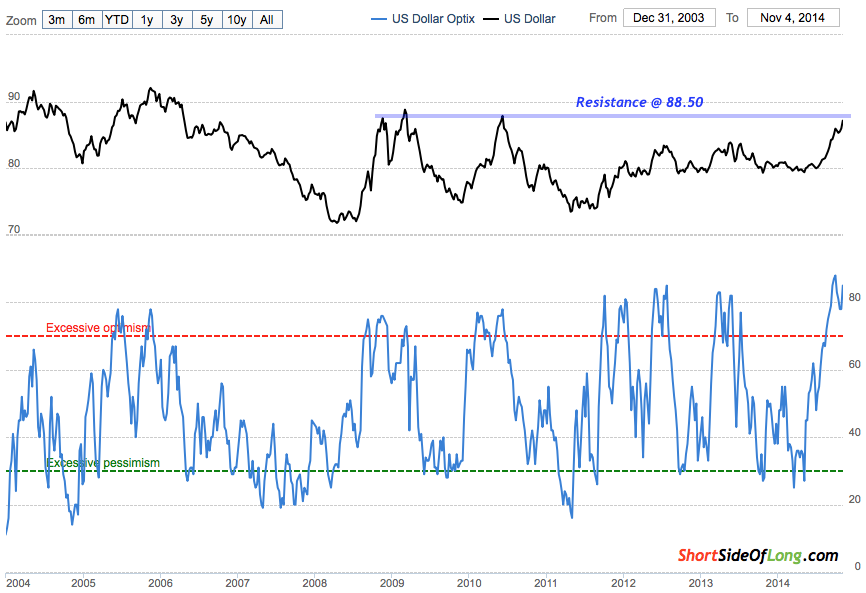
US Dollar Could Correct
Since the start of the Northern Hemisphere summer, a major theme within the global financial market movements has been the strength in the United States Dollar. Being a global reserve currency, a rise in the greenback tends to have major implications for the rest of the world. In recent months we’ve seen weakness in shares around the world, we’ve seen commodities dropping like a rock and we’ve seen global currencies under heavy pressure. Majority of these assets have now become oversold from the short term perspective, especially Precious Metals discussed on the blog in yesterdays post (if you haven’t read it yet, click here).
Chart 1: Hedge funds & other speculators are all on one side of the boat

Source: Short Side of Long
US Dollar Index has gone up almost vertically, with major catalysts being divergence in monetary policies by major central banks. Federal Reserve has ended its recent round of Quantitate Easing, while European Central Bank is just starting its QE engine and Bank of Japan continues to remind the market that they will “print unlimited amounts of money”.
Price wise, we now have the Dollar Index reaching tis major resistance zone around 88.50. These levels were major selling points during the Global Financial Crisis of 2008 and the Eurozone Crisis and Greek Bailout in 2010. All of this is occurring while hedge fund positioning reaches net long extremes, as everyone is now on one side of the boat (refer to Chart 1). Simultaneously, confirming this outlooking is variety of sentiment surveys showing that just about everyone is a bull on the King Dollar (refer to Chart 2).
Chart 2: King Dollar is favourite currency of global investors right now!
Source: SentimenTrader (edited by Short Side of Long)
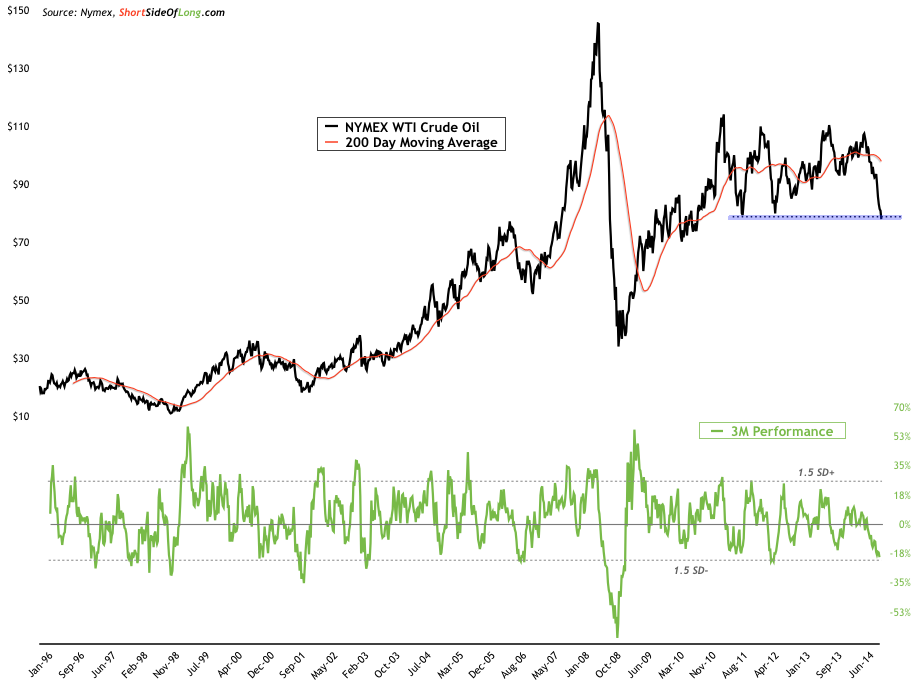
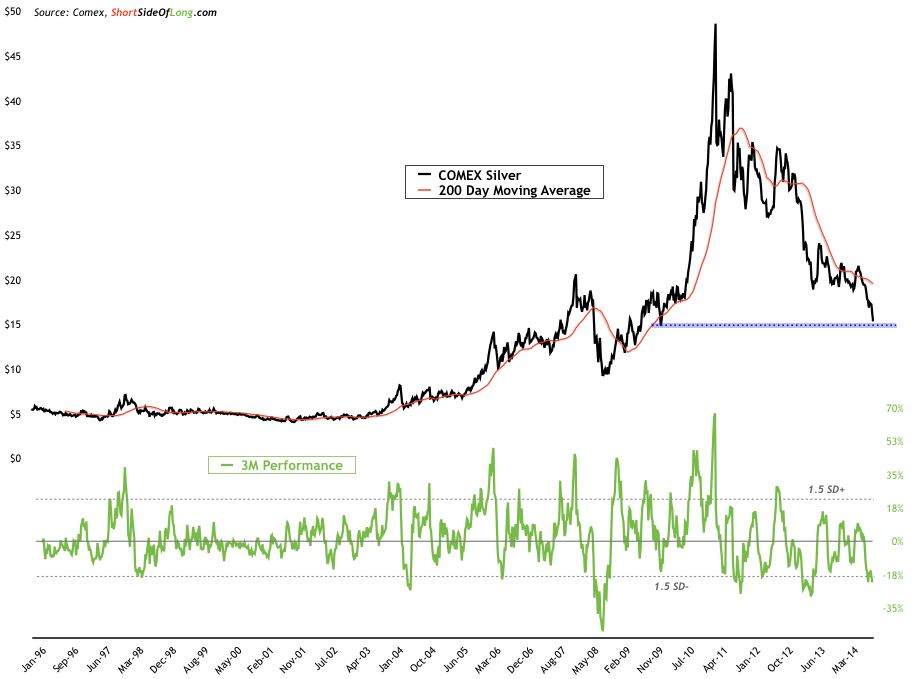
So with the Dollar being a favourite currency of global investors, just as equally the opposite side of that trade has very much suffered. Various inflation assets such as Euro, Crude Oil or Silver (just to name a few) have been beaten down within the same time frame. Therefore, it should not be a surprise that these assets have now reached major support zones (refer to Charts 3, 4 & 5), on extreme oversold conditions. As just as the Dollar happens to be everyones favourite investment right now, sentiment on these assets is negative with investors liquidating and running for the hills.
You shouldn’t positioning yourself based on what I think in this article. The bottom line for me is that I remain fully hedged in Silver, continue to hold naked short positions on Gold (giving my a net short PMs exposure) and remain in US Dollars for all my cash holdings. If you have been following the blog and the newsletter, you would have noticed that I opened these positions in July of this year.
While I am not yet closing these positions (I expect more Dollar strength next year), if I was a short term trader, I would be careful of a counter trend to occur for awhile. There are a huge number of Dollar bulls and a shake out could occur at anytime. In this case scenario US Dollar would correct and various stock markets (especially EU & GEMs), commodities and foreign currencies would rebound.
Chart 3, 4 & 5: Just as equally various inflation assets are now oversold!


-
I know Mike is a very solid investor and respect his opinions very much. So if he says pay attention to this or that - I will.
~ Dale G.
-
I've started managing my own investments so view Michael's site as a one-stop shop from which to get information and perspectives.
~ Dave E.
-
Michael offers easy reading, honest, common sense information that anyone can use in a practical manner.
~ der_al.
-
A sane voice in a scrambled investment world.
~ Ed R.
Inside Edge Pro Contributors

Greg Weldon

Josef Schachter

Tyler Bollhorn

Ryan Irvine

Paul Beattie

Martin Straith

Patrick Ceresna

Mark Leibovit

James Thorne

Victor Adair