
Stocks & Equities
The Chart of the Day from two weeks ago illustrated which sectors have performed best since the June 2014 peak in crude oil prices. Today’s chart presents the long-term trend of the best performing sector on the aforementioned chart — the biotechnology sector (i.e. iShares Nasdaq Biotechnology — IBB). As today’s chart illustrates, biotech stocks began to rally in early 2009 as the financial crisis induced bear market concluded. Then in August 2011 the rally in biotech stocks picked up and has traded within the confines of a relatively steep upward sloping trend channel ever since. In fact, IBB is up over 240% since its 2011 lows — quite a healthy return for a 40 month timeframe.

Quote of the Day
“There is a tendency for things to right themselves.” – Ralph Waldo Emerson
Events of the Day
December 21, 2014 – First day of Winter (Northern Hemisphere)
December 25, 2014 – Christmas Day
December 26, 2014 – Kwanzaa (1st day)
Stocks of the Day
— Find out which stocks investors are focused on with the most active stocks today.
— Which stocks are making big money? Find out with the biggest stock gainers today.
— What are the largest companies? Find out with the largest companies by market cap.
— Which stocks are the biggest dividend payers? Find out with the highest dividend paying stocks.
— You can also quickly review the performance, dividend yield and market capitalization for each of the Dow Jones Industrial Average Companies as well as the performance of the Dogs of the Dow.
Mailing List Info
Chart of the Day is FREE to anyone who subscribes. Just go HERE
Notes:
Where should you invest? The answer may surprise you. Find out right now with the exclusive & Barron’s recommended charts of Chart of the Day Plus.

If you wait by the river long enough, the bodies of your enemies will float
by Sun Tzu, The Art of War, fifth century BC
In The Price of Gold and the Art of War, Part I and in this Part II, the author explained how the bankers’ war on gold forced down the price of gold between 1980 and 2000. This is a brilliant short summary of the Centrall Banks action to date in simple terms that can readily be understood by most observers – Editor Money Talks
The Price of Gold and the Art of War Part III
When growth slows in capital markets, the bankers’ daisy-chain of credit and debt breaks down; setting in motion defaulting debt which ends in recession, deflation or, in extreme cases, a deflationary depression.
A deflationary depression is a fatal monetary phenomena where the velocity of money—circulating credit and debt—falls so low capital markets are no longer self-sustaining. This happens after the collapse of massive speculative bubbles such as the collapse of the 1929 US stock market bubble which resulted in the world’s first deflationary depression, the Great Depression of the 1930s.
Throughout history, gold and silver have offered safety in times of economic chaos. Today is no different. What is different is the response of governments and bankers to the collapse of the current economic paradigm—the bankers’ war on gold.
In the midst of the Great Depression, the US passed the 1934 Gold Reserve Act which prohibited the ownership of gold by US citizens, forcing Americans to keep their wealth invested instead in capitalism’s paper assets.
The Gold Reserve Act outlawed most private possession of gold, forcing individuals to sell it to the Treasury, after which it was stored in United States Bullion Depository at Fort Knox and other locations. The act also changed the nominal price of gold from $20.67 per troy ounce to $35. This price change incentivized foreign investors to export their gold to the United States, while simultaneously devaluing the U.S. dollar in an attempt to spark inflation.
http://en.wikipedia.org/wiki/Gold_Reserve_Act#U.S._economic_historical_narrative
The attempt to ‘spark inflation’ in order to overcome a deflationary depression is the 1930s version of today’s similarly futile ‘inflation-targeting’. The resultant rise in the consumer price index from 1934-1937 was only nominal and, by 1938, powerful deflationary pressures had again re-exerted themselves and the US and the world would remain mired in a moribund deflationary depression for the remainder of the decade.

Although the devaluation of the US dollar against gold by the Gold Reserve Act didn’t ‘spark’ the inflation bankers hoped would end the 1930s depression, it would cause large amounts of gold to flow into the US Treasury after 1934 as foreign sellers took advantage of the US Treasury’s offer of a 70% higher price for gold.

In 1944, this unprecedented flow of gold to the US allowed the US to make the dollar fully convertible to gold, officially making the US dollar the world’s reserve currency at Bretton-Woods. However, due to excessive military spending, the US would overspend its entire hoard of gold by 1970, forcing the US to suspend the gold backing of the US dollar in 1971.
When the US ended the gold convertibility of the US dollar, the US also set in motion capitalism’s end game; as the removal of the bankers’ golden fetters (which previously tied money creation to gold reserves) now allowed governments and banks the fatal freedom to print money and create credit without limits.

http://www.financialsensearchive.com/fsu/editorials/bms/2006/0511.html
The final link between the dollar and gold was broken. The dollar became nothing more than a fiat currency and the Fed was then free to continue monetary expansion at will. The result… was a massive explosion of debt.
John Exter quoted in Gold Wars, Ferdinand Lips, Foundation for the Advancement of Monetary Education, New York, 2001
It was the explosive growth of money and credit after 1971 that would set in motion Ludwig von Mises’ ‘crack-up boom’. Excessive money printing and credit creation would lead to a series of larger and larger speculative bubbles which inevitably would culminate in monetary chaos.
The credit boom is built on the sands of banknotes and deposits. It must collapse… If the credit expansion is not stopped in time, the boom turns into the crack-up boom; the flight into real values begins, and the whole monetary system founders.
Ludwig von Mises, Human Action, 1949
GOLD AND DEFLATIONARY DEPRESSIONS
Although the ownership of gold by US citizens was outlawed in 1934, the shares of Homestake Mining, the world’s largest gold mining company, acted as a proxy for gold during the Great Depression giving investors the same protection gold has given throughout history in times of monetary distress.
[Shares in] Homestake Mining.. rose from $65 per share in 1929 to more than $300 per share in 1933 and then climbed to a $480 bid and $534 ask in December of 1935…During the next six years after the 1929 stock market crash, Homestake Mining paid out a total of $128 in cash dividends. Its dividend in 1929 was $7 per share which then climbed to a staggering 1935 dividend of $56 per share…Homestake Mining earned a compound rate of return of 35% per year from 1929 thru 1935, excluding dividends.[bold, mine]
http://www.worststockmarketcrashes.com/featured/homestake-mining-after-the-1929-crash/
Today, the world is on the verge of another, even greater deflationary depression than the 1930s Great Depression. But governments and bankers have pooled their considerable resources to hide that truth from the public in order to protect their vast wealth and power achieved through their use of paper money and leveraged debt.
Nonetheless, powerful deflationary forces unleashed by the collapse of today’s even larger speculative bubbles—the 1990 Nikkei bubble, the 2000 dot.com bubble, the 2008 US real estate bubble and the serial global real estate bubbles—are again moving through global economies; and, just as in the 1930s, the velocity of money is now so low capital markets are no longer self-sustaining.

If today’s investors knew that gold provided not only safety but explosive profits in times of economic chaos, the bankers’ paper markets would have emptied long ago as the majority of investors would have bought gold at the first sign the bankers’ house of cards could go up in flames.
But most investors didn’t know and didn’t buy; and, because of the bankers’ ongoing war on gold, they still haven’t.
This is the time of the vulture, for the vulture feeds neither upon the pastures of the bull nor the stored up wealth of the bear. The vultures feeds instead upon the blind ignorance and denial of the ostrich. The time of the vulture is at hand.
DRSchoon, Time of the Vulture, 3rd ed. 2012
In The Price of Gold and the Art of War, Part I and Part II, I explained how the bankers’ war on gold forced down the price of gold between 1980 and 2000. Next, in The Price of Gold and the Art of War, Part IV, I will explain gold’s price rise after 2000, how the bankers’ responded and how high the price of gold could go in the bankers’ end game.
In my current Dollars & Sense video on youtube, The Economy 2014/2015, I explain the economy in terms that can hopefully be understood by most observers, see https://www.youtube.com/watch?v=YHQNYUdEsGc&feature=youtu.be
As we continue to move deeper into uncharted territory, I believe that good times will succeed the bad times, that love will replace hate and that peace and goodwill towards men and women will prevail.
Buy gold, buy silver, have faith.
Darryl Robert Schoon

….to take advantage of the:
 Tax Loss Silly Season
by Bob Moriarty 321Gold
I read something a couple of days ago about the Tax Loss season. When investors take a hit, they tend to dump the shares in December to move into something else. They take the loss and write it off. The interesting thing about the Tax Loss season is that for the past 11 years if you bought the gold/silver indexes on Dec 22 and all you did is hold for 90 days you would make a profit. That is if you were smart enough to take profits, many people aren’t.
It seems pretty obvious that we have been in a major bottoming pattern for two months with the resources. They are thoroughly hated and despised by burned out investors still licking their wounds. There will be a lot of selling of stocks this Tax Loss Silly Season. If you are smart enough to duplicate last year, buy the stuff now and hold it for 90 days. I have identified a couple of companies that have been beat and battered in spite of good news.
….read of the opportunites HERE

*Note: For significant supplementary information on “Silver’s Amazing Fundamentals” go HERE – Ed Money Talks
Silver Prices to Outperform Gold in 2015
I know it’s a bold prediction: silver prices are going to surprise investors and provide them with better returns than gold bullion. I say this because both the fundamental and the technical pictures for silver continue to improve.
Demand and Supply
The supply of silver produced continues to dwindle, while demand for the metal is robust. This is the perfect recipe for higher prices.
In Canada, a major gold-producing country, in the first nine months of 2014, mines produced 373,828 kilograms of silver. In the first nine months of 2013, Canadian miners produced 510,390 kilograms of silver—representing a 26% decline in silver mine production. (Source: Natural Resources Canada web site, last accessed December 9, 2014.)
Mine production in other silver-producing countries is also on the decline. As silver prices remain low, silver producers have less incentive to produce. And those whose production costs were too high have shut down their operations.
Meanwhile, the demand side for silver remains strong. From January 1 of this year to December 9, the U.S. Mint has sold 42.86 million ounces of silver in American Eagle coins. In the entire year of 2013, the Mint sold 42.67 million ounces in similar coins. (Source: United States Mint web site, last accessed December 9, 2014.) Because of the holidays, December is usually a robust month for silver coin sales; hence, the number of American Eagle coins sold this year will only increase.
Demand for silver from India is strong, too. Ashish Mundhra, managing director of Mundhra Bullion, a precious metal dealer in India, said, “There is a tsunami in silver. Investors are pouring in.” (Source: “Silver Demand Returning, in Patches,”The Wall Street Journal, November 11, 2014.)
The Technical Perspective
When I look at the long-term chart of silver prices, it keeps me optimistic.
Look at the chart below. It shows how the bull market in silver that began in 2002 continues to find support (red circles). The price of silver has certainly come down from its peak in 2011, but remains well above the lows it made in 2009.

Below the silver price chart above, I have also plotted the gold-silver ratio. This ratio is simply how many ounces of silver it takes to buy an ounce of gold. It currently sits at 73.51. Looking at it from a historical perspective, since 1970, the average gold-silver ratio has been 55.4.
If we assume the gold-silver ratio will come back to its historical average, either gold prices need to collapse or silver prices will have to increase to at least $22.00 an ounce—34% higher than where they sit today. If the price of gold bullion continues to rise, as it has been since October of this year, then silver prices will need to move higher than $22.00 an ounce, as it regresses back to its historical gold-silver ratio.
Don’t worry about the daily fluctuation in silver prices. The markets are ruled by short-term emotions and irrationality—two conditions that present long-term investors with opportunity to purchase quality senior silver producers at cheap prices.
This article Silver Prices to Outperform Gold in 2015 was originally published at Profit Confidential
Trading position (short-term; our opinion): No positions are justified from the risk/reward perspective.
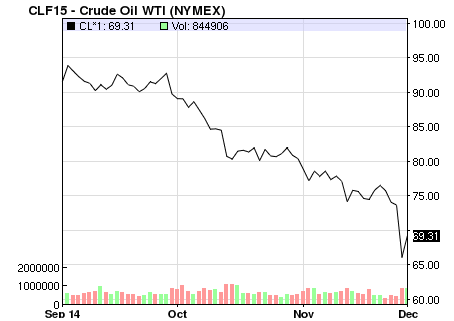
The price of crude oil declined yesterday once again – was the bottom reached yet?
In our opinion – not yet, but it could be the case that we’ll see some kind of pause shortly. The big picture provides us with the same implications as it did yesterday (charts courtesy of http://stockcharts.com):

Our previous comments remain up-to-date:
The first thing that catches the eye on the above charts is a breakdown below the long-term blue support line (based on the 2002 and 2009 lows and marked on the monthly chart) and the 70.7% Fibonacci retracement based on the entire 2009-2014 rally (marked with green on the weekly chart), which suggests further deterioration in the coming day (or days). If this is the case, the commodity could drop to around $51-$52.73, where the 76.4% and 78.6% Fibonacci retracement levels are.
If the long-term outlook is that bearish, then why can we expect a pause here? Because on a short-term basis we saw a daily reversal (doji candlestick) on significant volume.

Since doji on high volume is a reversal sign, we could see one, but since the momentum is so strong in case of the crude oil market, it could be the case that the correction that we’ll see will be very limited – perhaps similarly to what we’ve seen at the beginning of the month.
Summing up, while we may see a corrective upswing shortly, it doesn’t seem that the decline in crude oil is completely over. The space for declines seems limited, and consequently we think that opening short positions at these levels is not justified from the risk/reward perspective.
Very short-term outlook: bearish
Short-term outlook: mixed with bearish bias
MT outlook: mixed
LT outlook: bullish
Trading position (short-term; our opinion): No positions are justified from the risk/reward perspective at the moment, but we will keep you informed should anything change.

-
I know Mike is a very solid investor and respect his opinions very much. So if he says pay attention to this or that - I will.
~ Dale G.
-
I've started managing my own investments so view Michael's site as a one-stop shop from which to get information and perspectives.
~ Dave E.
-
Michael offers easy reading, honest, common sense information that anyone can use in a practical manner.
~ der_al.
-
A sane voice in a scrambled investment world.
~ Ed R.
Inside Edge Pro Contributors

Greg Weldon

Josef Schachter

Tyler Bollhorn

Ryan Irvine

Paul Beattie

Martin Straith

Patrick Ceresna

Mark Leibovit

James Thorne

Victor Adair