
Bonds & Interest Rates
100% of economists predicted yields on the long end of the US treasury curve would rise in 2014. Instead, they dropped all year.
And just two weeks into January of 2015, the 30-year long bond made a new intraday record low of 2.39%, breaking the previous low of 2.44% on July 26, 2012.
Yield Curve as of 2015-01-14

Huge Rally on Long End
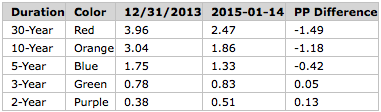
In contrast to economist predictions, the long end of the yield curve fell 1.49 percentage points (149 basis points). That the equivalent of 6 quarter point cuts, not hikes.
Meanwhile, yields rose slightly on 2-year and 3-year treasuries.
Buying the extreme long end of the curve while shorting 2- and 3-year treasuries would have gained both directions especially if one did the latter on the few small yield rallies that did take place.
Spreads
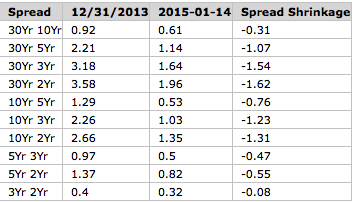
In addition to the rally on the long end of the curve, every possible spread between 2-year and 30-year treasuries all tightened!
Recession Indicators
If the economy was getting stronger, yields on the long end of the curve would be rising and spreads would be widening as well.
Neither is happening.
The bond market does not believe the recovery will strengthen and neither do I. In fact, I suggest we are on the cusp of recession (something I have admittedly been wrong about before).
Yield Curve Inversion?
With the Fed still holding the short end of the curve near zero, collapsing yields on the long end coupled with tightening spreads to the downside is about as big a recession indicator as one could expect.
The typical sign of recession, an inverted yield curve with 3-month treasuries yielding more than 30-year treasuries (we saw in 2000 and again in 2006-2007) is not going to happen in the absence of rate hikes.
Yet, looking at actual spreads, I do see room for possible inversions on some parts of the curve. For example the 30yr-10Yr spread is only 61 basis points (narrowing from 92 basis points). The 5Yr-3Yr spread is 50 basis points (about half of what it was at the beginning of 2014).
If the Fed does pull off a round or two of tightening, we could see portions of the curve invert, and I would actually expect that.
I have not seen anyone else even discuss the possibility.
Interest Rate Bets
From Bloomberg
- Treasury yields show traders are pricing in deflation for the next two years. The difference between yields on two-year notes and non-indexed U.S. government debt of comparable maturity, an indication of consumer prices called the break-even rate, fell to negative 0.13 percentage points, down from 1.96 percentage points in March 2014.
- Interest-rate derivatives predict the Fed’s policy rate will rise to about 0.43 percent by the end of December, about a third of the 1.125 percent rate central bank officials predicted in December,according to the median of their quarterly forecasts.
- The worldwide bond rally sent the effective yield on Bank of America’s global index of sovereign debt to a record-low 1.2 percent yesterday. Ten-year debt yields fell to 1.51 percent in the U.K., 0.65 percent in France and 0.26 percent in Japan.
- There’s a 67 percent chance the Fed will raise its benchmark rate to at least 0.5 percent by December. At the end of last year, wagers were focused on a September start.
Five Sure Things for 2015?
I strongly suspect one or more allegedly “sure things” for 2015 will not happen.
- 100% of those surveyed predict S&P will rise. See Ding! Ding! Ding! Pimco Plans a Push Into Stocks With 7 New Equity Strategies; No Forecaster Predicts S&P Decline in 2015.
- 100% predict yields on the long-end will rise significantly.
- 0% predict a recession.
- 67% think the Fed will hike at least 50 basis points by December.
- Most think the dollar will rally further.
I take the other side of those bets, adding that if the Fed does manage to pull off a couple hikes, they will quickly reverse in 2016 as the entire global economy sinks.
Signs of Weakening Economy
For further discussion regarding the strength of the economy, please see …
- Retail Sales: Retail Sales Post Huge Downward Surprise; Lower GDP Revisions Coming Up; Economists Easy to Surprise
- Retail Sales: Economists Still Upbeat: Retail Sales Drop Seen as “Blip”
- Copper: Copper Plunges to Price Seen February 2006; Copper vs. Gold
- Oil: What’s Behind the Plunge in Oil? Winners and Losers? Boon to Spending or Recessionary?


In a dramatic move the SNB abandoned the CHF peg to the EUR which saw the CHF appreciate by as much as 38% versus the EUR. With market speculation rife about a move to full blown quantitative easing by the ECB next week, the SNB may have acted so as to limit its need to buy EUR to defend the peg if the ECB did resort to additional monetary stimulus.
CAD strengthened from just below 1.20 towards the low 1.180 versus the USD . Currently at 1.1910 ; The move in CAD was helped by a rebound in crude with WTI ( FEB) up nearly 2.5% today at it’s peak. Whilst oil enjoyed a 6% pop yesterday all the Loonie could manage was a bit of a sideways shuffle which is not an encouraging sign. With oil now trading lower USDCAD is back above 1.19 and that 1.20 level and beyond is looking very attainable ; Support in USD.CAD is down at 1.1790 and resistance up at 1.2008.
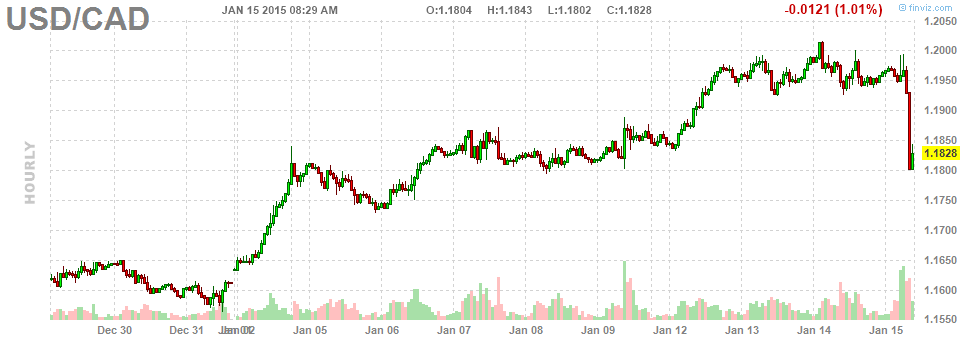
![]()

Talk of deflation was overheard on the Street as a few analysts quoted by the news wires mentioned the D-word. One reason for the recent equity market weakness is the uncertainty among investors as to whether lower oil prices are ultimately beneficial or detrimental for the economy. In one camp are those who maintain that lower oil prices will boost consumption; on the other side are those who claim that plummeting energy prices can only lead to outright deflation. Because neither side has a decisive majority right now, equities are caught in the imbalance of opinion which explains much of the recent volatility.
Adding to the uncertainty this week was the latest research note from Goldman Sachs. Goldman’s chief commodities analyst Jeffrey Currie wrote: “To keep all capital sidelined and curtail investment in shale until the market has re-balanced, we believe prices need to stay lower for longer.” Goldman made a high-profile call for $40/barrel oil before the bottom has been seen in the crude market.

Both sides of the argument have merit, but history shows that there comes a point at which falling oil prices eventually exert a negative on equities. The two examples that come to mind are the 2008 oil collapse, which increased downside volatility for the credit crisis. Before that, the 1998 plunge, which took crude prices below $10/barrel, aggravated the Russian Ruble crisis and LTCM hedge fund collapse of that year and had a decidedly negative spillover impact on stock prices for a while.
I would also point out that in the Kress cycle forecast for 2015 the 6-year “echo” suggests that the first few weeks of the New Year could be negative for stocks. The Kress cycle echoes tend to be fairly accurate in warning of broad periods of above-average volatility and of the years which most closely align with 2015 in terms of the key Kress cycles, January was shown to be a particularly vulnerable month for selling pressure.
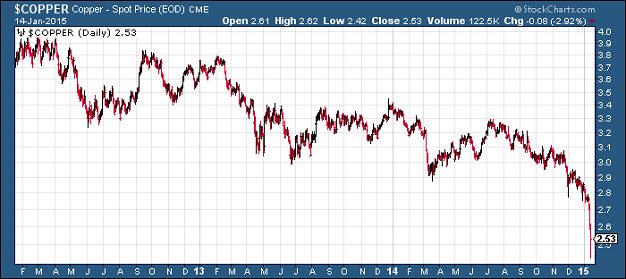
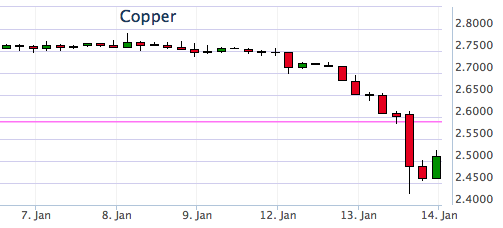
Meanwhile commodities continue to take center stage as concerns mount that the weakness in the energy market may spill over into other areas of the financial system and the economy at large. On Wednesday, Citigroup cut its iron ore and coal forecasts due to supply costs and signaled that the oil price crash is feeding into other commodity markets. An even bigger sign that that weakness is having an impact on global demand can be seen in the chart for copper futures. Copper is a widely watched gauge of global economic strength and the following graph suggests diminishing demand.
One of the major culprits for the weakness in oil and other commodities is the austerity policies in Greece and other euro zone countries, which is coming home to roost right now. While the U.S. Federal Reserve responded to the unmitigated demand for money during the critical years 2009-2012, other countries chose to ignore the need for increased reserves and liquidity and instead initiated an ill-timed tight money policy. Fast-forward to 2015 and while the U.S. finds itself the envy of the world in terms of its domestic economy, other nations are showing major signs of weakness with some verging on recession.
The risk is that the commodities bear market continues exerting a negative influence on economies in Europe and Asia with weakness eventually being exported to the U.S. This is what happened, on a temporary scale at least, in 1998. While we’re a long way from the danger zone, there are preliminary signs that some of that weakness is already showing up. The latest U.S. retail sales numbers, for instance, showed a 0.9 percent drop for December in what should by all accounts have been a positive month. Electronic and clothing retailers were among the nine of the 13 leading categories that showed a decline in sales as Americans chose not to spend the extra money from gasoline price savings.
A better reflection of what the average consumer is doing with his money is visible in the New Economy Index (NEI). NEI is a basket average of several stocks within the consumer retail and business sectors. For years it has provided an accurate real-time picture of the overall state of the U.S. retail economy. Here’s what the NEI looks like right now.
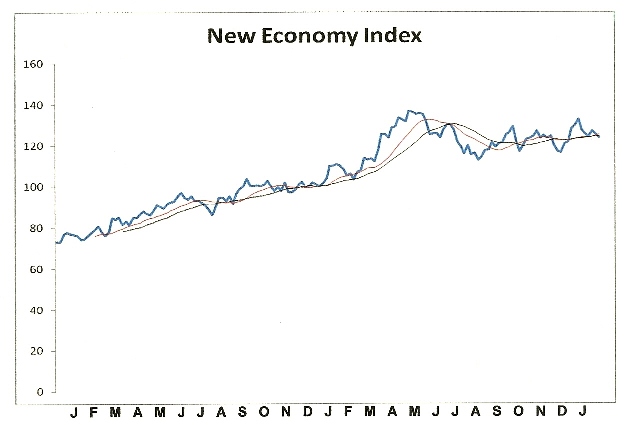
NEI reached an all-time high last January and has spent the past year consolidating its gains since 2009 by tracing out a lateral range. The NEI chart looks decent but could certainly use some improvement. My interpretation of the NEI pattern is that while consumers have been spending at moderate levels, they haven’t completely “let loose” with those frenetic spending binges that have always characterized strong economies of the past.
Although joblessness isn’t a major problem like it was in years past – the latest jobs report showed a surge of 321,000 new jobs in November – consumers are apparently concerned enough about keeping their jobs that they haven’t accelerated their spending. It will be interesting to see how they respond to the continued weakness in the commodities market.
About Clif Droke
Clif Droke is a recognized authority on moving averages and internal momentum. He is the editor of the Momentum Strategies Report and Gold & Silver Stock Report newsletters, published since 1997. He has also authored numerous books covering the fields of economics and financial market analysis. His latest book is “Mastering Moving Averages.” For more information visit www.clifdroke.com

 Remember this day – Wednesday, January 14th, 2015; as it may well be recalled as a key inflection point in financial history. I had planned on writing of just one “historically momentous” event – i.e., last night’s implosion of base metal prices, signaling the “death of manipulation” of the illicitly supported copper market. However, before I even started writing – at 8:40 AM EST – no less than seven such events littered the global economic and financial landscape.
Actually, I had planned on also highlighting the utterly insane manipulations of yesterday’s markets – as the PPT desperately attempted to prevent the “Dow Jones Propaganda Average” from plunging; whilst the Fed desperately attempted to prevent the 10-year yield from closing below the October 15th “flash crash” low of 1.89%, yielding universal realization of the “most damning proof yet of QE failure”; and the Cartel desperately attempted to slow the momentum of the past two weeks’ explosion of PM prices, particularly in non-dollar currencies. Suffice to say, the piddling “salvation” achieved by yesterday’s efforts has been decidedly annihilated this morning; as care of said “historically momentous” factors, stocks, commodities, and interest rates are plunging; whilst currency markets are in chaos; and what do you know, gold prices are surging – as silver, a day after another enormous sales day at the U.S. mint, is also looking extremely strong.
And thus, in no particular order, here are today’s “historically momentous” events; which, cumulatively, will make it eminently difficult for TPTB to prevent universal realization of a far more terrifying sort; i.e., that “2008 is back.”
1. I could kick myself, as for the past week I’ve queued up an article topic, discussing the irrationality of copper and zinc prices holding up so well, whilst the Bloomberg Commodity Index plunges to a 12-year low. Moreover, in the case of “Dr. Copper” – the poster child of industrial commodity demand; or as I called it last year, “Dr. Death” – it is also amidst a horrific Chinese inventory scandal. In other words, it was just a matter of time before copper “met its maker.” And finally, after gradually weakening over the past week, it suddenly collapsed last night, along with zinc and all the base metals. Down 5% today alone, to $2.57/lb, it is now down 11% from the $2.90/lb level it ended 2014 at; whilst zinc is now just $0.92/lb, from $0.99/lb at year-end. Both metals have a long way to go to the $1.25/lb and $0.50/lb lows of 2008, respectively, but rest assured they’ll probably come close. And when they do – and the Bloomberg Commodity Index makes multi-decade lows, not only will BHP Billiton and Rio Tinto again teeter on bankruptcy, but the “Miles Franklin Silver All-Star Webinar Panel’s” forecast of a 25%-50% silver production decline will appear far more likely.
2. After plumbing 20-year lows for the past year, mortgage purchase applications exploded 24% last week alone; and refinancing applications, an incredible 66%! And no, this is NOT “good news”; but instead, the “sum of all fears” regarding U.S. consumer and Federal insolvency.
To wit, I spent the New Year’s holiday in Arizona with a very close friend, who said he has just refinanced his mortgage. When questioned, he said Quicken Loans now sends email “alerts” whenever rates fall enough to warrant a new mortgage, with no material costs to complete the process. Immediately after completion, he receives a letter from Fannie Mae, reiterating their ownership of hits mortgage, and the perpetual refinancing process starts anew, as Quicken prepares its next email “alert.” Frankly, I was in awe – realizing that this, in fact, is a new form of QE, as the government is directly “giving” money to the public; thus, indebting it further, whilst adding massive debts to the Federal balance sheet. Which, by the way, is conveniently hidden from view, as Fannie and Freddie’s nearly $6 trillion of nationalized debt is held “off balance sheet.” Throw in the 3%-down mortgages the FHA is now offering to subprime lenders, and you can see the Fed’s printing presses have decidedly not been “tapered” – nor its appetite for financial destruction. Of course, you can bet that few, if any, of the 24% increase in mortgage applications will actually turn into new home purchases. Or, for that matter, that the waves of refinancing will cause Americans to “spend” – as opposed to paying off other debts.
3. In my “2015 predictions,” I forecast “Retail Armageddon” following this year’s historically horrible holiday spending season. Additionally, in yesterday’s “things I’m grateful for,” I noted my incredulity in seeing the MSM and Wall Street continue to expect holiday spending to be “salvaged” despite an 11% plunge in “Black Friday” weekend sales. Well, just this morning, that illusion was decidedly shattered, when it was reported that December retail sales not only plunged by 1.0%, compared to expectations of just a 0.1% decline. Thus, the oil price plunge has decidedly NOT acted as a “tax cut”; as not only evidenced by the shockingly bad retail sales, but plunging load factors at airlines like American Air! And oh yeah, even “excluding gasoline sales,” retail sales still declined.
4. The Fed may have succeeded in closing the 10-year yield at 1.89% yesterday, mere tenths of a basis point above the October 15th “flash crash” low. However, this morning it is in FREEFALL – touching at low as 1.78% earlier this morning, and sitting at 1.81% as I speak. In other words, the market is now fully “front-running” QE4, expecting it sooner rather than later; or as I’ve deemed it, the inevitable “Yellen Reversal.” And not only here, but throughout the world – as evidenced by the Japanese five-year yield yesterday joining those of Germany and Switzerland in negative territory. I mean, can you imagine the insanity of paying the world’s most insolvent entities for the right to lend them money? I can, as “investors” are simply betting the BOJ, ECB, and SNB – among others – will monetize such bonds at still higher prices. Of course, whilst investors rush headlong to the “safety” of QE-supported sovereign bonds – no matter how insolvent their issuers – they are fleeing “2008-style” from the debt of insolvent corporations!
5. Speaking of the ECB, the Euro has plunged to another nine-year low this morning – of 1.174 at its low. “Coincidentally” before next Tuesday’s potentially momentous ECB meeting, the highest EU court essentially gave a green light to the constitutionality of QE. Thus, gold is again surging in Euro and Swiss Franc terms, as the orchestrated three-year “bear market” is decidedly OVER. It’s only a matter of time before gold in Euros, Swiss Francs, Japanese Yen, and countless other currencies join Ruble-priced gold at all-time highs; and ultimately, as I’ll discuss in tomorrow’s Audioblog, U.S. dollar-priced gold.
6. Also on the topic of CRASHES, how about Bitcoin? Down another 20% overnight – to a low of $172 – it is now down 40% this year alone, and 85% from the all-time high set barely a year ago. I’ve written exhaustively of my views on Bitcoin; and frankly, the concept of alternative currencies, whilst intriguing, has a LONG, LONG way to go, even if ultimately successful. That said, Bitcoin will NEVER meet the parameters of money ; and sadly, countless tens of thousands are finding that out the hard way.
Nor, for that matter, are mining stocks – which despite the potential for material gains, are still just shares of ownership of companies hoping to profitably mine gold and silver, amidst a “minefield” of industry and government-erected obstacles. Just look at the massively dilutive financing announced yesterday by one of the industry’s “best” miners – Yamana Gold – causing its price to plunge 13% yesterday alone. In said “2015 predictions,” I also forecast complete paralysis of the global gold and silver mining industries, from already devastated levels – and that was before the base metal implosion I started today’s article discussing. Recall, roughly two-thirds of all silver production emanates as by-product from other types of mines – for the most part, copper or lead/zinc.
7. Though not momentous today, we are but eleven days from the potentially historic Greek snap election – in which the “anti-austerity” (read “pro-default”, “anti-Euro”) Syriza party is expecting a dramatic victory. Seeing its leader, Alexis Tsirpas, claiming Greek economic data is dramatically overstated – whilst government tax receipts collapse, as citizens anticipate a “debt jubilee,” it’s awe-inspiring to see the “revenge of the people” movement I anticipated in action.
Well, that’s enough for this “historically momentous” day; other than to conclude with this news of the ongoing explosion of global physical gold demand – which will inevitably go parabolic when, likely much sooner than most can imagine – the entire world realizes the end game of history’s largest fiat Ponzi scheme, “QE to Infinity,” is not just inevitable, but imminent.
PROTECT YOURSELF, and do it NOW!
Oil Trading Alert originally sent to subscribers on January 14, 2015, 10:19 AM.
Trading position (short-term; our opinion): Short positions with a stop-loss order at $48.34 and an initial price target at $38 are justified from the risk/reward perspective at the moment.
Although ongoing worries over a glut in global supplies pushed crude oil to a fresh 2015 low, the commodity rebounded, finishing day above $46 per barrel. Is it another one-day rally or something more?
Yesterday, after the market’s open crude oil slipped to a fresh 2015 low of $44.20. Despite this drop, the commodity rebounded in the following hours supported by Chinese trade data, which showed that exports rebounded by 9.7% in December. Did this increase change anything? The answer to this question you will know in the technical part of today’s alert, meanwhile, let’s focus on major fundamental factor, which have weighed on prices in recent months – crude oil inventories. Yesterday, the American Petroleum Institute reported that last week crude stocks rose 3.9 million, while distillates gained 416,000 and gasoline increased 1.6 million. Therefore, if today’s EIA weekly report confirms these numbers and shows another increase in crude oil supplies (analysts expect the report to show that they rose by 417,000 barrels), the price of the commodity will likely move lower once again. Nevertheless, we should keep in mind that a smaller-than-expected increase or a decline will support the price and trigger a corrective upswing. Which scenario will we see later in the day? Before we know the answer to this question, let’s take a closer look at yesterday’s price action (charts courtesy of http://stockcharts.com).

Looking at the daily chart, we see that although crude oil moved lower after the market’s open, the commodity rebounded, invalidating the breakdown below the previous low of $44.20. Additionally, yesterday’s white candle mateialized on huge volume, which together seem to be a bullish signal. But is it really so positive? When we take a close look at the daily chart, we notice that we saw similar one-day rallies in the previous weeks. Back then, although they paused (or triggered a small corrective upswings) further deterioration, in fact, they were only another stops before new lows. Taking the above into account, and combining it with the fact that crude oil is stil trading well below the recent highs and the 38.2% Fibonacci retracement (based on the mid-Dec-Jan decline), we think that lower values of the commodity are still ahead us. In our opinion, this scenario is currently also reinforced by the medium-term picture. Let’s take a look.

From this perspective, we see that despite yesterday’s upswing, crude oil remains under the Apr 2009 lows, which serve as the nearest resistance at the moment. Therefore, as long as there is no invalidation of the breakdown below this area, a test of the barrier of $40 in the coming days is more likely than not.
Summing up, short positions are still justified from the risk/reward perspective as crude oil remains under the previously-broken Apr 2009 lows, the recent highs and the 38.2% Fibonacci retracement based on the mid-Dec-Jan decline. If the commodity moves lower from here, the first downside target for oil bears will be around $40.
Very short-term outlook: bearish
Short-term outlook: mixed with bearish bias
MT outlook: mixed
LT outlook: bullish
Trading position (short-term; our opinion):Short positions with a stop-loss order at $48.34 and an initial price target at $38 are justified from the risk/reward perspective at the moment. We will keep you informed should anything change.
Thank you.
Nadia Simmons
Forex & Oil Trading Strategist
Przemyslaw Radomski, CFA
Founder, Editor-in-chief


-
I know Mike is a very solid investor and respect his opinions very much. So if he says pay attention to this or that - I will.
~ Dale G.
-
I've started managing my own investments so view Michael's site as a one-stop shop from which to get information and perspectives.
~ Dave E.
-
Michael offers easy reading, honest, common sense information that anyone can use in a practical manner.
~ der_al.
-
A sane voice in a scrambled investment world.
~ Ed R.
Inside Edge Pro Contributors

Greg Weldon

Josef Schachter

Tyler Bollhorn

Ryan Irvine

Paul Beattie

Martin Straith

Patrick Ceresna

Mark Leibovit

James Thorne

Victor Adair