
Currency
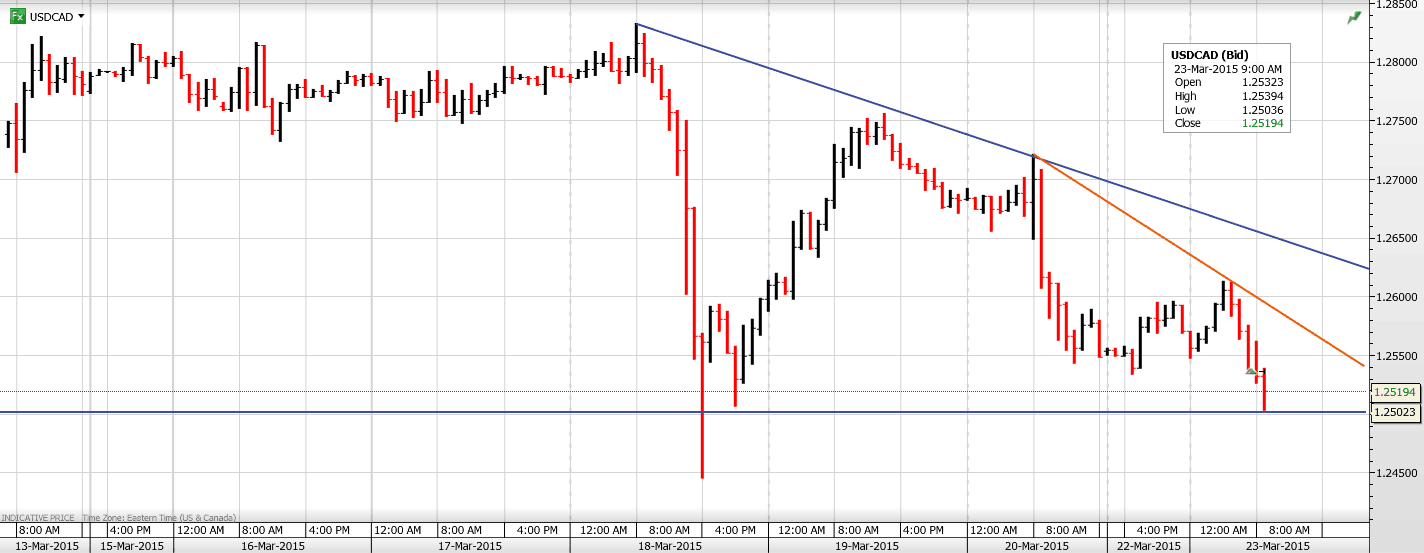
USDCAD Overnight Range 1.2509-1.2613
The US dollar is in full retreat, especially against EUR on the back of rising expectations that a US rate hike is a lot further down the road than previously expected. The Loonie is benefitting from the move and ignoring bearish remarks from the Saudi oil minister. He said that Saudi Arabia would only consider production cuts if non Opec nations cooperated. WTI oil prices are off their lows but the technicals remain bearish.
The US dollar opened the week trading lower in Asia. NZDUSD surged on better than expected consumer confidence data taking the Aussie along for the ride. USDJPY was quiet on the approach to Japan’s fiscal year end of March 31. The US dollar bounced early in the European session but those gains faded rapidly. Positive sounding headlines on Greece debt negotiations and ongoing US dollar position adjustment, post FOMC, drove EURUSD toward 1.0900.
There are two Fed speakers on tap today, Vice Chair Stanley Fisher, and John Williams. President of the San Francisco Federal Reserve
USDCAD technical Outlook
The intraday USDCAD technicals are bearish while trading below 1.2650. This morning’s break of 1.2530 supports additional losses below 1.2510 to the 1.2340-60 area. To the top, a move above resistance at 1.2550 would lead to 1.2590, which if broken points to 1.2650. The uptrend from the November low remains intact above 1.2440-60 area.
Today’s Range 1.2490-1.2560
![]()

We wrote in one of our daily articles that Sweden had cut its main interest rate into negative territory (-0.10 percent). That way the Riksbank followed other European central banks. Currently, except Sweden, the negative interest rates are set by the Central Bank of Denmark, the European Central Bank and the Swiss National Bank. What does such a historically unusual monetary policy mean for the financial markets?
There is no single general answer, because there is a special story behind each occurrence of a negative rate. For example, the Danish and Swiss cuts were related to managing their currencies rather than to stimulate growth or boost inflation. The Danish kroner is pegged to the euro, so its central bank cuts its certificates of deposit rate (these certificates are used in the open-market operations) into negative territory (currently at -0.75) in order to prevent appreciation of the currency against the weakening euro. A similar rationale was behind the Swiss National Bank’s move, which cut interest rates into negative territory (now at -0.75 percent) in order to prevent capital inflows and neutralize the frank’s appreciation after removing its peg to the euro. In the case of Sweden, the most popular explanation involves deflationary concerns; however the Riksbank could also cut its repo rate in the context of currency wars, because the Swedish kroner has been appreciating against the euro since the end of 2014.
The story of the euro is slightly different, because the Eurozone is not a small open economy, like Switzerland, Denmark or Sweden, which is afraid of capital inflow and currency appreciation due to problems in the Eurozone. Although we cannot preclude the ECB desire to weaken the euro against the U.S. dollar (the decline in interest rates could discourage foreign investors from placing their liquidity in the Eurozone), it does not seem to be the main reason because the monetary planners from Frankfurt cut the deposit facility rate, which is a rate on the excess reserves. The ECB cut this rate for the first time in June 2014 from 0 to -0.1 percent and cut it again in September 2014 to the current -0.2 percent. That way the ECB wanted to provide further monetary policy accommodation and induce banks to lend money from excess reserves into the ‘real’ economy and boost inflation and the economy.
Graph 1: ECB’s deposit facility rate from 2013 to 2015 (in percent)

What are the consequences of negative interest rates? It seems that not so big, because their level is not very low. Moreover, the deposit rate facility is not the main financial tool used by the commercial banks doing business with the ECB. And they are not forced to hold their excess reserves in deposit accounts (with negative interest rates) – they can keep them in their current accounts. The most important thing is that, contrary to what many analysts believe, the lowering deposit rate into negative territory does not lead banks to lend them out to the private sector. This is because banks do not lend reserves to the nonbank private sector. In other sectors, the banking sector as a whole cannot reduce its reserves – the reserves that leave one bank’s balance sheet just pop up on another. This explains why loans to the private sector in the Eurozone have not increased, but have actually fallen substantially after the reduction of the ECB deposit rate from 0.25 percent to zero in July 2012. So, why has the ECB has introduced them?
The hidden reason may be an attempt to recapitalize southern banks. They do not possess much in excess reserves, but the northern banks have a lot of excess reserves. Thus, the negative deposit rate may induce the Northern banks to lend their excess reserves to Southern banks in order to partially avoid the negative rate tax. It means that the situation in the peripheral Eurozone is not as strong as many believe.
Negative deposit rates also impose some costs on banks, which may lower their profitability and even aggravate the problem of sluggish lending. Another important effect is the increase of a relative attractiveness of investing in alternatives, such as gold or Treasury bonds.
This is exactly what we are seeing right now. According to Bloomberg, in Switzerland, “investors are buying more gold as an alternative to hold Swiss franc cash deposits”. As we already explained in October’s Market Overview, lower interest rates mean lower opportunity costs of holding non-interest bearing assets, like precious metals, making them relatively more attractive. If you can earn, say, 2 percent on the deposit, the investment in gold, which you have to store and insure, and pay, say, 1 percent, does not sound very compelling. But when you suddenly have to pay 0.75 percent to hold paper currency, gold looks much better.
This is also why we are witnessing an increasing demand for some European government debts, mostly in Denmark, Switzerland and Germany, which is reducing yields even into negative territory. Yes, it seems strange at a first glance. Why the hell do investors agree to pay for lending money? However, it becomes fully understandable when we take into account the current situation in the Eurozone. In short, investors are eager to pay for holding safe assets, because they fear the collapse of the euro. You can think about such a deal as a currency playing or buying an option. Investors pay the premium, but when the Eurozone breaks up, they would hold gold, Swiss francs or bonds of the relative rich and stable northern countries like Germany, Denmark or Finland.
In other words, some investors are quite pessimistic about the overall economic outlook for the continent and the future of the Eurozone. They are so desperate in their search for safe havens that they pay for the privilege of lending money. Similarly, the recent unconventional central banks’ actions show that they are really desperate. It signals that not only did all the previous monetary stimuli failed to fuel the economy, but also that the global slowdown is coming. Look at the producers’ price indices. The central bankers, as insiders, know that deflation in commodity and industrial prices indicates the crack-up phase of the business cycle.
To sum up, the recent events in Europe seem to be bullish for the gold market. The Eurozone crisis will come sooner or later. Investors predict rather sooner, at least drawing conclusions on the basis of the level of yields on Treasuries. The central banks introducing negative interest rates and implementing quantitative easing (the Riksbank and the ECB), show that a global slowdown is on the horizon. As we constantly repeat, gold is historically the best asset class during slowdowns. The safe haven demand (remember that the Swiss franc, which is traditionally considered as a safe haven currency, is now relatively less attractive) and very low real interest rates would also positively contribute to the prices of gold.
Thank you.

Originally published March 22nd, 2015.
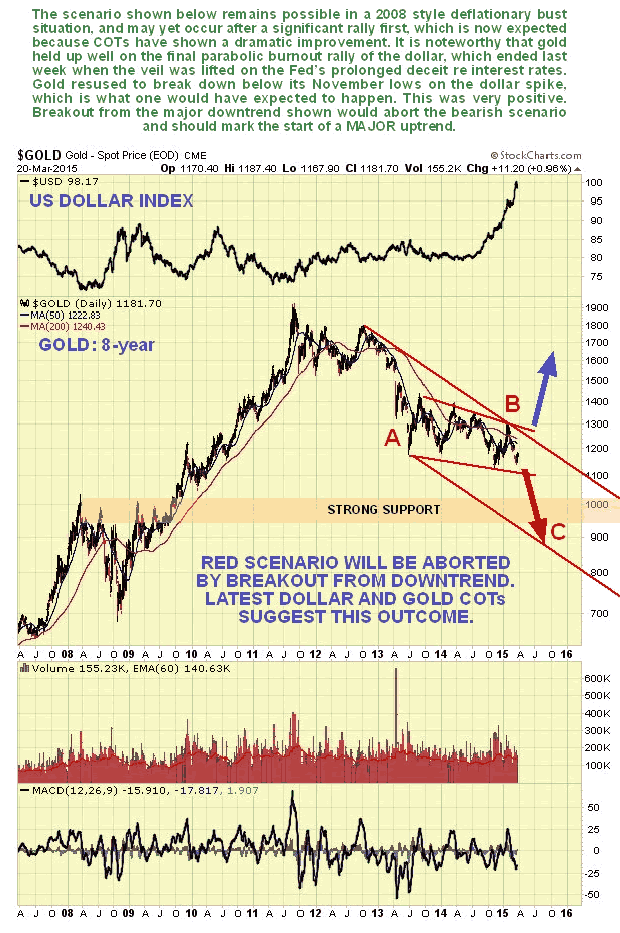
The immediate outlook for gold has improved dramatically following the dollar’s topping action of recent days after the Fed was rumbled, and the vast improvement in the COT structure of the past 2 weeks. While the negative outlook set out in the last update could yet come to pass in the event of a deflationary implosion – and remains a risk until gold breaks out of the downtrend shown here on our 8-year chart – latest COTs certainly suggest that the risk has been averted for now. In anticipation of the dollar reversing after the Fed meeting, we liquidated our PM sector short positions for a profit on the site and reversed to long, and the way things are shaping up we won’t need to close our long positions for a while.
On our 8-year chart for gold we can see that to erase the bearish scenario shown associated with a deflationary implosion, gold has simply to break up upside from the long-term downtrend shown, which wouldn’t take all that much of a rally from here. Latest COTs suggest that is about to attempt to do this. If the dollar index, shown at the top of this chart, is indeed burning out here, then gold is likely to get a powerful boost going forward as the dollar retreats.
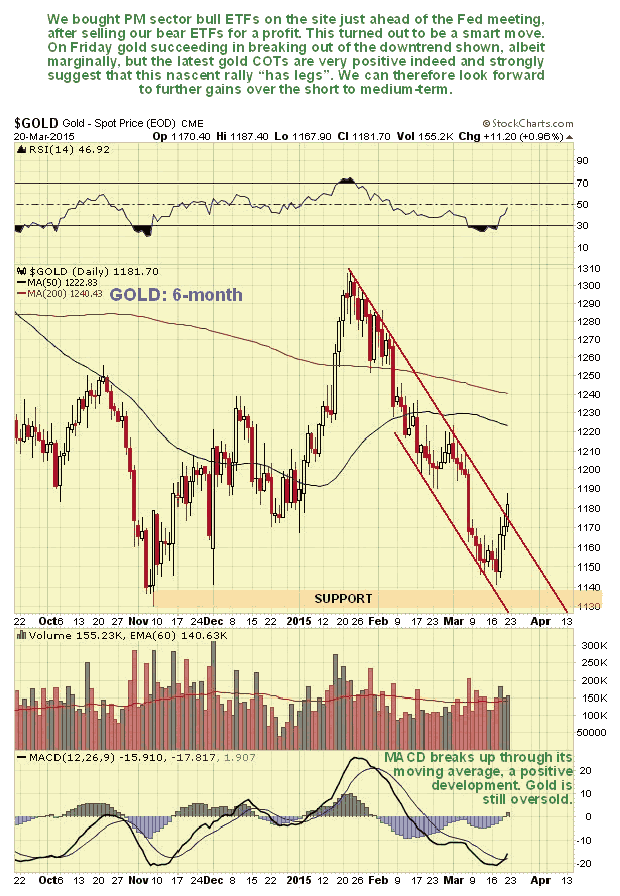
On the short-term 6-month gold chart we can see recent action in more detail. On this chart we can see how gold started to rally immediately after the Fed and it has already succeeded in breaking out from the shorter-term downtrend in force from mid-January. Although the breakout from this downtrend is still only marginal, which normally would lead us to expect some backing and filling, the now highly favorable COT suggests that it will soon get on with it and continue higher.
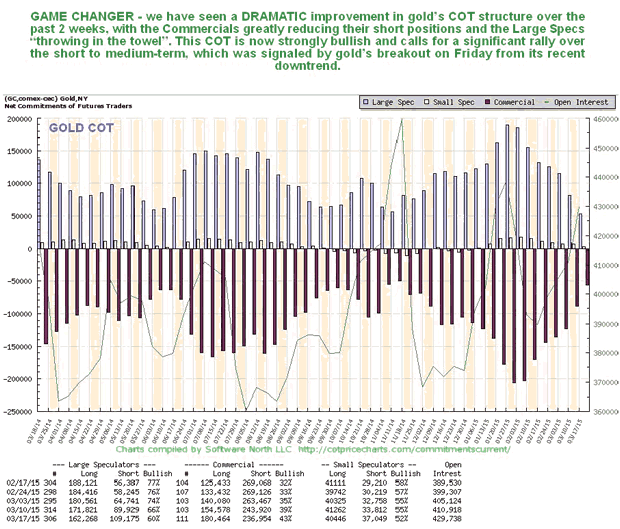
Now we come to the all-important COT. A reader once wrote in and asked “How can you trust the COTs when they could be rigged?” My response to this was simply to say that I would continue to trust them until they don’t work any more, and in any case they don’t need to rig data like this, because the fact is that most market participants are too dumb to use it. Anyway, the latest COT shows a dramatic scaling back of both Commercial short and Large Spec long positions over the past of couple of weeks, which indicates that the Large Specs have “thrown in the towel” in disgust, as they have a habit of doing at market bottoms, while the Commercials are clearly getting out the way ahead of a rally. The last time the COT was this positive was at gold’s November low.
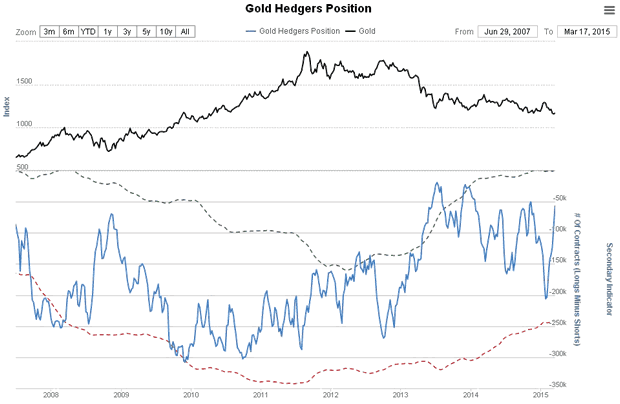
The Gold Hedgers chart, which is a form of COT chart, also shows a dramatic improvement to readings which usually precede a rally.
The Gold Optix chart has in recent weeks collapsed back to an extremely low level, and is approaching record pessimistic readings, which of course is another positive sign.

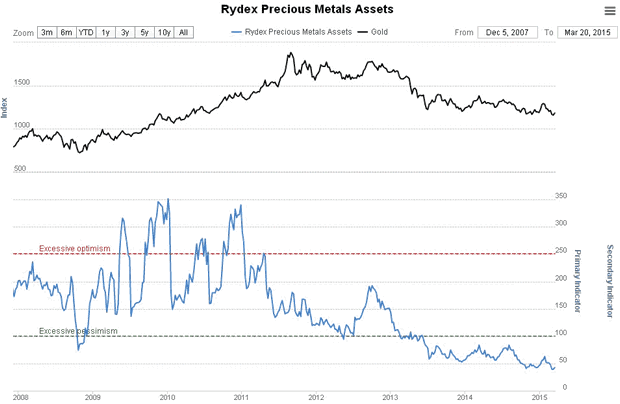
The habitually wrong Rydex Traders holdings in the Precious Metals sector have just hit a new record low, which is another sign of a negative extreme.
It was a momentous week for the dollar, a week in which the global investment community just started to grasp that the Fed has been playing them for suckers. This is a slow process, like watching Stan Laurel, the notoriously thick partner in the famous Laurel & Hardy comedy duo, slowly grasping some truth. What the Fed has done has been to dangle the carrot of the prospect of higher interest rates in the US in front of global investors seeking higher returns, both to mitigate the damage caused by their extensive QE programs (as in “Let’s get these stupid foreigners to pick up the tab”) and to suck capital into the US to keep its stockmarkets levitated, because gains in US stockmarkets have augmented by rises in the dollar, creating a virtuous circle for investors in US markets. The only problem with this is that it works until it doesn’t. What happened last week was that investors started to rumble that the Fed has no intention of raising rates to any significant degree – it can’t anyway because it is boxed in – and instead of the 2% – to 3% that they were expecting they will end up maybe with 0.5% to 1.00%. This became obvious when the Fed removed the word “patient” from their statement and then Yellen tried to limit the damage by saying that removal of the word “patient” didn’t mean that they were becoming impatient. This double speak has made it plain the game they are playing with the markets.
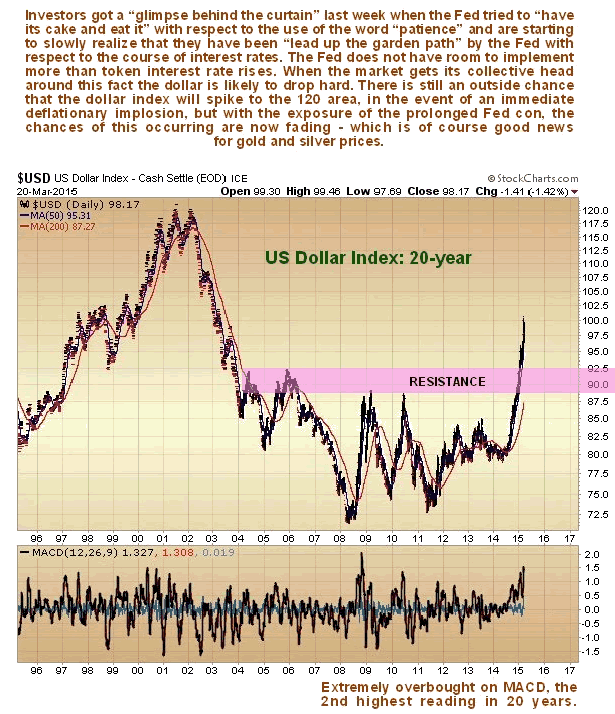
Anyway – the jig is up – investors are starting to grasp that the rate rises they were looking forward to in the US simply aren’t going to materialize, just some token rises to spin them along. This means that the dollar has either peaked is in a topping out process. You may recall in the last update that we said that the dollar index could get out as high as 120, in the circumstance of an immediate deflationary implosion. This now looks highly unlikely in view of the latest dollar and gold COT and sentiment data, and especially after the Fed “tipping its hand” last week. Action in the dollar and dollar proxies suggest that it has topped out, or at best is in the process of doing so, which could involve marginal new highs.
Accordingly, we have removed our admittedly rather outlandish target of 120 from the 20-year dollar index chart shown below, and it looks like the dollar has now peaked at “round number” resistance at 100. This would not be really surprising given that it is at its 2nd most overbought level for the last 20 years after its amazing ramp of the past 9 months.
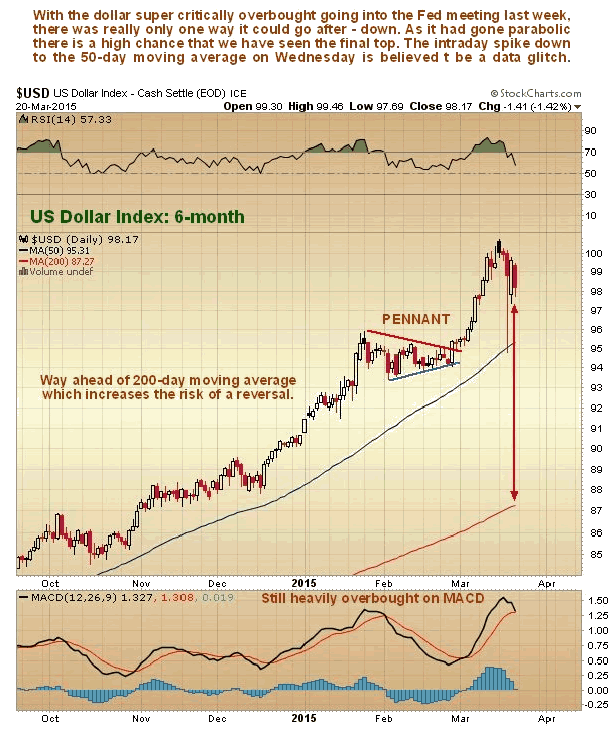
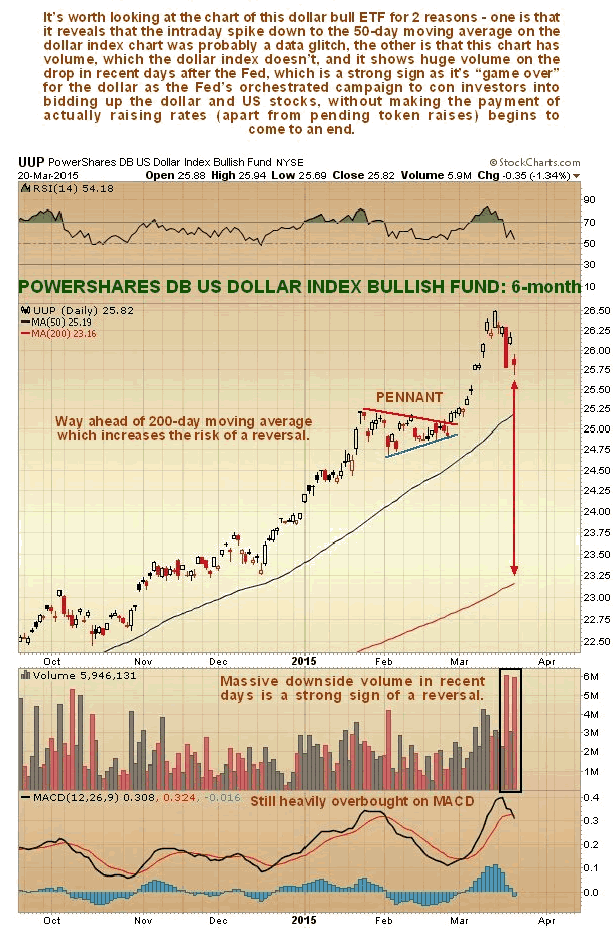
On its 6-month chart we can see how the dollar’s rise became parabolic ahead of the Fed meeting, resulting in it becoming critically overbought on its RSI and extremely overbought on its MACD indicator. Seeing this we reversed position on the site into PM sector triple leveraged bull ETFs just ahead of the Fed, a gambit that has worked out well so far. Before leaving this chart note the anomalous intraday plunge by the dollar to its 50-day moving average on Wednesday which is thought to be a data glitch.
The chart for UUP, a dollar bull ETF, is useful as it enables us to see that the intraday plunge by the dollar on Wednesday mentioned above was indeed a data glitch, as UUP did not make the same move. Another advantage conferred by looking at the UUP chart is that it has volume, which the dollar index chart doesn’t, and it enables us to see that there was a stampede for the exits immediately following the Fed, which of course has bearish implications. Fortunately we were able to front run this mob.
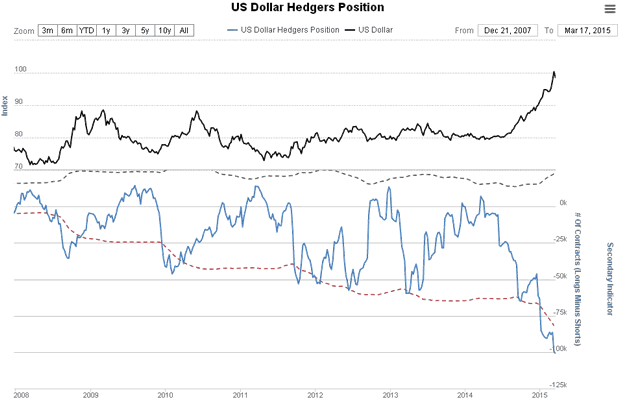
It’s a case of laugh or cry when you see the dollar Hedgers and Optix charts shown below. Starting with the latest Hedgers chart, which is a form of COT chart, we see that it has dropped to crazy record short readings as Smart Money has piled on the shorts as the dollar went parabolic ahead of the Fed meeting. Just going on this chart, the dollar will be toast before much longer.
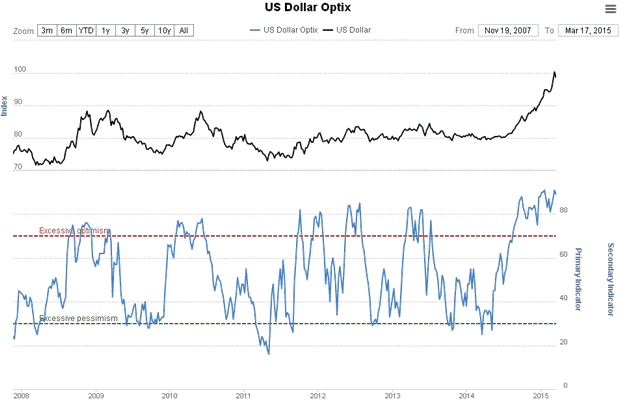
The dollar optix, or optimism index shows that bullish sentiment towards the dollar was flirting was record extremes going into the Fed meeting, another indication that it is burning out.

Daily time frame:
- The 100 dma once again has prevented a source of distress for the equity bulls (Fourth time since January)
- Once the 50 dma has provided a springboard (tested on Wednesday) with the help from the FED, SPX has ended the week back above all the major moving averages.
- Therefore the conclusion is that Bears have failed to jeopardize the trend, which remains firmly up.
- Odds should favor new ATH
- In a potential pullback the range 2093 – 2085 should hold (If bulls have regained the upper hand the 20 dma = 2089 should no be breached)’

Weekly time frame:
- As I have suggested in previous posts, so far from the July high, SPX has been rising within the boundaries of a potential Rising Wedge.
- The assumed Rising Wedge has two possible upper trend lines. Next week the lower one will stand at 2131± while the upper one will stand at 2150±
- This week wide range candlestick has clearly negated a prolonged corrective phase (The 20 wma has acted as support in the weekly time frame like the 100 dma in the daily time frame)
- Important price levels:
- Below we have the support zone with a range 2093 – 2085
- Above as resistance we have the range 2019.59 (February high) – 2124 (Upper Bollinger band) then the first trend line which next week will stand at 2131

The Ending Diagonal scenario:
An Ending Diagonal is a terminal pattern. If it pans out it could open the door to a multi-month or even multi-year retrracement of the rally from the 2009 lows.
We have two potential Ending Diagonals:
- A large one has been forming since the July high. The last wave (V) is in progress since the February low and probably it should be unfolding a complex Double Zig Zag which needs more time to be accomplished

- A smaller Ending Diagonal can be counted from the December high. As in the previous scenario, in my opinion, it is probable that the last wave (V) will require more time to be completed.

If SPX is forming an Ending Diagonal the major reasons that suggest a prolonged last wave are:
- AAII Bullish sentiment has dropped to the lowest level in nearly two years. It would be extremely odd that SPX establishes a major top with such a low reading of retail Bulls

- I would rule out a major top if the RSI of the NYSE is not in overbought territory. The RSI after barely crossing the oversold line is slowly reversing to the upside

However a bullish signal cross has not occurred yet (The NYSE Summation Index must cross its 10 dma):

60 minute time frame:
The rally from the March 11 low can only be counted as corrective hence barring a collapse it should fit with the scenario of an Ending Diagonal.
A corrective leg up can morph into multiple patterns. I will consider two options:
- A Double Zig Zag can be counted as completed. Hence we could assume that SPX has established the wave (A) of a larger Zig Zag up. If this is the case a wave (B) pullback should bottom in the range 2089 (200 hma and 20 dma) – 2077 (0.5 retracement). The following wave (C) up would have an equality extension target in the range 2151 – 2163 (Red count)
- SPX is unfolding a Triple Zig Zag. If this is the case a shallow wave (X) pullback should bottom around the 2099 zone. Once the wave (X) is in place price will unfold another Zig Zag higher (Blue count).

In the mean time NDX should have concluded an impulsive up leg. The impulsive structure gives confidence to a bullish outcome but it should open the door to a larger pullback wave (2) or (B) provided the gap at 4427 is filled. A common spot for a wave (2) or (B) would be located in the range 4411 (20 dma) – 4384 (0.5 retracement)


….also:
The Fed Will Not Raise Rates Amid A Strong US Dollar
“In my view, the Fed will not increase interest rates this year,” Marc Faber told CNBC in a recent interview .
“The economy simply is not taking off, so I don’t see there will be an interest rate increase.” Retail sales have dropped three months in a row, including 0.6 percent in February. Many analysts expect economic growth to slow this quarter from the fourth quarter’s 2.2 percent pace.
“The policies of central banks have grossly distorted financial markets and misallocated capital, in my opinion.”
“The Fed and other central banks would have to increase interest rates quite substantially to really knockoff stock markets.”
….to view the interview go to “The Fed Will Not Raise Rates Amid A Strong US Dollar“

-
I know Mike is a very solid investor and respect his opinions very much. So if he says pay attention to this or that - I will.
~ Dale G.
-
I've started managing my own investments so view Michael's site as a one-stop shop from which to get information and perspectives.
~ Dave E.
-
Michael offers easy reading, honest, common sense information that anyone can use in a practical manner.
~ der_al.
-
A sane voice in a scrambled investment world.
~ Ed R.
Inside Edge Pro Contributors

Greg Weldon

Josef Schachter

Tyler Bollhorn

Ryan Irvine

Paul Beattie

Martin Straith

Patrick Ceresna

Mark Leibovit

James Thorne

Victor Adair