
Bonds & Interest Rates
 Yet another central bank has announced a warning about the perils of deflation. Please consider China Central Bank Calls for Vigilance on Deflation.
China’s central bank governor Zhou Xiaochuan warned on Sunday that the country needs to be vigilant for signs of deflation and said policymakers were closely watching slowing global economic growth and declining commodity prices.
Zhou’s comments are likely to add to concerns that China is in danger of slipping into deflation and underline increasing nervousness among policymakers as the economy continues to lose momentum despite a raft of stimulus measures.
“Inflation in China is also declining. We need to have vigilance if this can go further to reach some sort of deflation or not,” Zhou said at a high-level forum in Boao, on the southern Chinese island of Hainan.
Zhou added that the speed with which inflation was slowing was a “little too quick”, though this was part of China’s ongoing market readjustment and reforms.
Historical Perspective On CPI Deflations
In its March report, the BIS took a look at the Costs of Deflations: A Historical Perspective. Here are the key findings.
Concerns about deflation – falling prices of goods and services – are rooted in the view that it is very costly. We test the historical link bet ween output growth and deflation in a sample covering 140 years for up to 38 economies. The evidence suggests that this link is weak and derives largely from the Great Depression. But we find a stronger link between output growth and asset price deflations, particularly during postwar property price deflations. We fail to uncover evidence that high debt has so far raised the cost of goods and services price deflations, in so-called debt deflations. The most damaging interaction appears to be between property price deflations and private debt.
Deflation may actually boost output. Lower prices increase real incomes and wealth. And they may also make export goods more competitive.
Once we control for persistent asset price deflations and country-specific average changes in growth rates over the sample periods, persistent goods and services (CPI ) deflations do not appear to be linked in a statistically significant way with slower growth even in the interwar period. They are uniformly statistically insignificant except for the first post-peak year during the postwar era – where, however, deflation appears to usher in stronger output growth. By contrast, the link of both property and equity price deflations with output growth is always the expected one, and is consistently statistically significant.
Conclusions
The evidence from our long historical data set sheds new light on the costs of deflations. It raises questions about the prevailing view that goods and services price deflations, even if persistent, are always pernicious. It suggests that asset price deflations, and particularly house price deflations in the postwar era, have been more damaging. And it cautions against presuming that the interaction between debt and goods and services price deflation , as opposed to debt’s interaction with property price deflations, has played a significant role in past episodes of economic weakness.
The exception to the general rule was the Great Depression but, that was also an asset bubble deflation coupled with consumer price deflation.
Meanwhile central banks on every continent are worried about something they should welcome.
Economic Challenge to Keynesians
Of all the widely believed but patently false economic beliefs is the absurd notion that falling consumer prices are bad for the economy and something must be done about them.
I have commented on this many times and have been vindicated not only by sound economic theory but also by actual historical examples.
My January 20, post Deflation Bonanza! (And the Fool’s Mission to Stop It) has a good synopsis.
And my Challenge to Keynesians “Prove Rising Prices Provide an Overall Economic Benefit” has gone unanswered.
There is no answer because history and logic both show that concerns over consumer price deflation are seriously misplaced.
Worse yet, in their attempts to fight routine consumer price deflation, central bankers create very destructive asset bubbles that eventually collapse, setting off what they should fear – asset bubble deflations following a buildup a bank credit on inflated assets.


Should you sell in April and go away?
It’s an odd question, I admit. Widespread talk of selling usually doesn’t begin until late April, when investors each year are reminded of the famous seasonal pattern “sell in May and go away.”
But it’s precisely because it is so well-known that some followers of this seasonal tendency wonder if they should act sooner rather than later. Waiting until May Day runs the risk of selling at the same time that a large number of other investors are doing the same.
Fortunately, we have real-world data on two attempts to get a jump start on the “sell in May and go away” pattern
….read more HERE
Related via EquityClock
“From a seasonal perspective, April has typically been one of the best months of the year for the equity market. Over the past 20 years, the S&P 500 Index has ended higher 75% of the time during the fourth month of the year,”
…..read more HERE

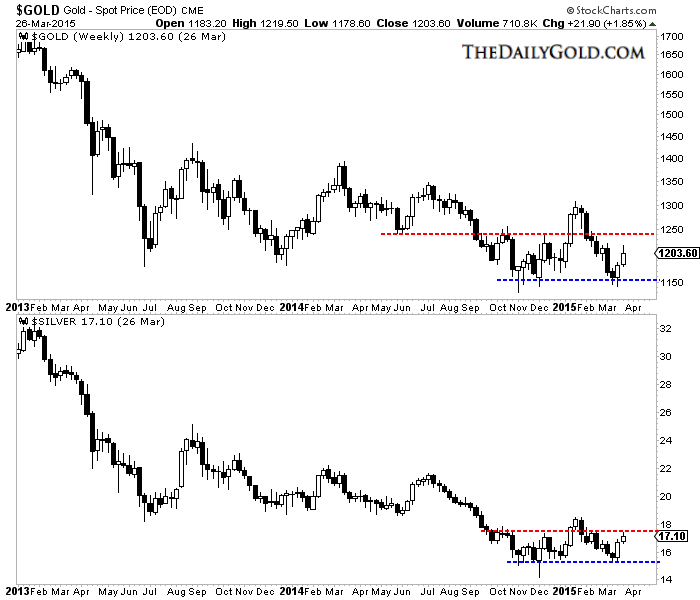
The precious metals complex has established a floor of support over the past five months. For Gold it is around $1150/oz and for Silver it is around $15.50/oz. Pick any miner index and you’ll see the support at the November and December lows. These lows could mark a base of support from which a new bull market takes hold. On the other hand, they could also mark support that if broken could lead to a final but nasty capitulation.
Below is a weekly candle chart of Gold and Silver. Support for Gold is now well defined around $1150. There is major resistance at $1220-$1240 as well as $1300. Meanwhile, Silver has support around $15.50 with resistance at $17.50 to $18.50. If the metals can takeout their January highs then they would definitely be in a new bull market. Conversely, if metals takeout their March lows to the downside, then it could mark the final breakdown of the bear market.
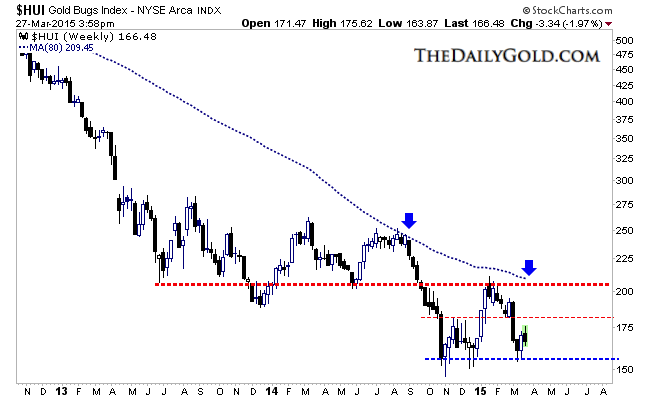
The miners are now showing relative weakness as they are down for the week while the metals are up. The HUI closed the week at 166. It failed to reach first resistance at 180, though it still could. The HUI has a confluence of strong resistance just above 200 with strong weekly support around 155. A weekly close below 155 could trigger a final breakdown while a surge above 200 would signal a new bull market.
I do see some fundamental positives for precious metals. Real rates and real yields may be headed lower in the future. Yields are declining and Fed hikes could be put off again. Inflation, ex energy seems to be slowly ticking up. Meanwhile, problems in Greece could boost Gold even in US$ terms. Any trouble in US equities could certainly be a catalyst for precious metals.
This being said, we need to respect the charts which can be considered bearish until precious metals take out higher levels or until they breakdown and become extremely oversold. I’m leaning to the latter scenario. Protect yourself and your portfolio so you can benefit from a final breakdown. In that scenario, technical indicators and sentiment indicators would reach major extremes as diehard bulls are forced to capitulate. Those are the conditions for great buying opportunities that can lead to a bear market bottom. Consider learning more about our premium service including our current favorite junior miners which we expect to outperform in the second half of 2015.


In This Week’s Issue:
In This Week’s Issue:
– Stockscores Free Webinar – Position Trading With the Stockscores Approach
– Stockscores’ Market Minutes Video – When to Buy Breakouts
– Stockscores Trader Training – 10 Ways to Be a Better Trader
– Stock Features of the Week – Abnormal Action
Stockscores Free Webinar – Position Trading With the Stockscores Approach
Wednesday April 1 – 6:00 pm PT, 9:00 pm ET
Position trades require less time to find and monitor. This webinar will show how the Stockscores indicators and Market Scan filtering tool can be used to find strong stocks for one to three months holds.Click here to register
Stockscores Market Minutes Video – When to Enter Breakouts
All stocks that do well must make a breakout but do you buy the breakout or wait for the pullback which often comes after? This week, I look at this question and then do my regular weekly market analysis.
Click here to watch
Trader Training – 10 Ways to Be a Better Trader
The stock market is constantly evolving and every day I work to improve how I trade it. Year after year I use the same basic principles and methods, just apply them in different ways to suit the current market conditions.
One of the constants that never seems to change is how fear and greed guide the market action. Succumbing to either of these emotions often leads to financial loss.
Here are 10 things you can do to become a better investor and avoid these traps:
1. Use Strategies that Work
Your approach to the market won’t have a hope if your analysis methods are not effective. There are many ways to analyze stocks, take one that you like and test it until you have confidence that it works.
2. Write a Trading Plan
Success has a better chance of happening when you write down a plan to get there. Make your plan include your rules for entry and exit, risk tolerances and a process for review. Adapt your plan over time as you find better ways to achieve success.
3. Manage Risk
Understand the risk in every trade you make and don’t take risks that you cannot tolerate. If your exposure to loss is more than you are comfortable with you will inevitably break your discipline.
4. Limit Losses
You should always know where the exit door is in case something goes wrong. When you buy a stock, decide the point where the market will have proven your decision to enter wrong. If the stock falls to that price, get out. Don’t let small losses grow in to big losses.
5. Blame Yourself
There may be a good argument for why a loss you have suffered is someone else’s fault. The newsletter writer could have been wrong, the media could have been wrong, the government could have gone back on a promise, the company could be corrupt. Blaming others will never get your money back. You will not change the actions of others, you can only change your own. Therefore, blame yourself for everything that happens with your money and take steps to make it better.
6. Stop Falling in Love
The more you know about a company, the more likely you are to ignore the market’s message. Companies want you to own their stock; the more investors that they get to own their stock, the higher the price goes. As a result, there is a bias to the information that you are exposed to, if you listen too much you may miss activity in the market that is telling you that something is wrong.
7. Practice Patience
Up trends start slowly so you have to be patient when stocks are trying to start a long term trend. The profit is in the patience, hold on to strong stocks so long as they are showing strength. When looking at a company, avoid a short term outlook that can mislead you about the long term trend.
8. See the Other Side of the Story
Everything you know about a stock may tell you to buy it and you may do so with complete commitment. But, always ask yourself, “Why is someone willing to sell to me at this price.” If you understand their motivations for selling versus your motivations for buying, you can better determine who is right. Without an understanding of the other side of the trade you can not determine whether the other side is wrong.
9. Avoid the Herd
The crowd usually loses. When buying, look around at your fellow buyers. Are they well informed, smart investors or are they generally uninformed people watching 60 Minutes? Always try to be one step ahead of the herd.
10. Analyze Your Results
The market is always evolving, making constant evolution in your approach to the markets important. On a regular basis, analyze your trades and looks for patterns of self destruction. Make changes as necessary.
![]()
The Abnormal Breaks Market Scan looks for stocks making statistically significant price gains with abnormal volume. When this happens from a low price volatility chart pattern, through resistance, the stocks often go in to an upward trend. I ran this scan today and found two that look interesting, see below.
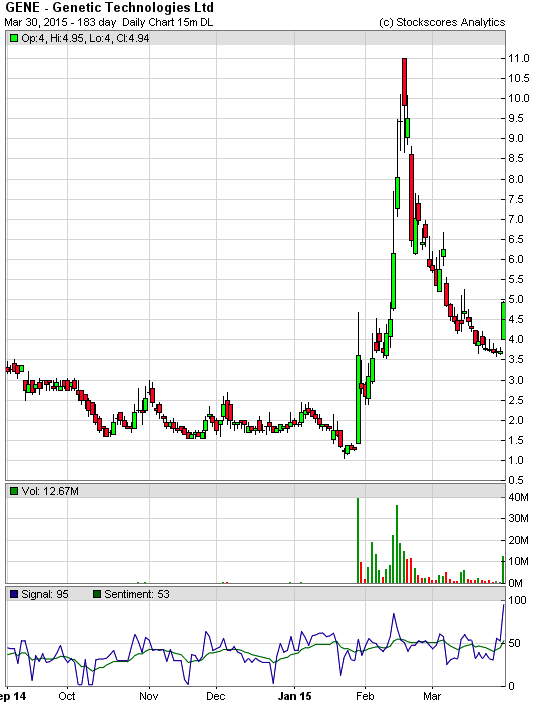
1. GENE
GENE was a really hot stock in February but cooled off on a pull back through March. It came alive again today, breaking the pullback trend line with a strong up move on heavy volume. Support at $3.60 or $4.40, depending on how aggressive you want to be.
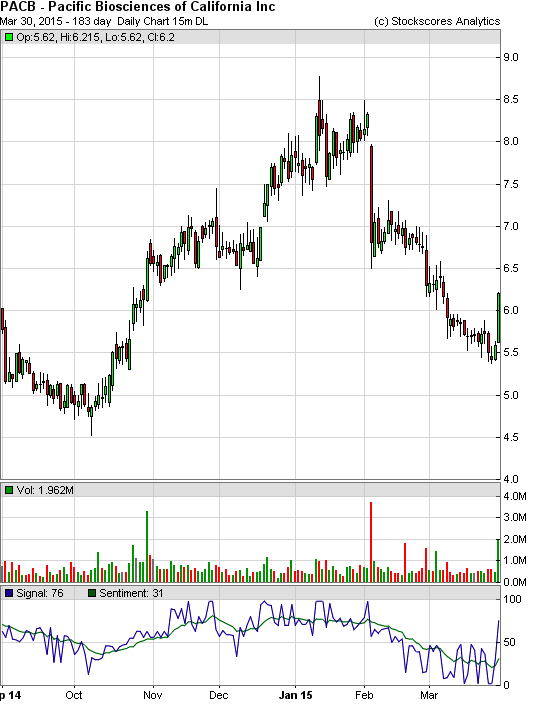
2. PACB
PACB showed abnormal price and volume activity on Monday as it broke its downward trend line from a rising bottom. Support at $5.40.
Stockscores Free Webinar – Trading Styles
There are many ways to trade the market, the choice you make depends on your time, capital, personality and skill. This webinar will consider the different choices, demonstrate the process for each and answer your questions on whether you should be a long term investor, a short term active trader or something in the middle.
References
- Get the Stockscore on any of over 20,000 North American stocks.
- Background on the theories used by Stockscores.
- Strategies that can help you find new opportunities.
- Scan the market using extensive filter criteria.
- Build a portfolio of stocks and view a slide show of their charts.
- See which sectors are leading the market, and their components.
Disclaimer
This is not an investment advisory, and should not be used to make investment decisions. Information in Stockscores Perspectives is often opinionated and should be considered for information purposes only. No stock exchange anywhere has approved or disapproved of the information contained herein. There is no express or implied solicitation to buy or sell securities. The writers and editors of Perspectives may have positions in the stocks discussed above and may trade in the stocks mentioned. Don’t consider buying or selling any stock without conducting your own due diligenc

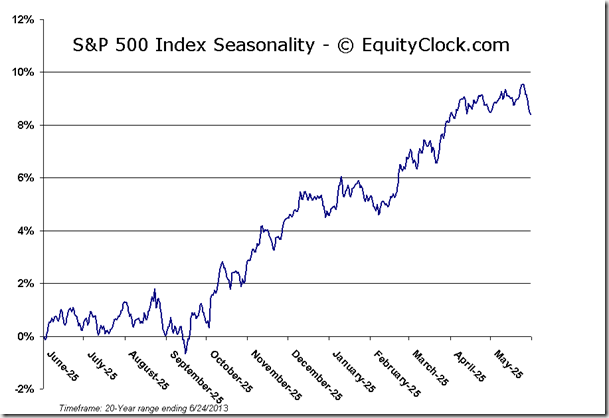
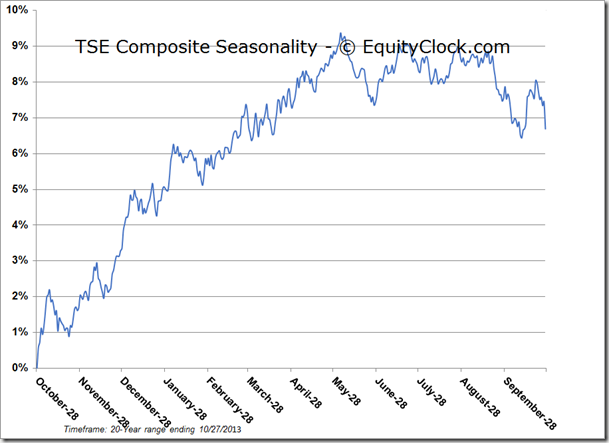
Equity markets and most sectors entered into a brief period of weakness last week. Economic news (ISM and Employment reports) will drive equity prices this week. Beyond this week, seasonal influences turn strongly positive (possibly due to anticipation of good news released by CEOs at annual meetings when they release “difficult” first quarter results e.g. stock splits, share buy backs, dividend increases). Preferred strategy is accumulate seasonally attractive economically sensitive North American and internationals equities on weakness this week for a seasonal trade lasting until at least May and possibly into July.
Seasonal influences are weak during the last two trading days in March, but turn strongly positive in April. In fact, the two strongest periods for U.S. equity indices during the year are the two week Christmas rally near the end of the year and the first two weeks in April. Average gain by the Dow Jones Industrial Average during the first two weeks in April since 1955 is 1.22% per period.
…below is commentary plus seasonal and price charts for the S&P500 & the TSE composite. To continue reading and viewing all 45 charts including commodities, currencies and interest rates go HERE
The S&P 500 Index lost 52.96 points (2.23%) last week. Intermediate trend remains up. The Index remains below its 20 day moving average. Short term momentum indicators are trending down.

The TSX Composite Index lost 129.99 points (0.87%) last week. Intermediate trend remains down (Score: 0.0). The Index remains below its 20 day moving average (Score: 0.0). Strength relative to the S&P 500 Index changed to Neutral from Negative (Score: 0.5). Technical score improved last week to 0.5 from 0.0 out of 3.0. Short term momentum indicators are trending down.
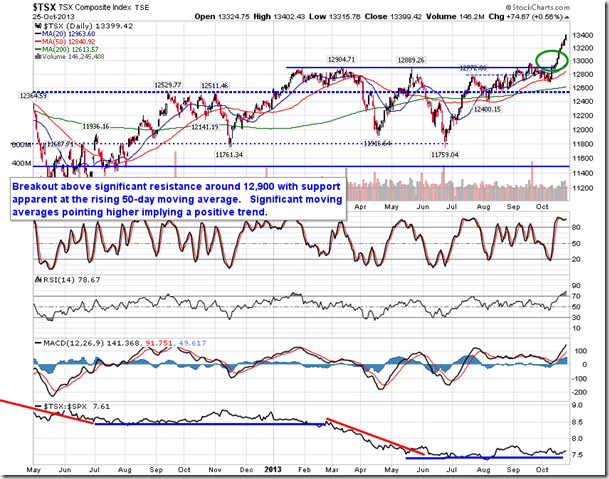
…continue reading and viewing 45 charts including commodities, currencies and interest rates HERE


-
I know Mike is a very solid investor and respect his opinions very much. So if he says pay attention to this or that - I will.
~ Dale G.
-
I've started managing my own investments so view Michael's site as a one-stop shop from which to get information and perspectives.
~ Dave E.
-
Michael offers easy reading, honest, common sense information that anyone can use in a practical manner.
~ der_al.
-
A sane voice in a scrambled investment world.
~ Ed R.
Inside Edge Pro Contributors

Greg Weldon

Josef Schachter

Tyler Bollhorn

Ryan Irvine

Paul Beattie

Martin Straith

Patrick Ceresna

Mark Leibovit

James Thorne

Victor Adair