
Currency
 Here’s one for the “seriously, you’re surprised?” file: China pegs its currency, the yuan, to the dollar, the dollar soars, taking the yuan with it…and fewer foreigners buy suddenly-much-more-expensive Chinese products. Duh.
China’s Export Engine Loses Steam, Adding to Growth Pressure
“China’s exports unexpectedly slumped last month, eroding the outlook for one of the economy’s better performing areas in recent months.
Overseas shipments fell 14.6 percent in March from a year earlier in yuan value, the customs administration said in Beijing on Monday. That compared with the median estimate for an 8.2 percent rise in a Bloomberg News survey of analysts. Imports slid 12.3 percent, leaving a trade surplus of 18.16 billion yuan ($3 billion).
The export declines come as China grapples with overcapacity and a property slump. The country’s central bank has relaxed rules on home purchasing, cut interest rates twice and reduced the ratio of reserves banks are required to set aside in the past six months, with economists forecasting further stimulus.
“Consumption is weak, investment is decelerating, and now exports have come in as weaker-than-expected,” said Liu Xuezhi, an economist with Bank of Communications Co. in Shanghai. “Downward pressure on economic growth is increasing, making it more urgent for the government to start rolling out more pro-growth policies.”
The Hang Seng index in Hong Kong pared gains after the release and the Australian dollar, seen as a proxy for China’s economy due to Australia’s shipments of raw materials, fell.
Gross domestic product data scheduled for Wednesday will probably show the economy expanded 7 percent in the first quarter from a year earlier, according to the median estimate of 38 economists in a Bloomberg survey as of April 10. That would be the slowest pace since the first quarter of 2009.
The “dismal” March export performance comes despite a higher number of working days and a low base and will spur fears that foreign demand is being undermined by a stronger yuan, Dariusz Kowalczyk, senior economist at Credit Agricole SA in Hong Kong, wrote in note after the release.
The yuan may weaken and onshore rates will be lowered, he wrote. “Odds are also rising for more government stimulus.”
So the question isn’t whether Chinese exports should fall — obviously when you raise the value of your currency by 25% the stuff you’re selling becomes more expensive and fewer orders get booked. It’s why would economists expect exports to rise by 8% in the face of a soaring yuan and slowing growth pretty much everywhere else. See Is The Whole World Slowing Down?
Or maybe there’s a deeper strategy at work. Assume that the leveraged speculating community which, since it includes the money center banks, employs most of the high-profile economists whose estimates get quoted by reporters, is desperate for more easy money to bail out their bad derivatives bets. What better way to get it than to produce ridiculously optimistic estimates of Chinese growth which are then “missed” by a mile, leading to panicked calls for more stimulus. Now it all makes sense.


 A number of emails have come in and all seem to be astonished that there is more than one type of financial crisis. Not even the famous Tulip Crisis was domestic. Tulips were also trading in London. It was the first speculation coming out of the Dark Ages as the middle-class developed. Capital poured into Holland from all over Europe. This was not just a Dutch domestic event that you could attribute to banks.
A Debt Crisis unfolds when government defaults, which has taken place many times throughout history. It is the Sovereign Debt Default that wipes out the bankers. Even the Medici had an internal code not to lend to governments for every banking institution from the 1200s up were destroyed by government defaults.
Banking crises have taken place when there is fraud. Merely lending money even leveraged will not cause a banking crisis. Asset values swing up and down and it’s the net movement between the currency and asset values that cause the problem like the silver to gold ratio. The drop in the Swiss peg suddenly raised the cost of mortgages to Greeks and Brits who denominated their debts in Swiss. Banking crisis due to outright fraud is what Andrew Jackson set in motion with destroying the central bank and state banks then issued money known as Wildcat Banking.
Then there is the currency crisis. This unfolds typically because governments have tried to fix the value of gold or silver. Bretton Woods collapsed for this reason just as the Swiss peg collapsed recently. Currency is the least understood because everyone looks to cause and effect scenarios that are only domestic – never international.

These are the three major categories. You cannot attribute every crisis to a failure of banking. The Long-Depression was cause by the US trying to over-value silver relative to gold. You cannot fix any two elements no matter what.

The stronger than expected February’s job market report fueled expectations that the Fed will increase interest rates sooner rather than later. We believed that market reaction was a bit exaggerated, and suggested in the Gold News Monitor not taking the hike for granted. The U.S. recovery is not as strong as it is commonly believed (as it was confirmed by the downgraded Fed’s economic projections) and there are many downside risks, such as Greece’s crisis, stubbornly low inflation, sluggish wage growth, the Chinese and global slowdown and too strong a greenback, which may stall the Fed’s hike.
For sure, there are many positive indicators for the American economy: solid GDP growth in 2014, and low unemployment and inflation rates. Consequently, the real disposable personal incomes as standards of living are rising. Indeed, the U.S. economy looks definitely brighter than a few years ago. It also performs better than many other developed countries, thanks mostly to a freer economy and a much more flexible job market.
On the other hand, if you scratch beneath the surface, the outlook for the U.S. economy is grimmer. We have already written in past editions of Gold Monitor News about rising inventories to sales ratio, decreasing new orders for durable goods, falling U.S. retail sales for three months in a row (in February) and the unemployment rate drop in February was mostly because people gave up looking for jobs. Some economists also question the accuracy of the data published by the Labor Department, and rightly so. February was another month with a huge discrepancy between the Labor Department’s job survey and the Census Bureau’s American Household Survey. According to the latter, the U.S. economy added only 96.000 new jobs in February, much below the 215.000 expected and the 295.000 reported by the Labor Department.
Why does such a discrepancy exist? There are many differences between those two reports, but the most important is that the nonfarm payroll survey does not include agricultural workers and the self-employed. It turns out that if we add those categories, the number of jobs actually fell from January to February. Please note that this fact also explains why the Labor Department’s data understate the job losses in the energy sector. The truth is that the U.S. oil and gas industries rely heavily on the use of independent contractors. Therefore, the workers in the energy sector are not counted as part of the nonfarm payroll, so layoffs in this industry are not covered in the establishment of employment statistics.
Another significant difference is that the payroll survey double-counts many workers who change jobs or have few part-time jobs. There are also other problems with the Labor Department’s statistics, such as an inaccurate model of birth and death of companies and seasonal adjustments. It is worth pointing out that the disparity between the payroll and household employment surveys is cyclical and widens during recessions, which may indicate that the U.S. recovery is based on rather fragile foundations. This is perhaps why the Federal Reserve’s labor market condition index, which combines 19 labor market indicators, actually fell from 4.8 in January to 4 in February. Does this look like a strong job market?
Other main macroeconomic indicators also do not look so rosy. First, the revised data show that GDP expanded in the fourth quarter at a 2.2 percent annual pace, down from the estimated 2.6 percent (advance estimates). Even more importantly, the Atlanta Fed’s real-time monitor of the U.S. GDP indicates that the economy has slowed considerably over the first quarter of this year. The FOMC (in its March statement) finally noticed that “economic growth has moderated somewhat.” And ‘somewhat’ means in this case the 0.3 percentage point, since the FOMC’s members downgraded its economic growth median projections for this year from 2.6-3.0 percent in December to 2.3-2.7 percent.
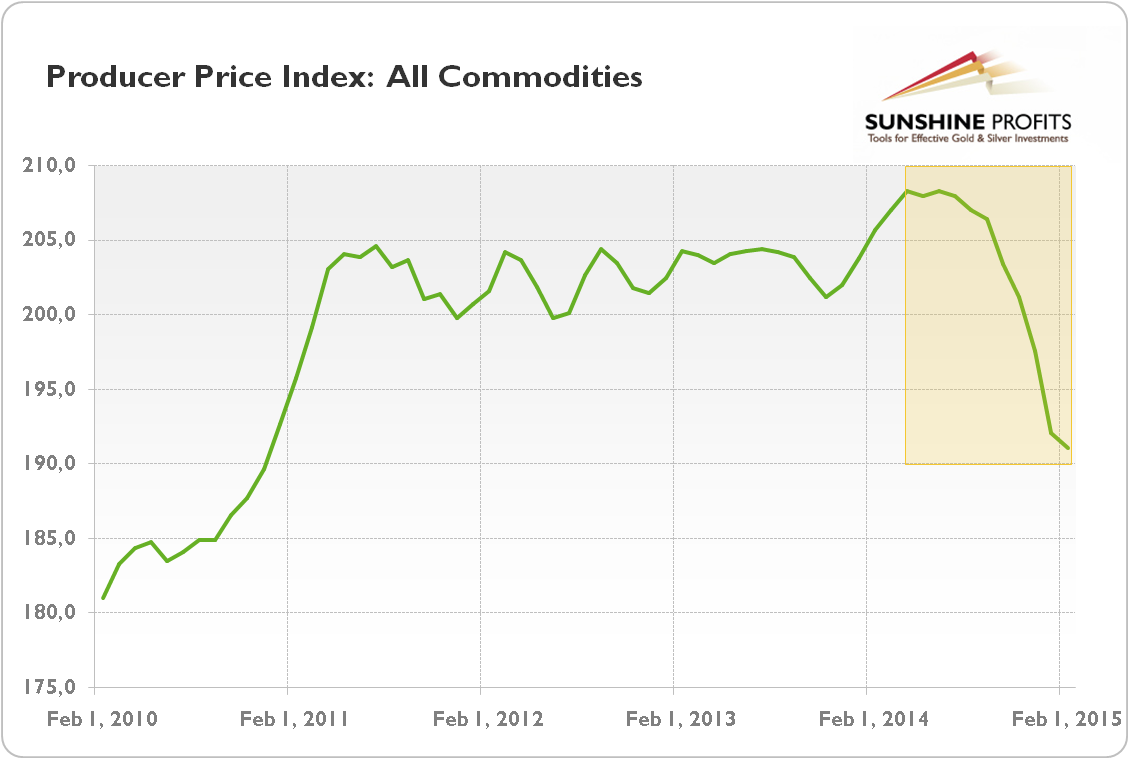
Second, the low inflation may not be transitory as Fed believes, but a sign of a coming recession. We do not consider disinflation or deflation as negative phenomena, but only when they reflect rising productivity. At present, the falling producer prices (see the chart below) signal the economic slowdown in America and globally. How else would you explain the expected fall of all nine key commodity price indices or the decline in new factory orders? No, do not blame the weather.
How does it all affect the gold market? The analysis shows that although the U.S. economy is in much better
shape compared to other countries or to itself a few years ago, the full recovery was probably proclaimed too early. It is unclear whether the Fed examines the whole spectrum of data or focuses on official statistics; however we believe that sooner rather than later it will become obvious that the U.S. economy and labor market are not as strong as the February job report suggested.
To some extent, the Fed admitted it in March, by revising its projections on economic growth (it downgraded its forecasts of the GDP growth in 2016 and 2017, which clearly shows that it is not only a harsh winter which softened the economic activity), however it increased its expectations about the employment rate.
Therefore, the Fed may slow down the hike of its interest rates (or undo it if Fed raises it eventually) even further (the U.S. central bank also cut its expectations for the level of federal funds rate over the next couple of years), which will positively affect the gold prices.
We hope you enjoyed the above article. If you’re interested in reading more, please note that we focus on the economic fundamentals in our monthly Market Overview reports and we also provide Gold & Silver Trading Alerts for traders interested more in the short-term prospects. If you’re not ready to subscribe today, please sign up for our mailing list and stay up-to-date. It’s free and you can unsubscribe anytime.
Thank you.
Arkadiusz Sieron
Sunshine Profits‘ Gold News Monitor and Market Overview Editor

Stock Markets
On this week’s release of NYSE Margin Debt, Business Insider headlined “Traders are betting on stocks with tons of borrowed money”. As noted on our last review, the pattern has been a compulsive peak in margin and a correction in the amount and the stock market. Then the peak for the stock market would be set on the secondary high for margin debt.
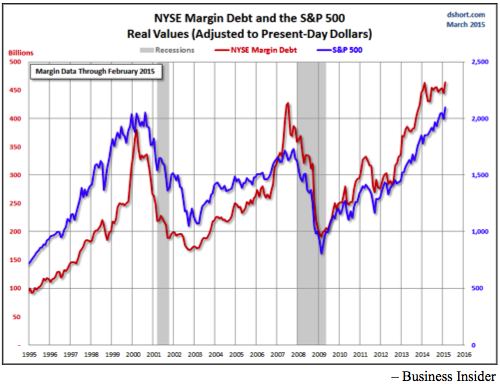
Clearly the action is working on the secondary high in margin, which is a rare “test” of the initial high. Yet another measure of extreme speculation.
And ecstasy in measurable amounts has been registering since June, which suggests the only why out is down.
Of course there has always been a compelling reason to buy or remain complacent. In 1873 it was that the Treasury System on a fiat currency was superior to a central bank constrained by gold. In 1929 the comfort was that the old and dreadful Treasury System had been replaced by a new and “scientific” central bank. In 2007 it was that the Fed had a “Dream Team” of economists.
That covers recent great financial bubbles and it is worth reviewing a “normal” bull market whereby the stock market typically peaked 10 to 12 months before the business cycle peaked. Investors stayed long as the market was declining because business and economic numbers were good.
However, this changes during the era of financial asset inflation when stocks and the business cycle peak virtually together. NBER determination of the US business cycle starts in 1857 and the examples are 1873, 1929 and 2007.
On March 19 Zero Hedge headlined “Philly Fed Signals Worst Margin Compression Since Lehman”. The conclusion was that the last two examples of profit margins plunging a recession soon followed. Going along with this, S&P Earnings are recording the sharpest drop since July 2007.
OK, the cycle for business activity and share certificates is mature and becoming precarious. Perhaps because of impatient central bankers the action is more precarious than otherwise. The extra leg up in margin debt is saying as much.
Maybe there should be an ETF on “precarious” but then the equivalent could be ETFs on volatility, the VIX.
It is worth updating the ChartWorks in February review of the old Dow Theory. At that point it had been six weeks of “non-confirmation” since both the DJIA and Transports had both set highs. In which case, the price correction would be moderate. Anything longer and the degree of correction would increase. Non-confirmation ran 10 weeks so a more significant decline would be possible.
The Dow high was set at 18288 at the end of February and it has slipped to below the 50- Day ma. At 17698 it is close to the 200-Day which is at 17339. The last correction got well below the 200-Day and concluded in October with a Springboard Buy. Whatever, it is not oversold now.
Transports set their high at 9310 in December and have gently slipped below the 200-Day at 8661. The action is not oversold.
The NYSE comp (NYA) continues on its big Rounding Top pattern. This index as well as the senior indexes set a False Breakout in late February. That was accompanied by the most bullish sentiment since 2007 and least bearish since 2000.
Extreme sentiment is one concern, which with the False Breakout, suggests the last gasp of exhausted speculators.
In the fateful year of 2007 the market cap of global equities reached $60 trillion. The crash took it down to $25 trillion and now it is at $80 trillion. Numbers are rounded.
Credit Markets
After great enthusiasm, US credit spreads reversed on the seasonal schedule in June. Widening became extreme in January as forced selling of crude oil maxed out. The rebound became very overbought into March and the spread has been trading either side of the 50-Day ma. This could continue through April. But a marked decline below the line would be an alert to further widening.
As the US expansion became somewhat more vigorous the curve has been flattening. It could run for 12 to 16 months and then roll over indicating contraction. This worked for us in 2000 and in 2007 when the boom was strong enough to invert the curve. But full inversion is not required, just the reversal to steepening would be noteworthy. April is Month Fourteen on the trend.
In a financial mania the turn to steepening was a killer at the end of the last two booms. In each example the turn was accompanied by the equivalent turn in credit spreads. This time around spreads reversed in June and the curve has yet to reverse. Both could be reversed by around mid-year.
In the meantime, long Treasuries became very overbought in January and corrected some 10 points into early March. The low price was 143 and the rebound has made it to 149. The season is favourable through April.
On the longer term, the rally to the high was described as “Ending Action”. A significant bear could follow.
Commodities
Once it started, the plunge in crude oil had a possible run of 6 or 7 months, which counted out to January. Months of choppy action would be probable, which could affect the action of other commodities.
However, our Brief Update of March 24th noted that a “rotation” into some depressed commodities was possible. It would not be as strong as the one out of January 2014.
The low on the CRB was 207 on March 18th and the initial bounce made it to the 50-Day at 220 last week. The subsequent low was 211 yesterday morning and it looks like it could rally through April.
Within this, base metals (GYX) set their low at 300, bounced to 324 last week, which was above the 50-Day. It is still above the line, which is constructive. Through 324 and the rally could make it the 335 level.
Grains (GKX) are working on the same pattern but the initial bounce did not make it above the 50-Day ma. The low was 289 and now at 300 getting above the 50-Day at 305 would be constructive.
Crude is also in the pattern and at 50 it is slightly above the 50-Day. Getting above the last high of 52.48 would be constructive.
Precious Metals
Action in the precious metals sector continues without lustre.
Lustre is elsewhere. Canada’s Financial Post headlines “Taking Investing to the Margins”. Canadians are margining houses and stocks to be in the hot action. Reported as the greatest employment of leverage in fifteen years. Over in China, inexperienced customers are opening brokerage accounts at the rate of 1.5 million – per week – as their stock market soars. This last made headlines in 2007.
It is ironical that the Fed and gold bugs both desperately need dollar depreciation. But the Fed can no longer get the “bang for the buck” regarding inflation. Instead there has been the equivalent of hyper-inflation in stocks and bonds, which is again demonstrating that the public decides what the public decides to speculate in. This is getting close to burning out when Mister Margin makes the tough decisions.
Some improvement in commodity prices into May is possible. This could help the dollar price of silver and gold. It would be constructive to have gold shares continuing to outperform the bullion price. This set a good low as crude’s crash ended in January. Earlier rallies were constrained by the 200-Day ma, which is declining. The rebound from last week’s low has to work its way above the 50-Day for the action to become positive.
The overall condition remains that the party is still in orthodox investments, which is highly leveraged. The un-party continues in precious metals where we hope there is minimal leverage employed by either bulls or bears. We also hope that at some point all of the inflation bugs will have been shaken out of the sector.
Then it can go up driven by improving returns as gold’s real price continues to rise. We have been buying some gold stocks into weakness, but are not fully invested.
Link to March 31 Bob Hoye interview on TalkDigitalNetwork.com:


-
I know Mike is a very solid investor and respect his opinions very much. So if he says pay attention to this or that - I will.
~ Dale G.
-
I've started managing my own investments so view Michael's site as a one-stop shop from which to get information and perspectives.
~ Dave E.
-
Michael offers easy reading, honest, common sense information that anyone can use in a practical manner.
~ der_al.
-
A sane voice in a scrambled investment world.
~ Ed R.
Inside Edge Pro Contributors

Greg Weldon

Josef Schachter

Tyler Bollhorn

Ryan Irvine

Paul Beattie

Martin Straith

Patrick Ceresna

Mark Leibovit

James Thorne

Victor Adair