
Stocks & Equities
“I would highlight that equity market valuations at this point generally are quite high.”
—Janet Yellen
Are you worried about the stock market? If you are, you’re in the minority of investors.
Greece… China… don’t worry about it!
At least that seems to be Wall Street’s reaction to what could have been a catastrophic fall of dominoes if the European and Chinese governments hadn’t come to the rescue with another massive monetary intervention.
If you think you’ve heard the last about Greece or a Chinese stock market meltdown, you’re in the majority. Investors are pretty darn confident about the stock market.

The John Hancock Investor Sentiment Index hit +29 in the second quarter, the highest reading since the inception of the index in January of 2011.
However, overconfidence is dangerous and often accompanies market tops.
If you listen to the hear-no-evil cheerleaders on Wall Street and CNBC, you might be inclined to think the bull market will last a couple more decades, but we haven’t had a major correction since 2011, and the Nasdaq hit an all-time high last week.
Investors are so enthusiastic that the exuberance is spilling beyond stock certificates to the high-brow world of collectible art.

Investment gamblers are shopping up art in record droves. In the last major art auction, prices for collectible art reached all-time highs, and somebody with more money than brains paid $32.8 million for an Andy Warhol painting of a $1 bill.
Who says a dollar doesn’t buy what it used to?
I’m not saying that a new bear market will start tomorrow morning, but I’m suggesting that bear markets hurt more and last longer than most investors realize.
The reality is that bear markets historically occur about every four and a half to five years, which means we are overdue. And the average loss during a bear market is a whopping 38%. Ouch!
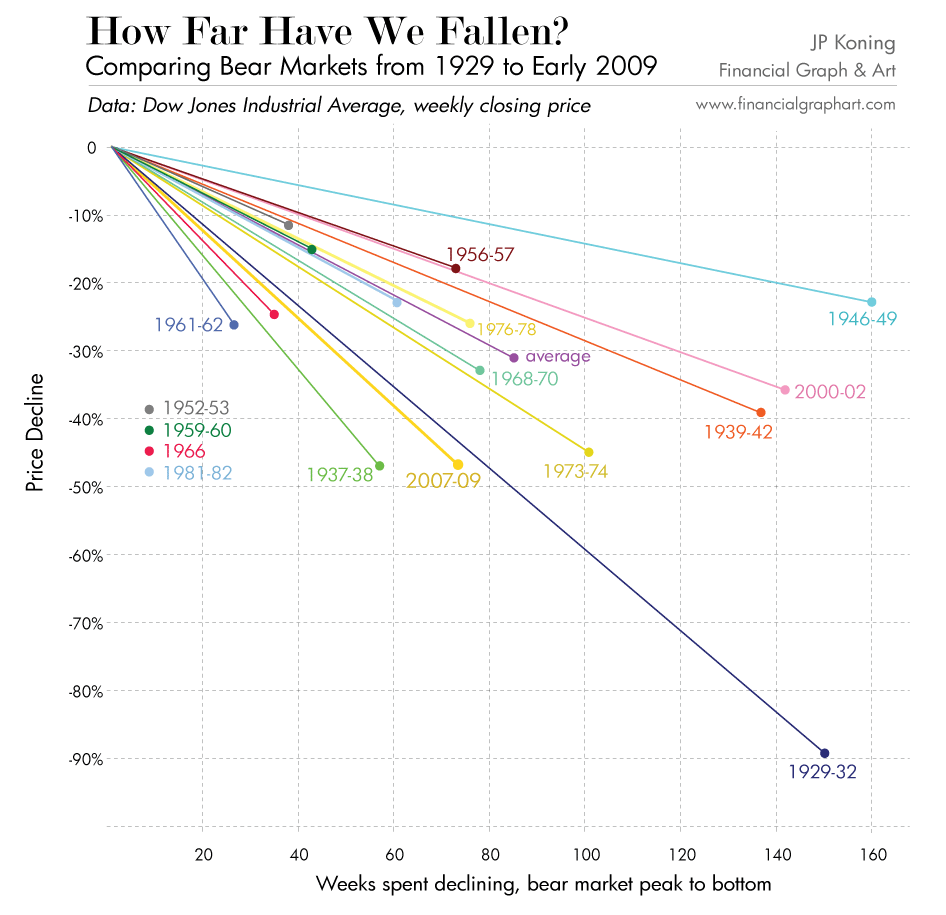
On average, a bear market lasts about two and a half years… but averages can be misleading.
In the 1973-74 bear market, investors had to wait seven and a half years to get back to even. In the 2000-02 bear market, investors didn’t break even until 2007.

Unless you, too, have drunk the Wall Street Kool Aid, you should have some type of emergency back-up plan for the next bear market. There are three basic options:
Option #1: Do nothing, get clobbered, and wait between two and a half and 10 years to get your money back. Most people think they can ride out bear markets, but the reality is that most investors—professional and individual alike—panic and sell when the pain gets too severe.
Option #2: Have some sort of defensive selling strategy in place to avoid the big downturns. That could be some type of simple moving-average selling discipline or a more complex technical analysis. At minimum, I highly recommend the use of stop losses.
Option #3: Buy some portfolio insurance with put options or inverse ETFs. That’s exactly what my Rational Bear subscribers are doing, and I expect those bear market bets to pay off in a big, big way.
Whether it is next week, next month, or next year—a bear market for US stocks is coming, and I hope you’ll have a strategy in place to protect yourself.
If you’d like to hear what worries me most about the stock market, here is a link to an interview I did last week with old friend and market watchdog Gary Halbert.

Tony Sagami
30-year market expert Tony Sagami leads the Yield Shark and Rational Bear advisories at Mauldin Economics. To learn more about Yield Shark and how it helps you maximize dividend income, click here. To learn more about Rational Bear and how you can use it to benefit from falling stocks and sectors, click here.

and…
What About Diamonds?
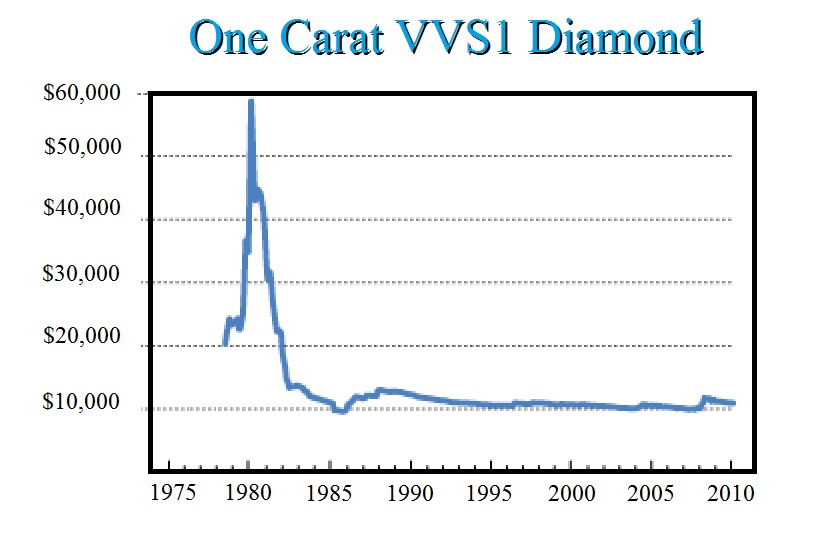
We did see diamonds reach a reaction high in 2011, yet that high should stand right now as prices move back to retest support. Keep in mind that this is correlating with gold to a large extent. Likewise, gold did not exceed the 1980 high of $2300 when adjusted for inflation.
Gold: The Pending Question
QUESTION: Martin,
With your recent comments on gold; you seem to be implicitly suggesting people to sell their gold, since there is a good chance for it to bottom-out at a sub-$1000 level. Wouldn’t it make far more sense to hold onto it at least till November?
1) We don’t know for sure whether some of the central banks actually have all the gold they claim to hold:
2) Not all of the large scale gold transactions are performed overtly:
3) The gold accounts without physical holding/delivery go unaccounted in the total global demand for gold.
Kind regards,
….Martin’s answers the questions above including time/price HERE

On its 6-month chart we can see that, like gold, silver put in a fine bull hammer on Friday on good volume, and this, along with evidence elsewhere across the sector, suggests that a short-term rally is in the offing, even if the outlook remains bleak over the longer-term. Silver is a trading buy here with a stop beneath Friday’s intraday low.

The 1-year chart is more interesting and shows that, while gold crashed an important support level, silver did not – it did not break below the support at its intraday low during a day of wild trading late at the end of November – beginning of December. It is oversold and at the support near this low, so at a good point for a relief rally to develop, although we should not lose sight of the bearish alignment of its moving averages which we can expect to act as a restraining on any rally in the near future.

The long-term 8-year chart shows that silver remains stuck in a bearmarket with a “staircase” decline in effect within a persistent downtrend. While the latest COTs certainly look encouraging, the fact of the matter is that this downtrend remains in force and it will take a clear break out of it to change this situation. On this chart we can gauge the magnitude of any short-term rally, which if it carries to the upper boundary of the downtrend, as COTs and other factors suggest is likely, would see the price ascend to the $17 area before turning lower again, with a possible scenario shown on the chart. If the support near last year’s lows is eventually breached, then another severe downleg will be in prospect as shown.

Silver’s latest COT looks bullish here, at least for the near-term, for as we can see the Commercials have scaled back their shorts to a low level, while the Large Specs have given up and “thrown in the towel” and now have their lowest holdings for a long time, possibly years. There is nothing to say, however, that in the future we won’t have a situation where the Commercials are routinely long and the Large Specs short, if this bearmarket continues.

Click on chart to popup a larger clearer version.
The longer-term Silver Hedgers chart likewise looks bullish. This chart also reveals the huge reduction in Commercial short positions in recent weeks. As we can see, readings at these levels have typically preceded rallies in the past.

Click on chart to popup a larger clearer version.
Chart courtesy of www.sentimentrader.com
Lastly the Silver Optix, or optimism index, shows a low level of optimism towards silver that has also typically preceded rallies in the past.

Click on chart to popup a larger clearer version.
Chart courtesy of www.sentimentrader.com
Both these sentimentrader charts go back to early 2011, in order to show the entire period from the bullmarket high of April – May 2011.
Finally, the chart for Coeur D’Alene Mines shown below provides circumstantial evidence that at least a short-term bottom is in, as it shows an accelerating decline into a low, where at an oversold extreme a fine large bull hammer appeared on the chart on heavy volume on Friday. A possible scenario from here has been drawn on the chart, which shouldn’t be taken too literally. Traders may consider going long CDE with a stop beneath Friday’s intraday low, with the aim of exiting the position on a rally and perhaps then reversing to short again.

End of update.

The whole “market economy” thing is turning out to be a little trickier than China’s dictators expected. To set up the story: After the 2008 crash the country borrowed about $15 trillion (an amount that dwarfs the US Fed’s quantitative easing programs) and spent the proceeds on history’s biggest infrastructure program.

This pushed up the prices of iron ore, oil, copper, etc., igniting a global commodities boom. Then China liberalized its stock trading rules, setting off a stampede into local equities that doubled prices in less than a year. The result is a classically unbalanced economy, with massive physical malinvestment, overpriced financial assets and way too much debt.
The inevitable crash began in June, and Beijing responded by tossing about 10% of GDP into equities to stop the bleeding. This worked, as such interventions tend to do, for a while. But last night it failed:
Chinese shares tumble 8.5 percent in biggest one-day drop since 2007
(Reuters) – Chinese shares slid more than 8 percent on Monday as an unprecedented government rescue plan to prop up valuations ran out of steam, throwing Beijing’s efforts to stave off a deeper crash into doubt.
Major indexes suffered their largest one-day drop since 2007, shattering three weeks of relative calm in China’s volatile stock markets since Beijing unleashed a barrage of support measures to arrest a slump that started in mid-June.
“The lesson from China’s last equity bubble is that, once sentiment has soured, policy interventions aimed at shoring up prices have only a short-lived effect,” wrote Capital Economics analysts in a research note reacting to the slide.
The CSI300 index .CSI300 of the largest listed companies in Shanghai and Shenzhen tumbled 8.6 percent to 3,818.73 points, while the Shanghai Composite Index .SSEC lost 8.5 percent to 3,725.56 points.
China’s market gyrations have stoked fears among global investors about the broader health of the world’s second biggest economy, hitting prices of growth-sensitive commodities such as copper, which fell on Monday to not far from a 6-year low.
Devaluation time?
While the prices of commodities and equities have been bouncing around, China’s currency, the yuan, has been relatively stable in US dollars, because the government pegs the former to the latter.
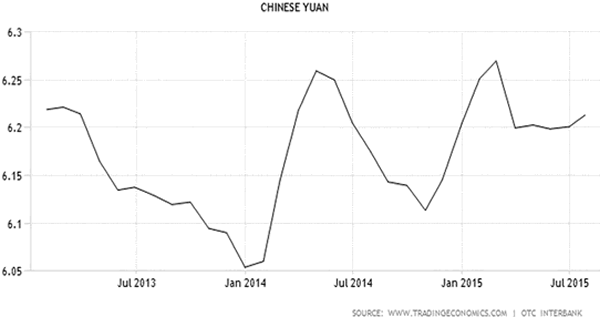
But because the dollar is way up against virtually every other currency, so is the yuan, which is a major cause of today’s crisis. Other things being equal, a rising currency makes exports more expensive and slows growth, and China’s trade has responded exactly as theory predicts:
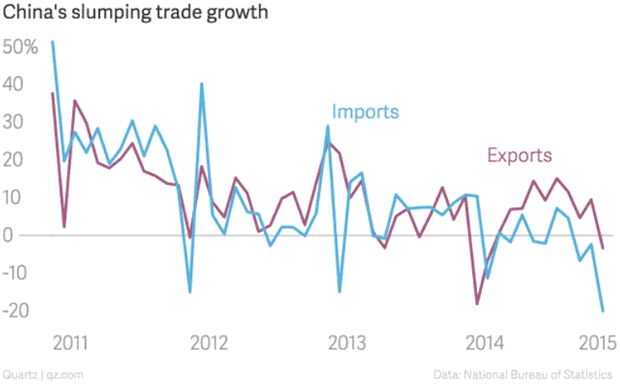
So here’s the dilemma: A too-strong currency is making it impossible for China to service its excessive debts, which is contributing to a bear market in equities, which further slows the economy and makes it even harder to service debts, and so on.
This probably seems like uncharted territory to the central planners, but is actually a pretty standard problem — for which the traditional solution is to devalue and stiff your creditors by repaying debts with cheaper currency. The US did it in the 1970s, Europe is doing it now with the euro’s recent steep decline, and much of Latin America is in various, mostly disorderly, stages of the process.
Put another way, the world is following the standard currency war script, in which countries take turns devaluing, reap modest temporary benefits, and then give up those gains when their trading partners respond in kind. China’s coming devaluation, however, will be a much bigger deal than most.
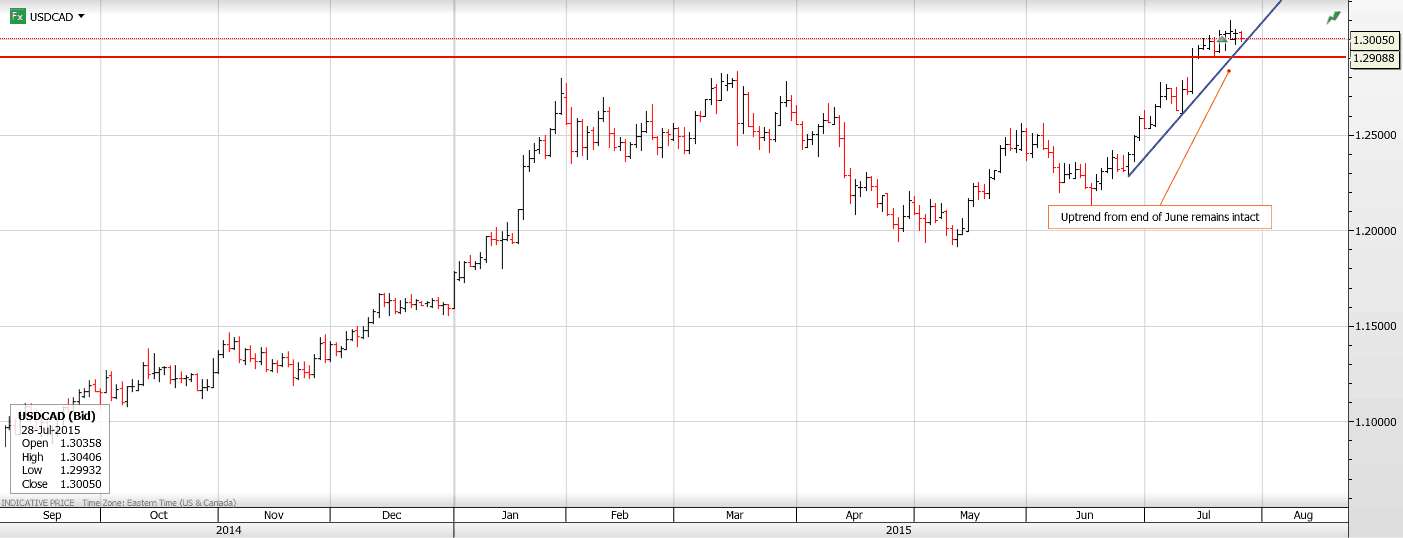
USDCAD Overnight Range 1.2995-1.3040
The commodity bloc currencies, (AUD, NZD, CAD) were the big gainers overnight, although the Loonie’s gain was rather shy of impressive. In fact it was just a tiny gain. News that both China Securities Regulatory Commission (CSRC) and China Securities Finance Co (CSFC) promised additional measures to shore up/stimulate equity markets provided a thin blanket of calm over the Chinese equity markets. It was enough for Chinese equities to limit losses on the day and AUD, NZD and CAD to rise.
GBPUSD was the start of the show in Europe, gaining on the back of a GDP number (Q2 0.7%) which was as expected.
This morning’s release of the US Case Shiller Housing Price index (Actual May 4.9% vs. forecast 5.6% y/y) was a disappointment but not really a factor for FX trading. FX direction will be dictated by continuing position adjustments ahead of tomorrow’s FOMC meeting with USDCAD traders eying WTI prices hovering just above support at $46.75. (Currently $46.95)
Technical Outlook
The USDCAD technicals are bullish while trading above the 1.2980-90 area but gains have stalled at 1.3050. Failure to take out this level could lead to more 1.2970-1.3050 consolidation. A break above 1.3050 targets 1.3110 while a move below 1.2970 opens the door to a move to 1.2900. For today, USDCAD support is at 1.2990, 1.2970 and 1.2930. Resistance is at 1.3050, 1.3090 and 1.3110.
Today’s Range 1.2990-1.3030
Chart: USDCAD daily with uptrend Larger Chart

-
I know Mike is a very solid investor and respect his opinions very much. So if he says pay attention to this or that - I will.
~ Dale G.
-
I've started managing my own investments so view Michael's site as a one-stop shop from which to get information and perspectives.
~ Dave E.
-
Michael offers easy reading, honest, common sense information that anyone can use in a practical manner.
~ der_al.
-
A sane voice in a scrambled investment world.
~ Ed R.
Inside Edge Pro Contributors

Greg Weldon

Josef Schachter

Tyler Bollhorn

Ryan Irvine

Paul Beattie

Martin Straith

Patrick Ceresna

Mark Leibovit

James Thorne

Victor Adair