
Timing & trends
Greg Weldon, weldononline.com, joins us to discuss and analyze recent developments in stocks and bonds and what the effects may be on Fed Policy and Gold. Interviewed 08/21/2015
 About Greg Weldon:
Weldon Financial produces independent research for the sophisticated investor and/or trader and offers investment management solutions that capitalize on global market trends. Greg Weldon is the founder and sole producer of all the research and operates his money management services as a registered Commodity Trading Advisor.
Weldon’s Money Monitor offers a very independent, objective view of the global markets by applying a top down market analysis and a bottom up technical analysis.
About Jordan Roy-Byrne, CMT
Jordan Roy-Byrne, CMT is the editor and publisher of The Daily Gold.

 …. Plus One Of The Greatest Opportunities in History
In HistoryWorldwide chaos in global markets continues as China’s stock market meltdown resumes and the PPT intervenes, and this came on the heels of some truly historic trading action in the Dow, so today a 50-year market veteran spoke with King World News about the global chaos, the Plunge Protection Team intervention, plus one of the greatest opportunities in history.

Gold was valuable 3,000 years ago and will be valuable 3,000 years from now. But can you say the same for dollars, euros, yen, or pounds?
Gold maintains its value (on average) over centuries. Can you expect similar longevity for debt based fiat currencies that are managed by politicians and created with printing presses or computers in central banks?
If “printing money” truly created wealth individuals and countries would be much wealthier since most central banks have been “printing” rapidly. The Fed has “printed” about $4 Trillion since the 2008 crisis to bailout banks and “stimulate” the economy. In today’s prices that would be about 3 billion ounces of gold, or approximately 30 years of global gold production. Central banks want to manage economies by using paper and digits instead of real physical gold.
Gold Facts and Gold Cycles:
Gold prices over the past 40 years have been manipulated up and down of course, but we can mostly agree that historical prices are facts. Note the graph below of gold prices – log scale over 40 years – and note the green vertical lines every 98 months – about every 8 years. Major lows have occurred about every 8 years.

Note a similar graph below showing gold highs. Vertical red lines are spaced 95 months apart – about every 8 years. Major highs have occurred about every 8 years.

Gold price parallels:
Date Price (Appx.)
August 1971 $42
April 1974 $189
August 1976 $101
January 1980 $850
April 2001 $255
August 2011 $1,923
July 2015 $1,072
- From August 1971 (when President Nixon “temporarily” terminated the dollars for gold agreement with the world) to April of 1974, gold increased in price by about a factor of 4.5. It then dropped by about 47% in 2 1/3 years.
- From April 2001 to August 2011 gold increased in price by about a factor of 7.5 and then dropped by about 46%.
- The rally into 1974 took 3 – 5 years while the 2001 – 2011 move took 10 years. The price of gold had been constrained during the 1960’s by the London Gold Pool, and when the controlled price broke free, it moved rapidly to a new and “shocking” high close to $200. The gold price had been less constrained during the 1990s so the move into 2011 took much longer.
- The 1974 – 1976 drop took about 2 years and moved about 47%. The August 2011 – July 2015 drop took twice as long and moved about 46%. Both the moves up and down took longer than in the 1970s.
GOLD SPECULATION:
- After the near 50% retracement in the 1970s, gold rose in a bubble by a factor of about 8.5 in 3.5 years.
- Suppose, since recent price moves have taken twice or three times longer, that gold moves higher for 7 – 10 more years and moves upward by a factor of 5 – 10 from the July low. That puts the price of gold at $5,000 to $10,000 in 2022 to 2025.
- That could never happen! Right? Well, maybe?
Consider (all could increase the price of gold):
- Global debt (official), not counting unfunded liabilities, exceeds $200 Trillion. It will increase but probably will not be paid. More debt means more currency in circulation, currencies are devalued, and gold becomes more expensive.
- US official debt exceeds $18 Trillion and is rapidly increasing. Unfunded liabilities, depending on who is counting, are another $100 – $200 Trillion, or more. Politicians will spend and devalue currencies.
- Excessive debt is deflationary. Central banks can’t tolerate deflation so inflation is their game. They will print and print and print. Don’t expect the “money printers” to go quietly into the night and admit failure…
- War is highly profitable for certain industries and financial groups. Those groups might foment war, and several countries might need a war to divert attention and create inflation, more debt, and stimulus to their economies.
- Currency wars, whereby countries devalue their currencies to “stimulate” exports and trade, are in progress. Nobody wins those wars.
- The Chinese stock market has already crashed.
- The US stock market is crashing.
- Unpayable debt in Greece, Italy, Chicago, Puerto Rico, and 99 others… could be a problem …
- Crude oil prices and many commodities have already crashed. Will the $Billions in junk bonds related to shale oil default?
- Will the US bomb and invade Syria?
- Escalation and more war in Ukraine?
- War with Russia?
- Escalation in South China Sea and war with China?
- Israel and Iran might not “play nice.”
- What about nuclear armed Pakistan?
- And many more …
Yes, economic and financial conditions probably will deteriorate, central banks will print, and gold prices will rise. The next 8 year gold cycle low is due in 2017 – it might be a short and sharp drop leading into several more years of rally toward the 8 year cycle high around 2019. However cycles may become less important as a consequence of overwhelming economic and financial stress. We shall see much higher gold prices, regardless of cycle influences.
A simple two question pass/fail test:
- Would you rather have a 100,000 (dollar, euro, pound) certificate of deposit (paying peanuts) in a bank that is planning a bail-in, denominated in a dodgy fiat currency backed by an arguably insolvent government ….
or
sssssssssssscv90 ounces of gold stored somewhere safe?
- Yes or No? Do you believe we can borrow our way out of debt and into prosperity?
Remember, this test is pass/fail so don’t overthink it.
Gary Christenson
The Deviant Investor

Breadth, Profitability, China, and Greece All Add Up
The S&P 500 has lost critical technical support at the 200-day moving average and the 2,000 level — putting its post-2011 uptrend in jeopardy. Many observers pooh-poohed the importance of the technical “death cross” last week. Turns out to have been meaningful indeed, as it was a milepost by which to observe the stark loss of market momentum.
S&P 500 Weekly trading at 1935 at 7:04am PST August 26th
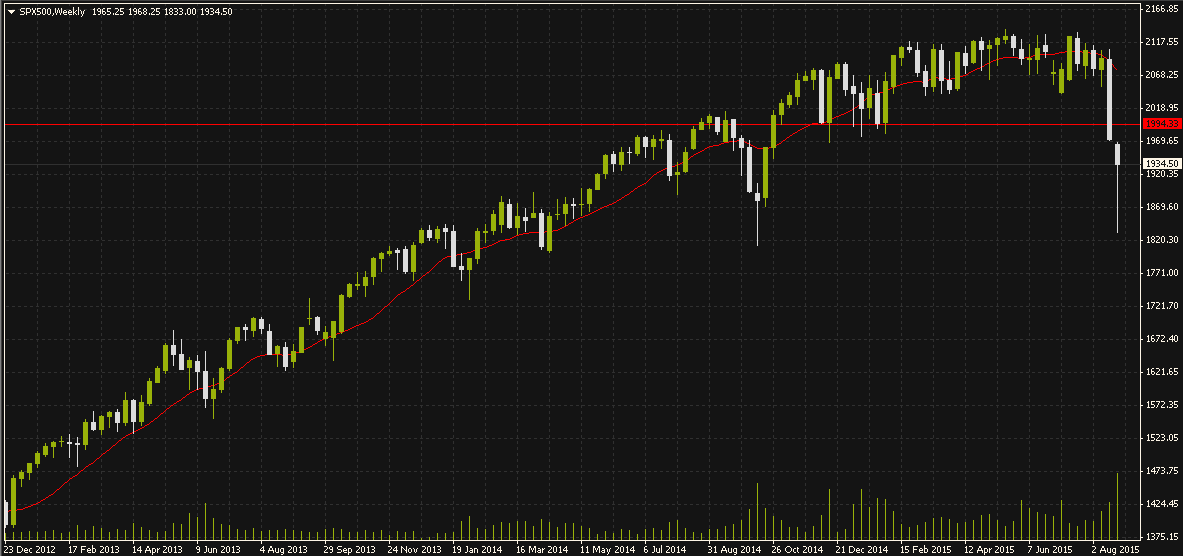
Globally, the Shanghai Composite lost its 200-day moving average — a critical measure of the long-term trend — after authorities had vigorously defended the line in the sand since early July. Bourses from Japan to Germany are all wilting. Treasury bonds and precious metals have been on the rise as investors seek safe havens. And currencies of emerging market countries from Vietnam to Kazakhstan are under pressure.
The PowerShares U.S. Dollar Bullish Fund (UUP) lost its 200-day average for the first time since last summer. The yen and the euro are rising, despite aggressive stimulus efforts by the Bank of Japan and the European Central Bank, as popular currency “carry trades” are slammed.
There may be no single driver for the decline, but a number of factors have combined in the context of what had been quiet calm in the U.S. stock market:
— There’s been a multi-month decline in market breadth, as fewer and fewer U.S. stocks participated to the upside. We have chronicled this.
— Corporate profitability has been pressured by slowdowns overseas, the stronger dollar, a tightening job market, and lower energy prices. We’ve also noted this.
— China has seen a marked slowdown in its economic data, has suffered a 32% stock market decline, and conducted a surprise devaluation of its currency last week.
— Greece is back in the news as Prime Minister Alexis Tsipras has stepped down ahead of snap elections.
— Tensions are rising on the Korean peninsula after North and South Korea exchanged artillery fire.
Besides China, the acceleration of last week’s decline seems to have been driven by concerns surrounding the approach of a potential Federal Reserve interest rate hike on Sept. 17.
We’re in the midst of “hike havoc” — not unlike the “taper tantrum” of early 2013 as former Fed Chairman Ben Bernanke considered the beginning of the end of the QE3 bond purchase stimulus program.
Will the Fed ignore building financial market turmoil or be pressured into waiting?
The Fed seems to be tilting toward an earlier rate liftoff with a pause afterwards (the “one and done” scenario for 2015). Yellen has tried, unsuccessfully, to play down the importance of liftoff timing and has said that wage growth and inflation aren’t a precondition for the initial rate hike.
St. Louis Fed President James Bullard, who famously saved the market back in October during the Ebola-driven selloff by reassuring investors that the Fed could unleash more stimulus if needed, also raised expectations of a September hike Friday when he said the Fed doesn’t react directly to equity markets and that he’s more optimistic about the global economic outlook than the market is.
For investors who have grown complacent in the belief the Fed will always support markets, this was like an ice pick through the heart on an already scary day.
The last time the Fed faced a cliffhanger decision, it blinked. Bernanke delivered a surprise “no taper” decision at the September 2013 policy meeting; postponing the taper until December, just three months before current Fed Chairman Janet Yellen began her term.
 Will Yellen fold, too? The drop in the dollar suggests currency traders believe she will.
Yet the selloff in pretty much everything else suggests a nagging fear the world’s most important central banker is about to turn hawkish, focusing on steady job gains and stable GDP growth while ignoring the market rout. According to Oxford Economics, the U.S. economy is growing at a 3% annual rate, which is not too shabby.
Capital Economics believes the Fed has set a “pretty low bar for a rate hike” and with GDP growth likely to be higher than the Fed’s June projection they not only “think that the Fed will raise rates in September, but there would appear to be a good chance of a second hike in December as well.”
Analysts at Nomura think differently, and see the odds of two rate hikes this year at only 8% and put the odds of a September hike at only 20%. Their most likely outcome is the first hike coming in December (with 44% odds) followed by no hike at all in 2015 (at 36% odds).
Much depends on the strength of the August jobs report on Sept. 4 — the last before Yellen & Co.’s fateful decision. Stay tuned.
Best wishes,
Jon Markman


The Energy Information Administration (EIA) recently released data on the history of America’s energy supply, sorted by the
share of each energy source. We’ve taken that data to create the chart associated with today’s post.
Related Topic: Mapping Every Power Plant in the United States
The early settlers to North America relied on organic materials on the surface of land for the vast majority of their energy needs. Wood, brush, and other biomass fuels were burned to warm homes, and eventually to power steam engines. Small amounts of coal were found in riverbeds and other such outcrops, but only local homes in the vicinity of these deposits were able to take advantage of it for household warmth.
During the Industrial Revolution, it was the invention of the first coal-powered, commercially practical locomotives that turned the tide. Although wood would still be used in the majority of locomotives until 1870, the transition to fossil fuels had begun.
Coke, a product of heating certain types of coal, replaced wood charcoal as the fuel for iron blast furnaces in 1875. Thomas Edison built the first practical coal-fired electric generating station in 1882, which supplied electricity to some residents in New York City. It was just after this time in the 1910s that the United States would be the largest coal producer in the world with 750,000 miners and blasting 550 million tons of coal a year.
The invention of the internal combustion engine and the development of new electrical technologies, including those developed by people like Thomas Edison and Nikola Tesla, were the first steps towards today’s modern power landscape. Fuels such as petroleum and natural gas became very useful, and the first mass-scale hydroelectric stations were built such as Hoover Dam, which opened in 1936.
The discovery and advancement of nuclear technology led to the first nuclear submarine in 1954, and the first commercial nuclear power plant in the United States in Pennsylvania in 1957. In a relatively short period of time, nuclear would have a profound effect on energy supply, and it today 99 nuclear reactors account for 20% of all electricity generated in the United States.
Related Topic: What it Takes to Power New York (Slideshow)
In more recent decades, scientists found that the current energy mix is not ideal from an environmental perspective. Advancements in renewable energy solutions such as solar, wind, and geothermal were made, helping set up a potential energy revolution. Battery technology, a key challenge for many years, has began to catch up to allow us to store larger amounts of energy when the sun isn’t shining or the wind isn’t blowing. Companies like Tesla are spending billions of dollars on battery megafactories that will have a great impact on our energy use.
Today, the United States gets the majority of its energy from fossil fuels, though that percentage is slowly decreasing. While oil is still the primary fuel of choice for transportation, it now only generates 1% of the country’s electricity through power plants. Natural gas has also taken on a bigger role over time, because it is perceived as being cleaner than oil and coal.
Today, in 2015, wind and solar power have generated 5% and 1% of total electricity respectively. Hydro generates 7%.

-
I know Mike is a very solid investor and respect his opinions very much. So if he says pay attention to this or that - I will.
~ Dale G.
-
I've started managing my own investments so view Michael's site as a one-stop shop from which to get information and perspectives.
~ Dave E.
-
Michael offers easy reading, honest, common sense information that anyone can use in a practical manner.
~ der_al.
-
A sane voice in a scrambled investment world.
~ Ed R.
Inside Edge Pro Contributors

Greg Weldon

Josef Schachter

Tyler Bollhorn

Ryan Irvine

Paul Beattie

Martin Straith

Patrick Ceresna

Mark Leibovit

James Thorne

Victor Adair