
Asset protection
Is this is just a Market Correction and time to buy at a discount….. or the beginning of a Great Financial Catastrophe where everyone will lose money.
The first article argues this is nothing more than a Market Crash similar to those in 1987, 2000, 2007. That it is not the time to dump well researched positions, that it is indeed a time to get ready to invest more capital (if you have it).
The temporary impact of the corrections listed above on long-term holdings can be seen in this chart below:
The second article argues this is the beginning of a Great Bear Market and “that 2007-8 was just a mild rehearsal of what we soon are going to experience“. That “this autumn to be the beginning of the end of the 100 year old failed experiment of manipulation and repression of the financial system by bankers and central banks.”
In other words, a long bear market is just beginning. A societal and market bear market that will dwarf anthing seen since the 1930’s.
To read the first argument, that this is just a correction, read Mauldin Economics – A Correction Fireside Chat
To read the second argument, that it is about to get as bad as it ever gets, read Egon Von Greyerz’s – The Great Financial Catastrophe

 With news that the U.S. economy grew faster than expected at a 3.7 percent annualized rate, today King World News is featuring a piece from one of the greats in the business discussing the wild trading in global stock markets, the Dow Theory “sell signal” and what to expect next. Art Cashin also weighs in with some key comments.

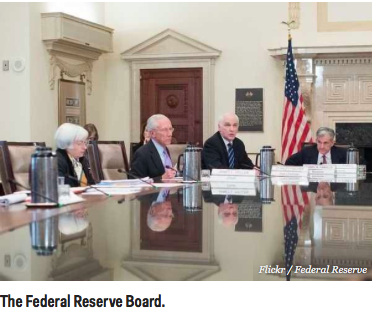 When I said in my August 13 column that the Fed was unlikely to raise rates in September or December this year, that went against conventional wisdom. Even though a couple of days earlier the Chinese central bank had devalued the RMB for the first time in over 20 years, the consensus was that the Fed would keep its word that it would raise rates “sometime this year.”
With press conferences by Chairwoman Janet Yellen set to occur after the September and December meetings, the target date for the move was September 17 when the Fed concludes its deliberations.
However, William Dudley, President of the Federal Reserve Bank of New York indicated yesterday…...continue reading HERE
 It is official; the multi-month trading range on Wall Street has now ended with a breakout to the downside. You will recall that the major US indices were in a quiet, consolidation phase since December and over the past several weeks, we wrote extensively about the deterioration in the stock market’s internals.
In fact, about a month ago, our proprietary set of trend following indicators flashed ‘market under distribution’ which prompted us to reduce our equity exposure and partially hedge our book. Unfortunately, over the past few trading sessions, these set of indicators have deteriorated even more and there is now a high probability of an autumn plunge. Accordingly, we have reduced our equity exposure even more and currently, only half of the capital under our management is invested in common stocks.
Our remaining ‘long’ positions in equities are on a very tight leash (protected by trailing stops) and if the stock market slides further and our stops are hit, our losses will be no more than 3%. On the other side of the ledger, in order to hedge our equity exposure, we have allocated 20% of our managed capital to 20-30 Year US Treasuries, 10% to 25+Year Zero Coupon US Treasuries, 5% – ‘short’ industrials, 5% – ‘short’ biotechnology and 5% – ‘long’ US Dollar. So, if the stock market declines, our small losses on our remaining ‘long’ equity positions will probably be mitigated by profits from these holdings and if things get really ugly, we will do quite well.
Look. The stock market’s internals look very weak and after peaking in April, the NYSE Advance/Decline Line has now fallen to a multi-month low. Moreover, the number of 52-week NYSE lows is staying stubbornly above the number of 52-week NYSE highs and volume is rising on down days. Last but not least, all the major US indices are now trading under the 200-day moving average and both the Dow Jones Industrial Average and the S&P500 Index have slipped to a multi-month low. Despite this awful price action, many analysts and commentators remain oblivious to the looming danger and they are urging their followers to ‘buy the dips’!
Make no mistake, to our experienced eye, this does not feel like a normal pullback within the context of an ongoing primary uptrend. Instead, it seems to us as though the major US indices and global equities are rolling over and even our primary trend filter is getting close to flashing a full blown ‘market in correction’ signal. So, our readers should remain on guard and consider liquidating all weak stocks from their investment portfolios. Furthermore, we suggest that our readers cut back on risk and consider hedging their stock holdings.
On the economic front, the developed world is caught in a liquidity trap and the low-growth environment is likely to persist. In fact, we have a nagging feeling that with the slowdown in China, the world may be sliding into an outright recession. Last year, China was responsible for 40% of global growth and without a shadow of doubt; its economic woes will affect every nation. Already, the currencies, economies and stock markets of the commodity exporting nations have been decimated and if China’s housing bubble implodes, then things will get very interesting indeed! Remember, the constituents of the S&P500 Index derive almost 40% of their revenues/earnings from overseas and a global slowdown will hurt American business. So, in this era of globalisation, it will be naïve to assume that certain nations or sectors will somehow be insulated from the carnage.
Turning back to the stock market, our remaining ‘long’ positions are in the strong sectors (banks, consumer staples, consumer discretionary and housing) and on Thursday, we got stopped out of our European equity position. So, we now have no exposure to Europe and suggest that our readers also press the ‘sell’ button (despite the ongoing QE, European markets are falling and this is very bearish).
In terms of our performance, we are pleased to report that all our strategies are outperforming our benchmark (MSCI AC World Index).
Below is the performance summary of the various strategies:
| Net return since inception (1 January 2013) | ||
|
Equity Portfolio
|
Fund Portfolio
|
Benchmark (MSCI AC World Index) |
| (+) 24.50% | (+) 24.65% | (+) 20.29% |
| Net return since inception (1 August 2014) | ||
| Blue-Chip Portfolio | Benchmark (MSCI AC World Index) | |
| (+) 1.24% | (-) 3.31% | |
Turning to commodities, a world-class crash is now unfolding and the CRB Index is now trading at levels not seen since 2002! More importantly, the price of crude is sitting just above its 2009-crash low and we suspect it is going lower. Look. The commodities markets are telling us that something is very wrong and more likely than not, they are forecasting problems in China’s housing market. Should China’s debt bubble pop, its housing market may deflate for years and in our opinion, it may also affect Hong Kong’s property market. In any event, our readers should either be ‘short’ or out of all commodities.
In terms of precious metals, both gold and silver have firmed due to the ongoing turmoil. However, the deflationary forces are simply too intense and will probably overwhelm the precious metals market. So, we do not have any exposure to these inflation hedges.
In the forex market, the emerging markets counters are really feeling the heat and even some senior currencies are sliding against the greenback. Asian currencies remain in relentless downtrends and this does not bode well for global economic growth. At present, the US Dollar Index is still gyrating within its consolidation phase, but whether the Federal Reserve hikes or not, we suspect the next big move will be to the upside. At the time of writing, the Euro is approaching its declining 200-day moving average and this should provide an area of resistance. In any event, if the Euro slips through the 1.08 level on a closing basis, we will ‘short’ the single currency.
Finally, over in the debt market, as per our expectation, long dated interest rates in the US are falling and if we get a deflationary event, we may see fresh secular lows. Over in Europe, 10-Year government bonds are yielding less than 1% and if we get a global recession, the 10-Year US Treasury Note may also join the sub-1% party! Accordingly, we have allocated 30% of our managed capital to 20-30 Year US Treasuries. Over in the corporate debt space, junk bonds have definitely topped out and the path of least resistance is down.
###
Puru Saxena Saxena Archives
email: puru@purusaxena.com
website: www.purusaxena.com
Puru Saxena publishes Money Matters, a monthly economic report, which highlights extraordinary investment opportunities in all major markets. In addition to the monthly report, subscribers also receive “Weekly Updates” covering the recent market action. Money Matters is available by subscription from www.purusaxena.com.
Puru Saxena is the founder of Puru Saxena Wealth Management, his Hong Kong based firm which manages investment portfolios for individuals and corporate clients. He is a highly showcased investment manager and a regular guest on CNN, BBC World, CNBC, Bloomberg, NDTV and various radio programs.
Copyright ©2005-2015 Puru Saxena Limited. All rights reserved.

 Originally published August 25th, 2015.
The Chinese market is of interest to us not because we necessarily want to trade it, but because of its effect on other world markets. Its heavy drop on Monday morning contributed to the rout on Wall St later in the day. The Chinese economy is a massive Ponzi scheme that is threatening to implode, with grave implications for the world economy.
A common misconception about China is that the market can’t drop too much because the Chinese government and Treasury has a huge budget surplus which it can use to wade in and prop up the market, either directly or indirectly. Veteran top bubble expert Doug Noland, of the Credit Bubble Bulletin, succinctly illuminates the stark reality of the situation as follows –
“According to SNL Financial, Chinese banks now hold four of the top five spots on the list of the world’s largest banks. Pulling data from year-end 2014 balance sheets, the big four Chinese banks – Industrial & Commercial Bank of China, China Construction Bank, Agricultural Bank of China and Bank of China – ended 2014 with assets of 87.59 TN yuan, or $13.7 TN. China’s big four saw combined Total Assets expand 64% in four years, with Loans up 80%. Estimates place total China banking system assets at $172 TN yuan to end 2014, or about $27 TN at today’s exchange rate. Since the end of 2008, banking assets have swelled 175%. Estimates show “shadow banking” assets having ballooned to the neighborhood of $5.0 TN. A bursting Chinese Super Bubble is a systemic issue – for the global economy, for global markets and for global finance. Rather quickly, China’s $3.7 TN international reserve position doesn’t seem as all-powerful.” This makes it clear that, despite its apparently huge reserves, China’s economy is a lot more vulnerable than many think.
The last update on China was posted on the site on the 12th, when the Shanghai Composite index had rallied up to the top boundary of the bear Pennant that we had correctly identified. That update called for the market to break down from this Pennant and below its rising 200-day moving average and proceed to drop hard. That is what has since happened as we know, and the purpose of this update is to delineate a probable downside target for the market for this downleg.
On the latest 1-year chart for the Shanghai Composite index, we can see that it has broken down from the Pennant and dropped steeply, crashing through the support level shown. While there is a lesser support level in the 3050 area, it is now expected to continue to drop fairly steeply, over the next several months and possibly within weeks, to the next important support level at and above about 2400.
Anyone looking for fundamental justification for further losses might want to reflect on the fact that the average PE ratio for the Chinese stockmarket is a lofty 61 – those long the market had therefore better hope it doesn’t decide to overshoot to the downside.

The Chinese market actually performs very well technically, which is probably due to the naivety of most participants in this market, and that includes the government. This is partly why we were able to call the June – July crash before it happened, admittedly a little ahead of the final high, the bounce to the 4000 area from mega-oversold in July, and then the breakdown from the Pennantleading to the latest sharp drop.

-
I know Mike is a very solid investor and respect his opinions very much. So if he says pay attention to this or that - I will.
~ Dale G.
-
I've started managing my own investments so view Michael's site as a one-stop shop from which to get information and perspectives.
~ Dave E.
-
Michael offers easy reading, honest, common sense information that anyone can use in a practical manner.
~ der_al.
-
A sane voice in a scrambled investment world.
~ Ed R.
Inside Edge Pro Contributors

Greg Weldon

Josef Schachter

Tyler Bollhorn

Ryan Irvine

Paul Beattie

Martin Straith

Patrick Ceresna

Mark Leibovit

James Thorne

Victor Adair