
Gold & Precious Metals
Now that the US stock market has gotten in sync with the rest of the world in its ups and downs, it also joins the rest of the world in generally (and loosely; it’s not a minute-by-minute relationship) being inverse to the Gold-Silver ratio (GSR, AKA the “metallic credit spread” – Hoye).
Here is the daily view of the GSR, showing a gap up and spike that came with the stock market’s big disturbance and a consolidation down that has come with its relief bounce. This is a bullish chart and so, it is a short-term bearish chart for US and global stocks. GSR broke out and is bullish while above the MA 50’s, MACD and RSI are positive and AROON is trend up.

GSR weekly is fully bullish as well. It adds a long-term up trend to the daily chart’s bull features. You can see the long and grinding journey upward GSR has taken since it was drubbed in 2010 (into 2011) by full frontal QE, as silver exploded vs. gold and the ‘inflation trade’ took off in 2010 and eventually blew out (in spring of 2011).

GSR monthly offers a different view however, as it is nearing historical resistance. Maybe when this resistance is hit it will hold and those who have, shall we say cheered so long and hard for silver can finally deliver the ultimate “I told you so!” after 4+ years of futility.

The bottom line is that the Gold-Silver ratio indicates more short-term problems in US and global stock markets, commodities and even potentially the precious metals themselves. But the bigger picture view at least offers a line in the sand (long-term resistance) where an ‘inflation trade’ may finally get going again.
That scenario could be the product of a saturation of the non-stop inflation that has been promoted in the US and globally by policy makers, with a global deflationary backdrop hiding its effects. Alternatively, it could be the product of panic by the US Central Bank, should the stock correction get serious enough. The entire recovery out of 2009 has been, after all, about risk ‘on’ asset market speculation and wealth effects.
Whatever it is, you can bet that political animals and powerful policy makers alike do not want to see the Gold-Silver ratio break out of its big picture limits.

 Richard Russell: “The Fed is still wrestling with the idea of raising rates. Ironically, raising rates could help business. A rate rise would allow the small banks to make needed loans to small business. When small business gets moving, inflation could move up, which explains why gold is creeping higher.

 “There Are No Safe Assets Anymore”
Markets have “reached some kind of a tipping point,” warns Marc Faber in this brief Bloomberg TV interview. Simply put, he explains, “because of modern central banking and repeated interventions with monetary policy, in other words, with QE, all around the world by central banks – there is no safe asset anymore.” The purchasing power of money is going down, and Faber “would rather focus on precious metals because they do not depend on the industrial demand as much as base metals or industrial commodities,” as it’s now “obvious that the Chinese economy is growing at nowhere near what the Ministry of Truth is publishing.”
….read more including Key Excerpts HERE

Published after close 02/09/15 –
US equities rallied today. Our benchmark S&P 500, which had slipped back into the correction zone (a 10% decline), opened higher and surged above that -10% stigma. By the noon hour it had given back over half its gains but then recovered to the vicinity of its opening rally shortly after the lunch hour. Some buying in the final 15 minutes took the index to its 1.83% closing gain just a few ticks from its intraday high.
The yield on the 10-year note closed at 2.20%, up 3 bps from yesterday’s close.
Here is a snapshot of past five sessions.
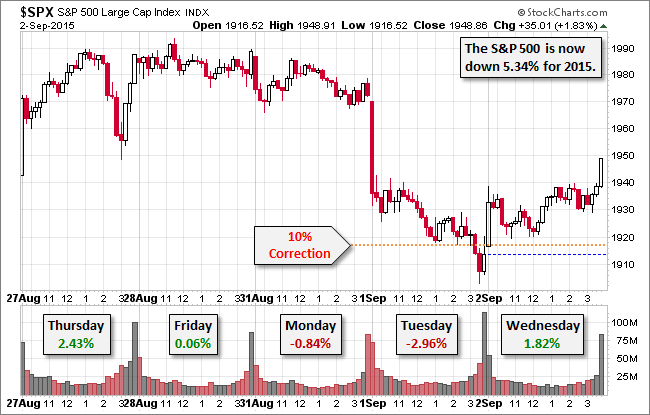
On a daily chart of the SPY ETF we see that volume on today’s gain was unremarkable and well below most of the levels during the recent selloff. It will be interesting to see if today’s advance triggers more participation tomorrow.
 Signs of The Times
Obviously, the rich harvest of headlines continues. It is worth adding that they only occur with the culmination of great financial manias. The problem is that each soaring bull market, sensational has become the norm. Stock pickers think that certain stocks and their ability to discover them are unassailable. On Business News Network, there was a fund manager boasting that while the Hang Seng index was down 20% his picks in Hong Kong were unchanged. The notion that outstanding management and the genius of the Fed are proof against major setbacks is so 1929.
It has been convenient for interventionist economics to assume that the central bank is the perfect instrument for imposing policy. In the early 1930s, most understood that the abilities of the Fed were overwhelmed by the fury of the crash. Most also understood that the boom caused the bust, which prompted the passing of the SEC and Glass-Steagall Acts. These were designed to prevent another bubble. So that there would never be another crash.
If one reviews the newspapers of the day one would read that when the Fed raised the discount rate to 6% in August 1929 it intended to tighten funds to Wall Street, but also intended to ease funds for Main Street. In the crash the NY Fed bought bonds out of the market to inject liquidity. It exceeded its authority by a factor of six. Early in 1930, a Fed official noted that they had met the crisis in the usual way by discounting liberally.
In the 1960s, as econometrics and computers ascended, intrusive economists needed the policy instrument to be perfect. Thus the argument that the guys at the Fed were deliberately tight and that caused the Great Depression.
How naïve.
Thanks to the permanency of the internet record, all of the reckless extension of Fed credit can never be buried. And now with the massive efforts made by Chinese policymakers so well publicized, the record of this massive failure will be permanently visible.
The 2007 Bubble and Crash generated some despicable policy utterances. One was that in December 2007 the establishment boasted that nothing could go wrong. The Fed had a “dream team” of economists. A crash was impossible and only two years later they were boasting that without the Fed’s magnificent efforts the crash would not have ended.
China’s recent contributions to official folly would include the following:
If in April, China had approved only 10 IPOs would the rally would have continued?
Policy intrusions, no matter how well rationalized, are mainly nonsense.
Our determinants for the peak in the SSEC needed another set of Upside Capitulations, hopefully accomplished in June ().
Commodities
Last week, we observed that the main commodity sectors, such as base metals and grains, were oversold. We wondered about the possibility of another “rotation” and decided against it.
Some commodities were oversold, but deterioration in the credit markets was getting concerning.
The key item this week is crude oil dropping to new lows and while getting oversold, in this market normal oversold may have little influence. Instead, we should look at recent seasonal forces. Over the past 15 years, there has been a tendency for crude to set serious lows in December to January.
Much the same holds for the gasoline contract.
Our view from last year remains and that is the popular notion that falling petroleum prices would help the consumers’ gas tank was not the issue. The issue was commodity price deflation.
And generally commodities remain weak, driving the DBC down to 15, which takes out the low of 16.71 set in April. All the “rotations” out of last December have been wiped out.
The cyclical peak was 32 set in April 2011, and the peak in 2008 was 45.
One of the features of the typical post-bubble condition is weakening commodities. Today’s pop to 15.18 seems tied to the setback in the DX. A relief rally that could be brief.
Lines in the Sand
In looking at the concerning issues over the weekend, on Monday the “Lines In The Sand” list was put together, as in “Hey!” through this level would mark a failure.
The most persuasive one would be the breakout on spread widening. Yesterday’s number was 220 bps, which is more than the breakout, it is becoming dramatic.
The next one would be the NYSE A/Ds taking out the last low. This was accomplished this morning. The decline is now longer than the one that completed last October. The chart follows.
Another would be the SPX taking out the 200-Day ma, which would be Step Two. Today is working on a big bar down, all of it below the key moving average.
Complacency has had remarkable popularity and showing change, the VIX has jumped from 10.88 to 17. Getting above the July high of 20 would formally end complacency.
On our Friends of The Bull Market, last week’s advice was that their shelf-life and guidance had expired.

-
I know Mike is a very solid investor and respect his opinions very much. So if he says pay attention to this or that - I will.
~ Dale G.
-
I've started managing my own investments so view Michael's site as a one-stop shop from which to get information and perspectives.
~ Dave E.
-
Michael offers easy reading, honest, common sense information that anyone can use in a practical manner.
~ der_al.
-
A sane voice in a scrambled investment world.
~ Ed R.
Inside Edge Pro Contributors

Greg Weldon

Josef Schachter

Tyler Bollhorn

Ryan Irvine

Paul Beattie

Martin Straith

Patrick Ceresna

Mark Leibovit

James Thorne

Victor Adair