
Energy & Commodities
I’m not convinced!
- Supposedly crude oil prices will stay low for a long time and perhaps drop into the $20’s. The Internet is filled with reasons explaining why crude oil prices will drop. A few are:
- Saudi Arabia is a swing producer and will provide what the world needs, regardless of price, because Saudi Arabia needs the revenue and employment for its people.
- Iranian oil will soon hit the market and provide even more supply.
- The global economic slow-down will reduce demand and prices for crude oil.
- US shale oil production will remain high because those producers desperately need the revenue for debt service. They will pump all they can and maintain supply.
- US foreign policy wants low oil prices to damage the economies of Russia and Iran. Supposedly there was a deal made with the Saudi government.
- Renewable energy will reduce demand for crude oil.
- US dollar strength will push oil prices lower.
- And many more.
I’m not convinced
- Lower oil prices may be helpful at the gasoline pump but they are deflationary, and central banks absolutely do NOT want deflation. Central banks may not be able to drive oil prices higher directly, but they certainly can drive the value of currencies lower. They have for over 100 years, so don’t expect them to reverse policy now.
- The world needs energy, lots of energy and more every day. Crude oil is an important supplier of the energy required to run modern transportation and economies.
- These low prices will not last, in my opinion. They never have. Further, low prices will bankrupt a number of oil companies, shale companies, and reduce supply. As they say, “the cure for low prices is low prices.”
- At every market bottom one will hear a dozen reasons why prices will go even lower and cannot go higher. Those reasons are often wrong.
- At every market top one will hear a dozen reasons why prices will continue even higher and, except for tiny corrections, cannot go lower. Markets always correct, sometimes harshly.
WHAT ABOUT RELEVANT RATIOS?
Examine the following Crude Oil to Silver ratio (crude oil priced in real silver)for the past 30 years. Yes, the ratio can drop further, but based on 30 years, it is currently quite low. The most likely next move is a higher ratio.

Examine the following Crude Oil to Gold ratio (crude oil priced in real gold) for the past 30 years. Yes, the ratio can drop further, but based on 30 years, it is currently quite low. The most likely next move is a higher ratio.

Examine the following 20 year chart of crude oil prices. Note the blue vertical lines that occur every 83 months – about every 7 years. The last two important lows were late 2001 and late 2008. A similar low appears to be occurring now, about August or September 2015.

There is no guarantee that a 7 year cycle will mark a bottom in the crude oil market now or soon. But don’t ignore the possibility.
Other reasons to expect a bottom in crude oil:
- The ratios to silver and gold (above) indicate that crude oil, when priced in real money such as gold and silver, are near 30 year lows.
- The technical indicators (green ovals) suggest that monthly crude oil prices are oversold and ready to turn up.
- The world is pushing toward more war. Higher crude oil prices and war go together.
- Central banks want inflation. They are likely to get it, and more than they want. Crude oil prices will rise as currencies devalue.
CONCLUSION: I’m not convinced that crude oil prices will drop much from here or remain low for many more months. Regardless of the “reasons” listed at the beginning of this article, I think higher crude oil prices are much more likely than lower prices in six months or less.
Gary Christenson
The Deviant Investor

This morning I read yet another column from a gold analyst who claims that the price-to-earnings ratios of several mining companies are now so low that the miners must be great buys.
Well, excuse me, but mining companies should almost never be bought, or sold for that matter, based on price-to-earnings ratios!
The decision as to whether or not to buy a miner should be based on the following criteria, and its price-to-earnings ratio should almost never factor into your decision. The factors you should look at are:
– The amount of gold and/or silver reserves the company has.
– The Enterprise Value (EV) per ounce of minable metal and per resources. That’s calculated as the market capitalization of the firm plus debt, minority interest and preferred shares, minus total cash and cash equivalents, divided by minable metal and then by resources to get two different figures.
– The Total Cost of Ownership (TCO) of just the mineable reserves. That’s the EV of the firm including mineable gold and/or silver, developments and cash costs.
– The “all-in sustaining costs” to produce an ounce of gold or silver. That’s bascially everything it costs to produce an ounce of gold or silver and to maintain the mine’s life. You can see the calculation in this table.

Additional factors you should consider include:
– Determining whether or not the company can cheaply finance the huge capital expenditures that are involved in the mining process.
– The expertise of the company’s management.
– Importantly, whether or not the company hedges or plans to hedge.
– How much debt the company has and at what interest rate.
– Where its properties are located.
– And more, including the very important skill of timing your purchase of the company’s shares when it’s truly time to buy!
Obviously, there’s a lot more to investing in mining shares than simply looking at price-to-earnings ratios. This is why I repeatedly feel I have to warn you about all the misinformation that’s out there.
The simple truth is that …
A. Miners have not yet bottomed.
That’s a no-brainer really, since neither the price of gold, silver or copper, nor any other metal for that matter, has bottomed.
Sure, there will be some short-term rallies in miners, some worth playing for those who want to speculate. And sure, the losses miners have taken since their peak are incredible, with the top 10 miners in the world having lost nearly 90 percent of their value and a whopping $540 billion of shareholder equity.
But overall, the mining sector has not yet bottomed and I see as much as another 50 percent lower from current prices.
B. When they do bottom, you’re going to have to be extremely careful which mining shares you buy.
For instance, on an initial screening I did this weekend, of 150 publicly-traded mining companies, I have already crossed off 129. There are now only about 21 miners on my radar screen that are worth monitoring.
Of those 21, probably only four or five will make it on to my long-term buy list.
So of those 150 I’m looking at, less than 5 percent will make the cut-off grade for my money, and obviously for yours.
This initial screening will change, since the metals’ bear market is not yet over. I expect it to change substantially, but the bottom line is this: Now is NOT the time to buy mining companies.
Now for a quick update on the metals themselves: Expect a short-term bounce to continue, but then the downtrend will resume into a highly probable and very important low in mid-November.
And the stock market: Its bounce also will soon end, leading to new lows heading into October.
Best wishes, as always …
Larry
..see more at http://www.swingtradingdaily.com

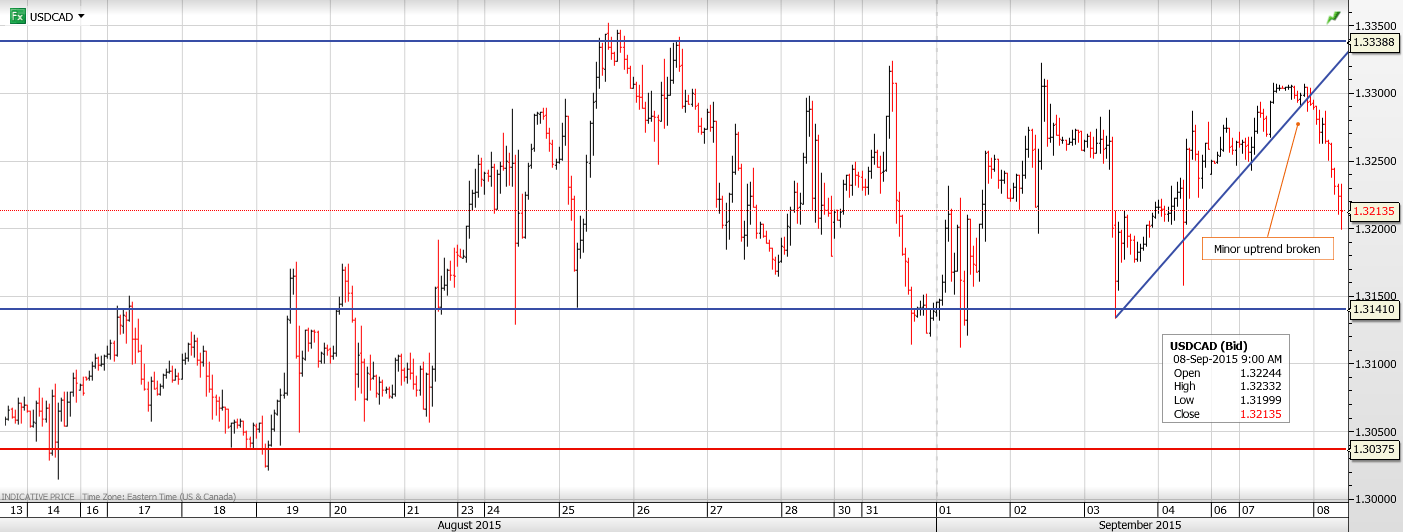
USDCAD Range (since Monday) 1.3211-1.3307
USDCAD rejected attempts to take it above 1.3310 overnight and it has given back all of its gains since yesterday due to a general US dollar retreat against the majors, with the exception of both JPY and CHF. In addition, a bounce in WTI prices from $44.15/barrel to above $45.00/b helped the Loonie’s rise.
Overnight, it was a mixed bag of news and data that attracted attention but provided no lasting US dollar direction. USDJPY rallied early but that move wasn’t sustained. China’s trade data was viewed as weak as exports declined 5.5%, even though the trade balance increased. China’s equity indices closed in the green which helped global risk sentiment.
There is a lack of data today which suggests FX trading will be governed by equity market moves. USDCAD will continue to pay close attention to WTI while positions get adjusted ahead of tomorrows’ Bank of Canada interest rate decision and statement.
Technical Outlook
The intraday rally rejected gains above 1.3300 and subsequently reversed. The break below 1.3260 points to further losses to 1.3180, representing the ragged, mid-August uptrend line. A break of 1.3180 suggests a steeper drop to 1.3150 and then the 1.3100-10 area. A move above 1.3350 would target 1.3450.
Today’s Range 1.3180-1.3260
Chart: USDCAD 1 hour with broken intraday uptrend shown Larger Chart


In this week’s issue:
- Weekly Commentary
- Strategy of the Week
- Stocks That Meet The Featured Strategy
In This Week’s Issue:
– Stockscores’ Market Minutes Video – Process Maps
– Stockscores Trader Training – Market Cycles
– Stock Features of the Week – Good Dogs
Stockscores Market Minutes Video – Process Maps
Applying your trading strategies effectively requires a well thought out and repeatable process. Drawing out a process map can help you be more effective and profitable as a trader. That plus my weekly market commentary.Click Here to Watch To get instant updates when I upload a new video, subscribe to the Stockscores Youtube Channel.
Trader Training – Market Cycles
I don’t believe you can apply the same investment strategy through all market conditions and be successful. As conditions change, so too should the way you trade the market. Stocks and markets have a life cycle and adapting your approach to where in the cycle they are will improve the performance of your portfolio. Here are 8 phases that we tend to see stocks go through in their stock market cycle:
Phase 1 – Parking Lot
In the Parking Lot phase the stock will go sideways without a significant trend, remaining above long term support but also below long term resistance. As rising bottoms begin to form on the chart, accumulation begins as investors grow optimistic. During the latter part of this phase, the Stockscores Optimistic Consolidations strategy will work well at anticipating a breakout through resistance. The Sentiment Stockscore will tend to languish aimlessly between 40 and 60.
Phase 2 – Smart Money
Those who know most about the company are buying the stock on the break through long term resistance. Typically, the breakout through resistance will come with abnormal price and volume activity. The Stockscores Simple and Longterm Breakout Strategies will identify stocks at this most profitable phase. The uptrend will usually start slow and a pull back to support after the breakout often occurs. The general public are not big buyers of the stock during this phase. During this phase the Sentiment Stockscore will cross above 60 and the Signal Stockscore will break above 80 on days when abnormal trading activity signals accumulation by the smart money.
Phase 3 – Pull Back
As the stock’s price rises myopic investors will take profits, causing three to five day pull backs from the high. This sets up the Stockscores swing trading strategy, Pull Back Plays. When the short term profit taking appears to be over smart bargain hunters buy shares in anticipation of a bounce back in favor of the longer term upward trend. As the trend continues higher, more and more retail investors take ownership of the company’s shares as the Smart Money phase buyers begin to distribute their holdings. The Sentiment Stockscore will usually remain well above 60 during this phase although the Signal Stockscore may pull back below 70.
Phase 4 – Change of Control
In an upward trend, the buyers are in control of the market. As prices climb higher, buyers lose their enthusiasm for the stock and the sellers are able to take back control. This brings an abnormal move to the downside that breaks the upward trend line, a break that is usually accompanied by abnormal volume. This sets up a Stockscores short selling strategy, Breaking Uptrends. The Sentiment Stockscore may be falling but is likely above 60 with the Signal Stockscore now coming below 60.
Phase 5 – Power Cycle
Most stocks don’t get to see Phase 5 where the long term trend shows its true force and breaks the change of control back in favor of the buyers. The medium term downward trend line is broken as the stock works to resume the longer term upward trend. The Stockscores Bottom Fishing strategy will identify these stocks as the Sentiment Stockscore crosses back above 60 and the stock breaks through short term resistance.
Phase 6 – Denial
Normal people avoid pain and hold on to their losers way too long. During the Denial phase the Smart Money investors have typically moved on to other stocks and now the stock is being bought by those in denial of the truth – this stock is a dog. The Sentiment Stockscore is below 60 and the stock is breaking down below longer term support levels as the sellers are clearly in control of the market. The Stockscores Long Term Breakdowns will find stocks in this phase as the Signal Stockscores will often spike down below 20 on important technical breakdown days.
Phase 7 – Pull Ups
Throughout the downtrend bargain hunters who still believe in the company will try to buy stock, thinking they are getting a bargain. Swing traders can take advantage of the longer momentum working in their favor by short selling the stock in to these brief upward price moves that tend to only last about 5 days. The Stockscores Pull Ups strategy will identify stocks that have shown short term strength while longer term weakness prevails. The Sentiment Stockscore will be below 50 but the Signal Stockscore may be able to spike above 60 during this phase.
Phase 8 – Fear
Emotion causes investors to make mistakes. As the stock falls farther and farther investors feel more and more fear until they can not take the pain any more and sell the stock in disgust. As the stock approaches long term support it is often a bargain fundamentally and well informed investors will buy the stock at a bargain. As fear culminates in irrational selling, the stock is able to bounce off of long term support for a brief but often profitable trade. The Sentiment Stockscore will usually be below 20 but the stock will approach long term support levels that held up as a boundary on the trading range during the parking lot phase.
Keep these phases in mind when you look at any stock or market and use this long term cycle analysis to determine the appropriate Stockscores trading strategy.

Lately, many of the top performing, short term trades, have been in stocks that have pretty ugly looking charts. These are dogs that no one likes but, with some positive fundamental change, there is a quick rush to own them. When stocks are able to attract buyers against a lot of pessimism, they often make sharp, short term gains. This week, I highlight a couple of dogs that I have bought today. I don’t intend to hold them long, just enjoy the moment when these dogs get some attention.
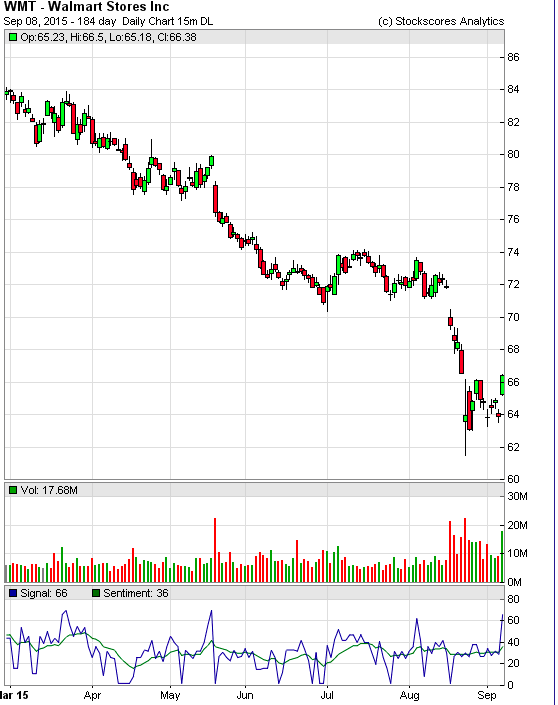
1. WMT
WMT has been in a parabolic sell off lately but the buyers came back to it today. I expect it will rally back up to its long term downward trend line, somewhere around $70.
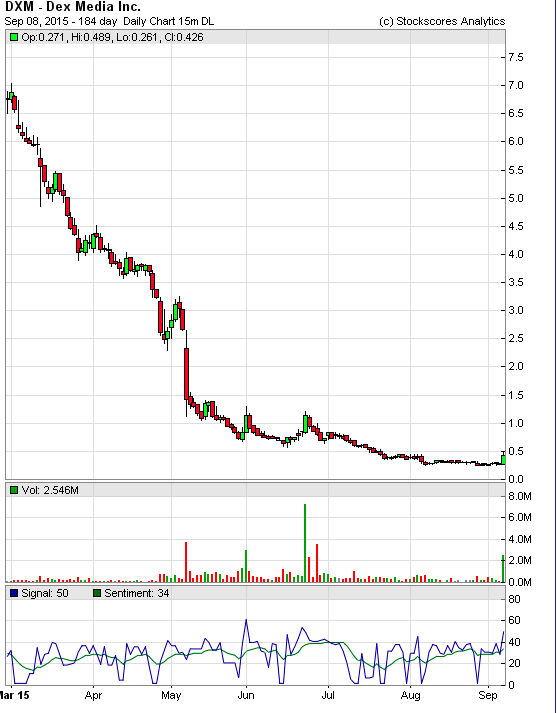
2. DXM
Shareholders of DXM have suffered miserably in 2015, the stock started the year over $8 and is now in the $0.40 range. Something has caught buyer interest today, however, as it is trading a lot more volume than normal and is up over 50% at the time I am writing it. I picked up this morning with the thought that it could rally back to $1 in the near term.
References
- Get the Stockscore on any of over 20,000 North American stocks.
- Background on the theories used by Stockscores.
- Strategies that can help you find new opportunities.
- Scan the market using extensive filter criteria.
- Build a portfolio of stocks and view a slide show of their charts.
- See which sectors are leading the market, and their components.
Disclaimer
This is not an investment advisory, and should not be used to make investment decisions. Information in Stockscores Perspectives is often opinionated and should be considered for information purposes only. No stock exchange anywhere has approved or disapproved of the information contained herein. There is no express or implied solicitation to buy or sell securities. The writers and editors of Perspectives may have positions in the stocks discussed above and may trade in the stocks mentioned. Don’t consider buying or selling any stock without conducting your own due diligenc
 There is a growing sense across the financial spectrum that the world is about to turn some type of economic page. Unfortunately no one in the mainstream is too sure what the last chapter was about, and fewer still have any clue as to what the next chapter will bring. There is some agreement however, that the age of ever easing monetary policy in the U.S. will be ending at the same time that the Chinese economy (that had powered the commodity and emerging market booms) will be finally running out of gas. While I believe this theory gets both scenarios wrong (the Fed will not be tightening and China will not be falling off the economic map), there is a growing concern that the new chapter will introduce a new character into the economic drama. As introduced by researchers at Deutsche Bank, meet “Quantitative Tightening,” the pesky, problematic, and much less disciplined kid brother of “Quantitative Easing.” Now that QE is ready to move out…QT is prepared to take over.
For much of the past generation foreign central banks, led by China, have accumulated vast quantities of foreign reserves. In August of last year the amount topped out at more than $12 trillion, an increase of five times over levels seen just 10 years earlier. During that time central banks added on average $824 billion in reserves per year. The vast majority of these reserves have been accumulated by China, Japan, Saudi Arabia, and the emerging market economies in Asia (Shrinking Currency Reserves Threaten Emerging Asia, BloombergBusiness, 4/6/15). It is widely accepted, although hard to quantify, that approximately two-thirds of these reserves are held in U.S. dollar denominated instruments (COFER, Washington DC: Intl. Monetary Fund, 1/3/13), the most common being U.S. Treasury debt.
Initially this “Great Accumulation” (as it became known) was undertaken as a means to protect emerging economies from the types of shocks that they experienced during the 1997-98 Asian Currency Crisis, in which emerging market central banks lacked the ammunition to support their free falling currencies through market intervention. It was hoped that large stockpiles of reserves would allow these banks to buy sufficient amounts of their own currencies on the open market, thereby stemming any steep falls. The accumulation was also used as a primary means for EM central banks to manage their exchange rates and prevent unwanted appreciation against the dollar while the Greenback was being depreciated through the Federal Reserve’s QE and zero interest rate policies.
The steady accumulation of Treasury debt provided tremendous benefits to the U.S. Treasury, which had needed to issue trillions of dollars in debt as a result of exploding government deficits that occurred in the years following the Financial Crisis of 2008. Without this buying, which kept active bids under U.S. Treasuries, long-term interest rates in the U.S. could have been much higher, which would have made the road to recovery much steeper. In addition, absent the accumulation, the declines in the dollar in 2009 and 2010 could have been much more severe, which would have put significant upward pressure on U.S. consumer prices.
But in 2015 the tide started to slowly ebb. By March of 2015 global reserves had declined by about $400 billion in just about 8 months, according to data compiled by Bloomberg. Analysts at Citi estimate that global FX reserves have been depleted at an average pace of $59 billion a month in the past year or so, and closer to $100 billion per month over the last few months (Brace for QT…as China leads FX reserves purge, Reuters, 8/28/15). Some think that these declines stem largely by actions of emerging economies whose currencies have been falling rapidly against the U.S. dollar that had been lifted by the belief that a tightening cycle by the Fed was a near term inevitability.
It was speculated that China led the reversal, dumping more than $140 billion in Treasuries in just three months (through front transactions made through a Belgian intermediary – solving the so-called “Belgian Mystery”) (China Dumps Record $143 Billion in US Treasurys in Three Months via Belgium, Zero Hedge, 7/17/15). The steep decline in the Chinese stock market has also sparked a flight of assets out of the Chinese economy. China has used FX sales as a means to stabilize its currency in the wake of this capital flight.
The steep fall in the price of oil in late 2014 and 2015 also has led to diminished appetite for Treasuries by oil producing nations like Saudi Arabia, which no longer needed to recycle excess profits into dollars to prevent their currencies from rising on the back of strong oil. The same holds true for nations like Russia, Brazil, Norway and Australia, whose currencies had previously benefited from the rising prices of commodities.
Analysts at Deutsche Bank see this liquidation trend holding for quite some time. However, new categories of buyers to replace these central bank sellers are unlikely to emerge. This changing dynamic between buyers and sellers will tend to lower bond prices, and increase bond yields (which move in the opposite direction as price). Citi estimates that every $500 billion in Emerging Markets FX drawdowns will result in 108 basis points of upward pressure placed on the yields of 10-year U.S. Treasurys (It’s Official: China Confirms It Has Begun Liquidating Treasuries, Warns Washington, Zero Hedge, 8/27/15). This means that if just China were to dump its $1.1 trillion in Treasury holdings, U.S. interest rates would be about 2% higher. Such an increase in rates would present the U.S. economy and U.S. Treasury with the most daunting headwinds that they have seen in years.
The Federal Reserve sets overnight interest rates through its much-watched Fed Funds rate (that has been kept at zero since 2008). But to control rates on the “long end of the curve’ requires the Fed to purchase long-dated debt on the open market, a process known as Quantitative Easing. The buying helps push up bond prices and push down yields. It follows then that a process of large scale selling, by foreign central banks, or other large holders of bonds, should be known as Quantitative Tightening.
Potentially making matters much worse, Janet Yellen has indicated the Fed’s desire to allow its current hoard of Treasurys to mature without rolling them over. The intention is to shrink the Fed’s $4.5 trillion dollar balance sheet back to its pre-crisis level of about $1 trillion. That means, in addition to finding buyers for all those Treasurys being dumped on the market by foreign central banks, the Treasury may also have to find buyers for $3.5 trillion in Treasurys that the Fed intends on not rolling over. The Fed has stated that it hopes to effectuate the drawdown by the end of the decade, which translates into about $700 billion in bonds per year. That’s just under $60 billion per month (or slightly smaller than the $85 billion per month that the Fed had been buying through QE). Given the enormity of central bank selling, and the incredibly low yields offered on U.S. Treasurys, I cannot imagine any private investor willing to step in front of that freight train.
So even as the Fed apparently is preparing to raise rates on the short end of the curve, forces beyond its control will be pushing rates up on the long end of the curve. This will seriously undermine the health of the U.S. economy even while many signs already point to near recession level weakness. Just this week, data was released that showed U.S. factory orders decreasing 14.7% year-over-year, which is the ninth month in a row that orders have declined year-over-year. Historically, this type of result has only occurred either during a recession, or in the lead up to a recession.
The August jobs report issued today, which was supposed to be the most important such report in years, as it would be the final indication as to whether the Fed would finally move in September, provided no relief for the Fed’s quandaries. While the headline rate fell to a near generational low of 5.1%, the actual hiring figures came in at just 173,000 jobs, which was well below even the low end of the consensus forecast. Private sector hiring led the weakness, manufacturing jobs declined, and the labor participation rate remained at the lowest level since 1976. So even while the Fed is indicating that it is still on track for a rate hike, all the conditions that Janet Yellen wanted to see confirmed before an increase are not materializing. This is a recipe for more uncertainty, even while certainty increases overseas that U.S. Treasurys are troubled long term investments.
The arrival of Quantitative Tightening will provide years’ worth of monetary headwinds. Of course the only tool that the Fed will be able to use to combat international QT will be a fresh dose of domestic QE. That means the Fed will not only have to shelve its plan to allow its balance sheet to run down (a plan I never thought remotely feasible from the moment it was announced), but to launch QE4, and watch its balance sheet swell towards $10 trillion. Of course, these monetary crosscurrents should finally be enough to capsize the U.S. dollar.
###
|
Click here to buy Peter Schiff’s best-selling, latest book, “How an Economy Grows and Why It Crashes.” For a more in depth analysis of our financial problems and the inherent dangers they pose for the US economy and US dollar, you need to read Peter Schiff’s 2008 bestseller “The Little Book of Bull Moves in Bear Markets” [buy here] And “Crash Proof 2.0: How to Profit from the Economic Collapse” [buy here] |

-
I know Mike is a very solid investor and respect his opinions very much. So if he says pay attention to this or that - I will.
~ Dale G.
-
I've started managing my own investments so view Michael's site as a one-stop shop from which to get information and perspectives.
~ Dave E.
-
Michael offers easy reading, honest, common sense information that anyone can use in a practical manner.
~ der_al.
-
A sane voice in a scrambled investment world.
~ Ed R.
Inside Edge Pro Contributors

Greg Weldon

Josef Schachter

Tyler Bollhorn

Ryan Irvine

Paul Beattie

Martin Straith

Patrick Ceresna

Mark Leibovit

James Thorne

Victor Adair