


In this week’s issue:
- Weekly Commentary
- Strategy of the Week
- Stocks That Meet The Featured Strategy
In This Week’s Issue:
– Stockscores’ Market Minutes Video – Process Maps
– Stockscores Trader Training – Market Cycles
– Stock Features of the Week – Good Dogs
Stockscores Market Minutes Video – Process Maps
Applying your trading strategies effectively requires a well thought out and repeatable process. Drawing out a process map can help you be more effective and profitable as a trader. That plus my weekly market commentary.Click Here to Watch To get instant updates when I upload a new video, subscribe to the Stockscores Youtube Channel.
Trader Training – Market Cycles
I don’t believe you can apply the same investment strategy through all market conditions and be successful. As conditions change, so too should the way you trade the market. Stocks and markets have a life cycle and adapting your approach to where in the cycle they are will improve the performance of your portfolio. Here are 8 phases that we tend to see stocks go through in their stock market cycle:
Phase 1 – Parking Lot
In the Parking Lot phase the stock will go sideways without a significant trend, remaining above long term support but also below long term resistance. As rising bottoms begin to form on the chart, accumulation begins as investors grow optimistic. During the latter part of this phase, the Stockscores Optimistic Consolidations strategy will work well at anticipating a breakout through resistance. The Sentiment Stockscore will tend to languish aimlessly between 40 and 60.
Phase 2 – Smart Money
Those who know most about the company are buying the stock on the break through long term resistance. Typically, the breakout through resistance will come with abnormal price and volume activity. The Stockscores Simple and Longterm Breakout Strategies will identify stocks at this most profitable phase. The uptrend will usually start slow and a pull back to support after the breakout often occurs. The general public are not big buyers of the stock during this phase. During this phase the Sentiment Stockscore will cross above 60 and the Signal Stockscore will break above 80 on days when abnormal trading activity signals accumulation by the smart money.
Phase 3 – Pull Back
As the stock’s price rises myopic investors will take profits, causing three to five day pull backs from the high. This sets up the Stockscores swing trading strategy, Pull Back Plays. When the short term profit taking appears to be over smart bargain hunters buy shares in anticipation of a bounce back in favor of the longer term upward trend. As the trend continues higher, more and more retail investors take ownership of the company’s shares as the Smart Money phase buyers begin to distribute their holdings. The Sentiment Stockscore will usually remain well above 60 during this phase although the Signal Stockscore may pull back below 70.
Phase 4 – Change of Control
In an upward trend, the buyers are in control of the market. As prices climb higher, buyers lose their enthusiasm for the stock and the sellers are able to take back control. This brings an abnormal move to the downside that breaks the upward trend line, a break that is usually accompanied by abnormal volume. This sets up a Stockscores short selling strategy, Breaking Uptrends. The Sentiment Stockscore may be falling but is likely above 60 with the Signal Stockscore now coming below 60.
Phase 5 – Power Cycle
Most stocks don’t get to see Phase 5 where the long term trend shows its true force and breaks the change of control back in favor of the buyers. The medium term downward trend line is broken as the stock works to resume the longer term upward trend. The Stockscores Bottom Fishing strategy will identify these stocks as the Sentiment Stockscore crosses back above 60 and the stock breaks through short term resistance.
Phase 6 – Denial
Normal people avoid pain and hold on to their losers way too long. During the Denial phase the Smart Money investors have typically moved on to other stocks and now the stock is being bought by those in denial of the truth – this stock is a dog. The Sentiment Stockscore is below 60 and the stock is breaking down below longer term support levels as the sellers are clearly in control of the market. The Stockscores Long Term Breakdowns will find stocks in this phase as the Signal Stockscores will often spike down below 20 on important technical breakdown days.
Phase 7 – Pull Ups
Throughout the downtrend bargain hunters who still believe in the company will try to buy stock, thinking they are getting a bargain. Swing traders can take advantage of the longer momentum working in their favor by short selling the stock in to these brief upward price moves that tend to only last about 5 days. The Stockscores Pull Ups strategy will identify stocks that have shown short term strength while longer term weakness prevails. The Sentiment Stockscore will be below 50 but the Signal Stockscore may be able to spike above 60 during this phase.
Phase 8 – Fear
Emotion causes investors to make mistakes. As the stock falls farther and farther investors feel more and more fear until they can not take the pain any more and sell the stock in disgust. As the stock approaches long term support it is often a bargain fundamentally and well informed investors will buy the stock at a bargain. As fear culminates in irrational selling, the stock is able to bounce off of long term support for a brief but often profitable trade. The Sentiment Stockscore will usually be below 20 but the stock will approach long term support levels that held up as a boundary on the trading range during the parking lot phase.
Keep these phases in mind when you look at any stock or market and use this long term cycle analysis to determine the appropriate Stockscores trading strategy.

Lately, many of the top performing, short term trades, have been in stocks that have pretty ugly looking charts. These are dogs that no one likes but, with some positive fundamental change, there is a quick rush to own them. When stocks are able to attract buyers against a lot of pessimism, they often make sharp, short term gains. This week, I highlight a couple of dogs that I have bought today. I don’t intend to hold them long, just enjoy the moment when these dogs get some attention.
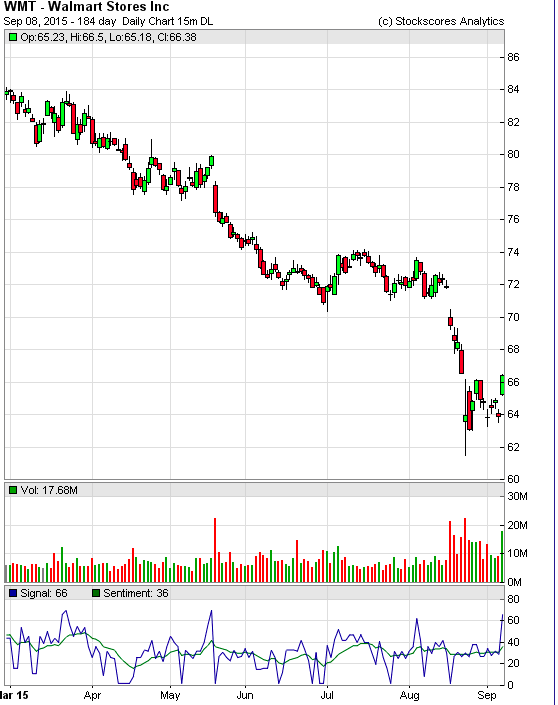
1. WMT
WMT has been in a parabolic sell off lately but the buyers came back to it today. I expect it will rally back up to its long term downward trend line, somewhere around $70.
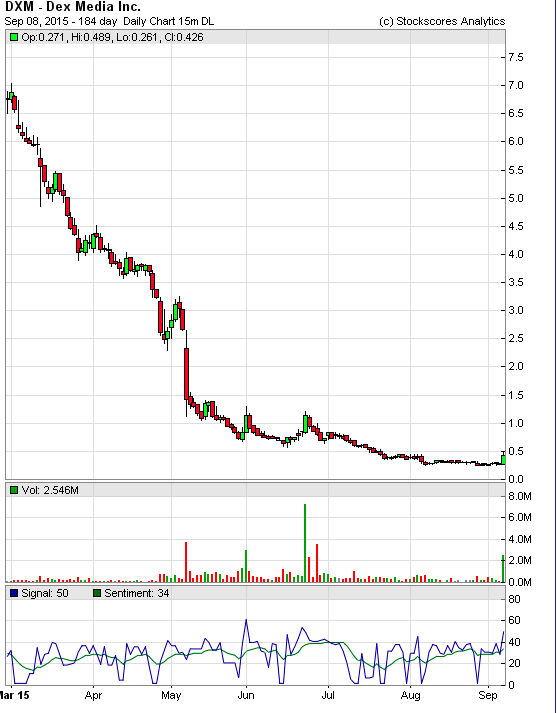
2. DXM
Shareholders of DXM have suffered miserably in 2015, the stock started the year over $8 and is now in the $0.40 range. Something has caught buyer interest today, however, as it is trading a lot more volume than normal and is up over 50% at the time I am writing it. I picked up this morning with the thought that it could rally back to $1 in the near term.
References
- Get the Stockscore on any of over 20,000 North American stocks.
- Background on the theories used by Stockscores.
- Strategies that can help you find new opportunities.
- Scan the market using extensive filter criteria.
- Build a portfolio of stocks and view a slide show of their charts.
- See which sectors are leading the market, and their components.
Disclaimer
This is not an investment advisory, and should not be used to make investment decisions. Information in Stockscores Perspectives is often opinionated and should be considered for information purposes only. No stock exchange anywhere has approved or disapproved of the information contained herein. There is no express or implied solicitation to buy or sell securities. The writers and editors of Perspectives may have positions in the stocks discussed above and may trade in the stocks mentioned. Don’t consider buying or selling any stock without conducting your own due diligenc


