
Energy & Commodities
Commodities and Emerging Markets have been crushed over the past 15 months by the dollar’s strong rally. It therefore follows that if the dollar starts down again, they are going to rally, and this will happen regardless of the state of economies. The dollar should start down again if the Fed fails to raise interest rates tomorrow, and maybe even if they do, as the ensuing chain of interest rate rises cannot extend far because of the magnitude of debt.
We have already seen how commodities have fallen steeply back to strong long-term support, where a cyclical low is likely to occur…

There was a surprise sharp rally in this commodity index late in August which was contained by resistance near to its falling 50-day moving average…

Commodities remain deeply unpopular with the normally wrong Rydex traders, as the following charts makes plain. In itself this is a positive sign for the sector…

This sharp rise in the commodity index was largely accounted for a sharp $10 rise in the oil price, which seemed to come “out of the blue” but was due to a combination of extreme negative sentiment and an announcement by the Saudis that they will scale back production. Both the commodity index and the oil price look have stalled out in recent weeks and backed off beneath their respective 50-day moving averages, but with the volume dieback in oil, the pattern in both is starting to look like a bull Flag/Pennant.

Meanwhile copper has firmed up, broken out of its downtrend and has gone on to break out above its 50-day moving average on strong volume, and is thus looking a lot more positive…

Emerging Market Chile, whose fortunes are highly dependent on the copper price, is showing signs of completing a skewed base pattern beneath its 50-day moving average. On its 6-month chart we can see a possible final low in August when a giant bull hammer occurred, followed by some large white candlesticks, with its Accum-Distrib line shown at the top of the chart advancing. This is positive action that points to a breakout above the 50-day moving average soon. Working this back it implies that copper will continue to improve, and that won’t happen unless commodities in general advance, and if they do, it means the dollar is set to drop. Working this in the opposite direction, it further means that gold and silver, which have been dragging their hind quarters along the ground like a dog with a problem, are also going to advance, and since no-one but a few die-hard battle scarred goldbugs expects that to happen, the rally in gold and silver will come out of left field, catch most everyone by surprise and be big and fast.

So we are going to keep a close eye on this in coming days, on the lookout for the first signs of a blistering recovery rally in gold and silver.


The Federal Reserve yielded to international pressure, making the very same mistake that it made during 1927. Back then, there was a secret meeting and the Fed agreed to lower U.S. rates to try to help Europe to deflect capital inflows back to Europe. The exact opposite unfolded in the aftermath when even more money abandoned Europe and flowed directly into the U.S. share market.

In 1927, the Fed lowered U.S. rates in the middle of an economic debt crisis, which is the same path taken today. It is very curious how history repeats. We have just witnessed the Fed yield to international pressure once again. In doing so, they are condemning the elderly and U.S. pension funds to financial doom by setting in motion the next financial crisis.
also from Martin:
Sovereign Debts: How Defaults May Unfold

You remember the old Smith Barney commercials, don’t you? The ones from the late 1970s, which starred John Houseman and his impeccable British accent?
The tagline: “They make money the old fashioned way. They eeeaarrrnnn it.”
Well, Morgan Stanley officially retired Smith Barney’s name a couple years ago. And Wall Street investors all but retired Smith Barney’s reputed approach as well.
Thanks to the Federal Reserve, Bank of Japan, European Central Bank and others around the world, investors gave up on doing much research, worrying about risk, or caring about real economic and corporate earnings news. They came to believe that kind of quaint, old-fashioned stuff was as outdated as the black and white TV Houseman’s ads used to run on in my house growing up!
But now, we’re in a whole new paradigm. We’re in an environment where Wall Street investors are going to have to eeeaarrrnnn their profits again because the tide is no longer rising, and lifting all boats. The great global flood of rising liquidity is draining, even with the Fed deciding to stand pat on interest rates this week. You can see the evidence showing up in everything from the junk bond to currency to commodities markets.
At the same time, volatility and risk indicators in bonds, in stocks and in money markets are on the rise. The major stock averages are starting to stumble, while tons of individual names are doing much worse than the indices. Bad news from the real world is increasingly intruding on the fantasyland environment Wall Street has been living in, causing consternation and worry the likes of which we haven’t seen in years.
 Many mainstream pundits haven’t caught on yet … which is typical. They’re comparing the recent market stumbles to the Flash Crash of spring 2010 and the Debt Ceiling debacle of summer 2011. But I disagree. Those were short-term corrections driven by esoteric, one-off events: A breakdown in market function (2010) and a political stalemate in Washington (2011).
What’s happening now looks to be both more severe and potentially longer-lasting. That’s because these moves stem from huge, underlying changes in the world economy and monetary policy rather than one-off trigger events. At the same time, the technical indicators I watch are flashing a much brighter shade of red now than they did back then.
Could I be wrong? Of course. It’s happened before and it’ll happen again.
But doesn’t it make sense to err on the side of caution?
Don’t you think that with so many warning signs out there, capital preservation becomes increasingly important?
Won’t you sleep better at night giving up some potential gains if I’m wrong, in exchange for dodging huge potential downside risks if I’m right?
I know my answers to those questions. I believe they’re the same ones John Houseman would talk about today if he were still alive. So I recommend you take them to heart when you decide what to do with your hard-eeeaarrrnnned money.
Until next time,
Mike Larson


Here are today’s videos and charts (double click to enlarge):
T-Bonds & US Dollar Shortsale Opportunity Video Analysis
Dow Industrials & Transports Video Analysis
Gold & Silver Trading Range Comparison Video Analysis
GDX, GDXJ, & GLDX Upside Rally Video Analysis
Swing Trade Charts Video Analysis
Key Precious Metal Stocks Upside Breakout Video Analysis
Here are some additional precious metal sector stocks that are sector leaders and laggards, with important price and volume action:
Key Precious Metal Stocks Versus GDX Video Analysis
Thanks,
Morris
| Friday, Sep 18, 2015 Super Force Signals special offer for Money Talks Readers: Send an email to trading@superforcesignals.com and I’ll send you 3 of my next Super Force Surge Signals free of charge, as I send them to paid subscribers. Thank you! |
The SuperForce Proprietary SURGE index SIGNALS:
25 Surge Index Buy or 25 Surge Index Sell: Solid Power.
50 Surge Index Buy or 50 Surge Index Sell: Stronger Power.
75 Surge Index Buy or 75 Surge Index Sell: Maximum Power.
100 Surge Index Buy or 100 Surge Index Sell: “Over The Top” Power.
Stay alert for our surge signals, sent by email to subscribers, for both the daily charts on Super Force Signals at www.superforcesignals.com and for the 60 minute charts at www.superforce60.com
About Super Force Signals:
Our Surge Index Signals are created thru our proprietary blend of the highest quality technical analysis and many years of successful business building. We are two business owners with excellent synergy. We understand risk and reward. Our subscribers are generally successfully business owners, people like yourself with speculative funds, looking for serious management of your risk and reward in the market.
Frank Johnson: Executive Editor, Macro Risk Manager.
Morris Hubbartt: Chief Market Analyst, Trading Risk Specialist.
website: www.superforcesignals.com
email: trading@superforcesignals.com
email: trading@superforce60.com
SFS Web Services
1170 Bay Street, Suite #143
Toronto, Ontario, M5S 2B4
Canada
For about the last year and a half I’ve been warning that gold was being driven down to test the last C-wave top ($1033). No one believed me.
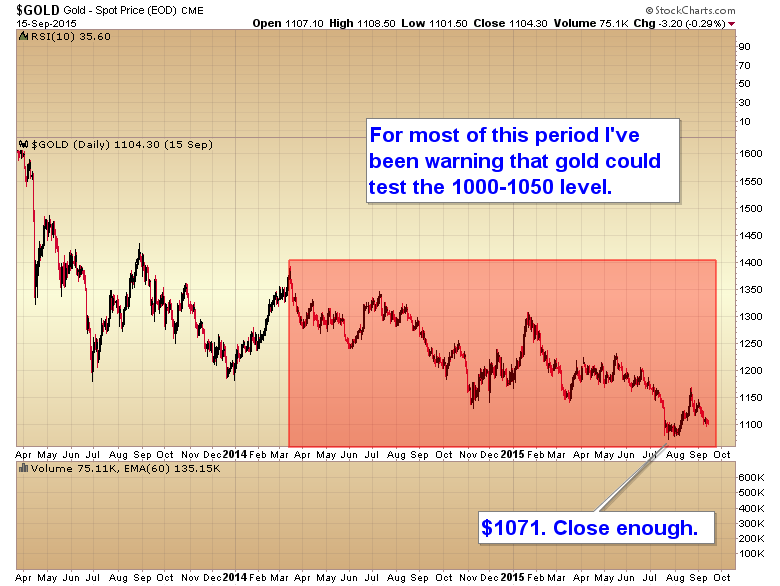
Now that the test has occurred it’s time to go the other way. Again no one believes me. Traders have become so conditioned to gold going down they can’t envision any scenario where it could possibly go up. And that is exactly the kind of sentiment that occurs at major trend changes. We saw the exact opposite sentiment at the stock market top several months ago. Right when I was warning everyone that the market was going to crash.
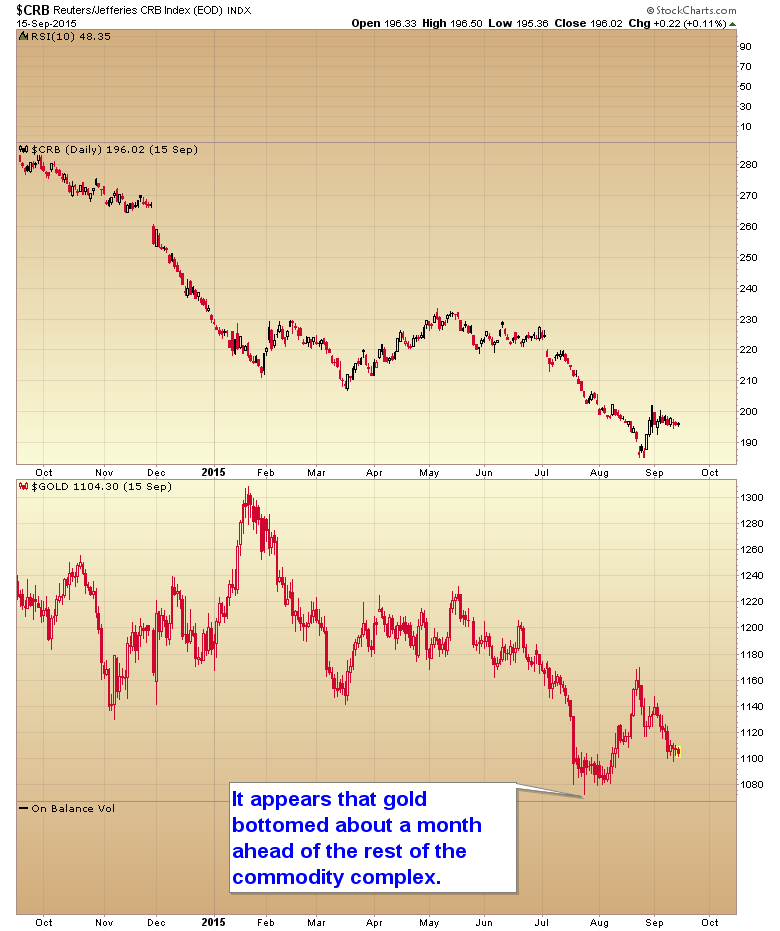
I’ve covered extensively the 3 year cycle low that is due in commodities this year, and posted numerous charts showing how I think it occurred last month. If the CRB has formed a major 3 year cycle low then I don’t expect gold would diverge from the rest of the commodity complex, and in fact it looks to me like gold bottomed about a month ahead of the general CRB.
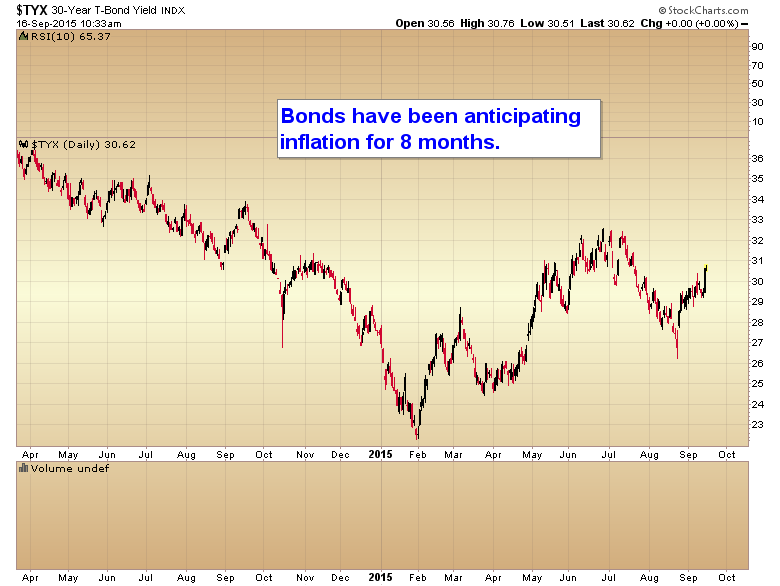
With all the talk of deflation bonds have been signalling inflation for almost 8 months now, but no one is paying attention.
Folks it’s time for some of the inflation that has been pouring into global stock markets for the last 6 years to start leaking out and moving into the commodity markets.
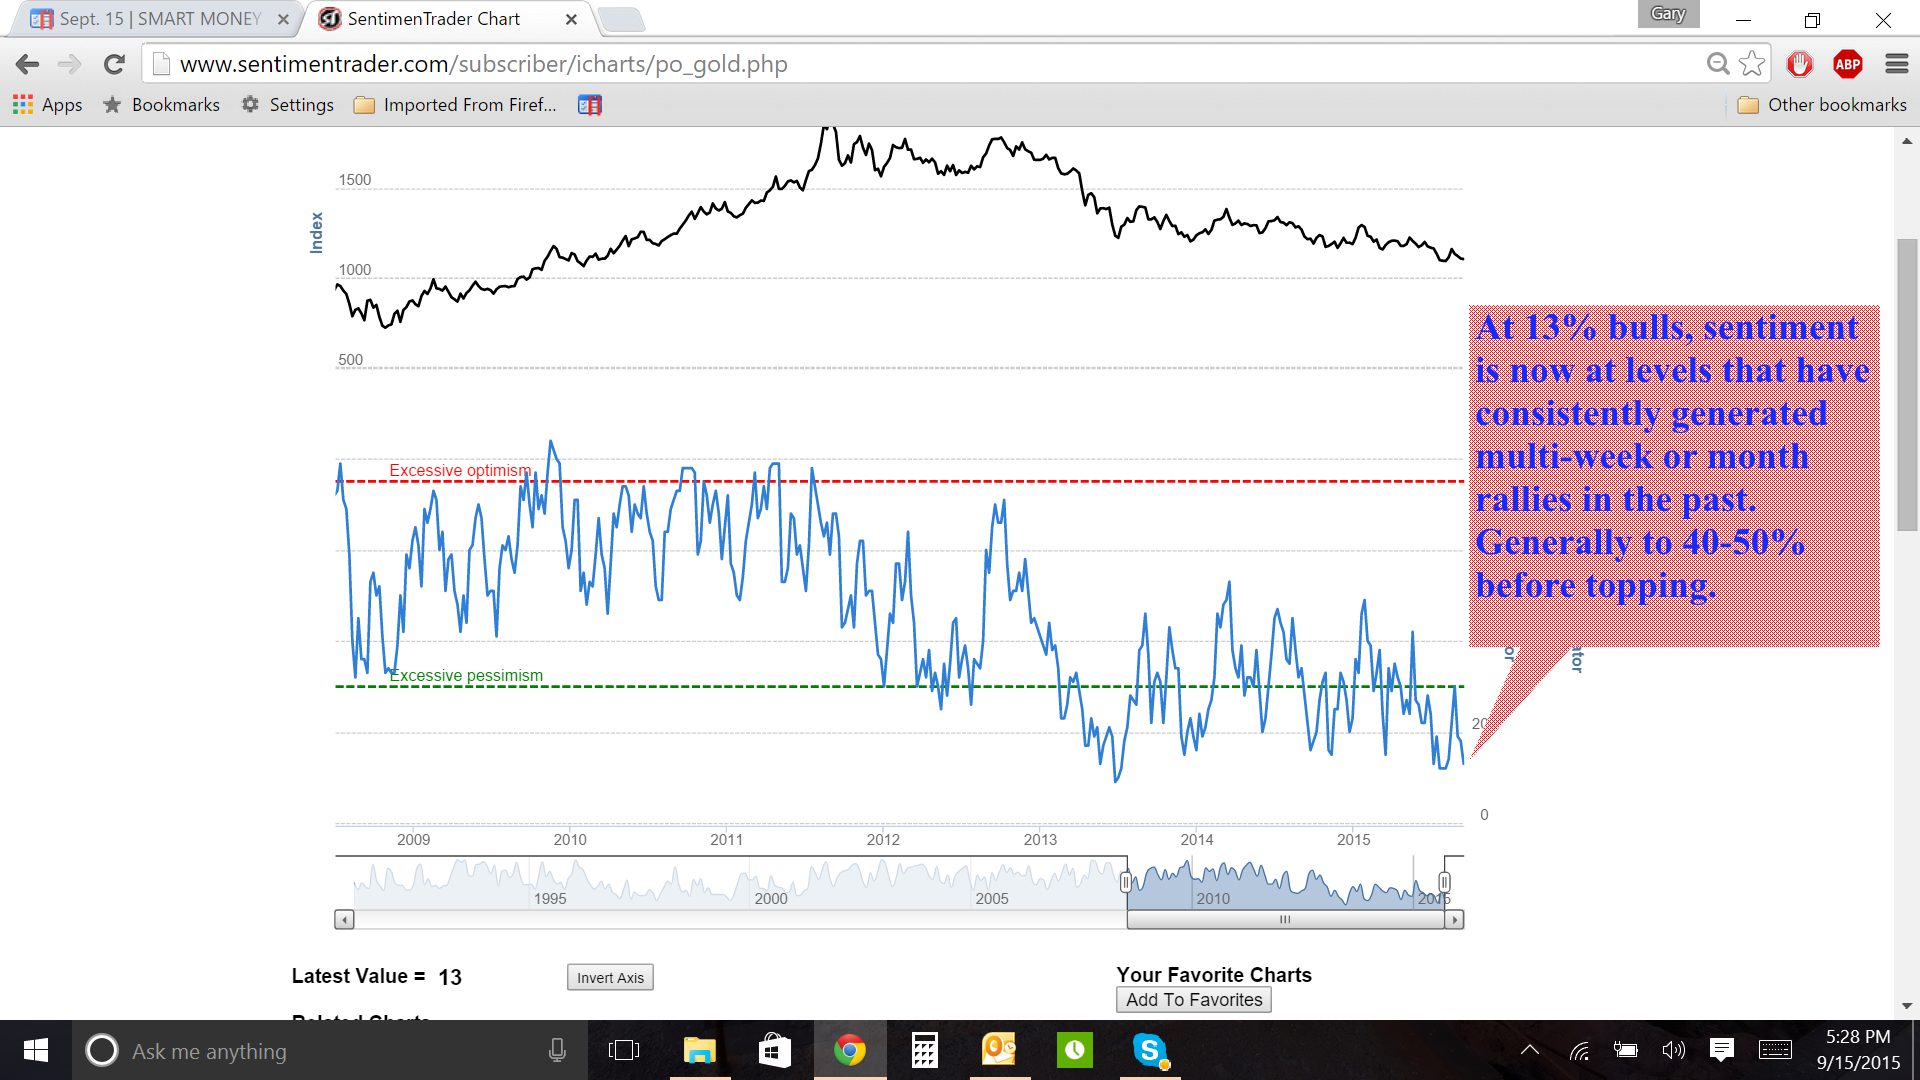
With gold confirming its daily cycle low today, and that low occurring well above the intermediate cycle low of July 24th, the metals are set up for a barn burner rally. And don’t forget that sentiment during the move down into the DCL has dropped all the way back to 13% bulls even though gold didn’t make a lower low. That’s means there it lots and lots of fuel to drive a very big rally during this second daily cycle.
This is your chance to get on board on virtually day 1 of a new daily cycle, and probably day one of a new cyclical bull market. If you are determined to be one of the 90% that are always on the wrong side of the market at major turns then just ignore this article. If on the other hand you want to change the old destructive habits and buy low for once then now is your chance.
And I’ll even sweeten the deal. Anyone who buys a yearly subscription to the SMT over the next 3 days I will refund your subscription price if miners don’t deliver at least a 20% rally over the next 2 months. ( I expect it will be double or triple that.) You could take $1000 and buy GDX and if you don’t have at least $1200 in 2 months then I’ll refund your purchase price back to you. That’s how strongly I feel that we are at a major inflection point right now. And I want as many people as possible to seize the opportunity before it passes.


-
I know Mike is a very solid investor and respect his opinions very much. So if he says pay attention to this or that - I will.
~ Dale G.
-
I've started managing my own investments so view Michael's site as a one-stop shop from which to get information and perspectives.
~ Dave E.
-
Michael offers easy reading, honest, common sense information that anyone can use in a practical manner.
~ der_al.
-
A sane voice in a scrambled investment world.
~ Ed R.
Inside Edge Pro Contributors

Greg Weldon

Josef Schachter

Tyler Bollhorn

Ryan Irvine

Paul Beattie

Martin Straith

Patrick Ceresna

Mark Leibovit

James Thorne

Victor Adair