
Asset protection
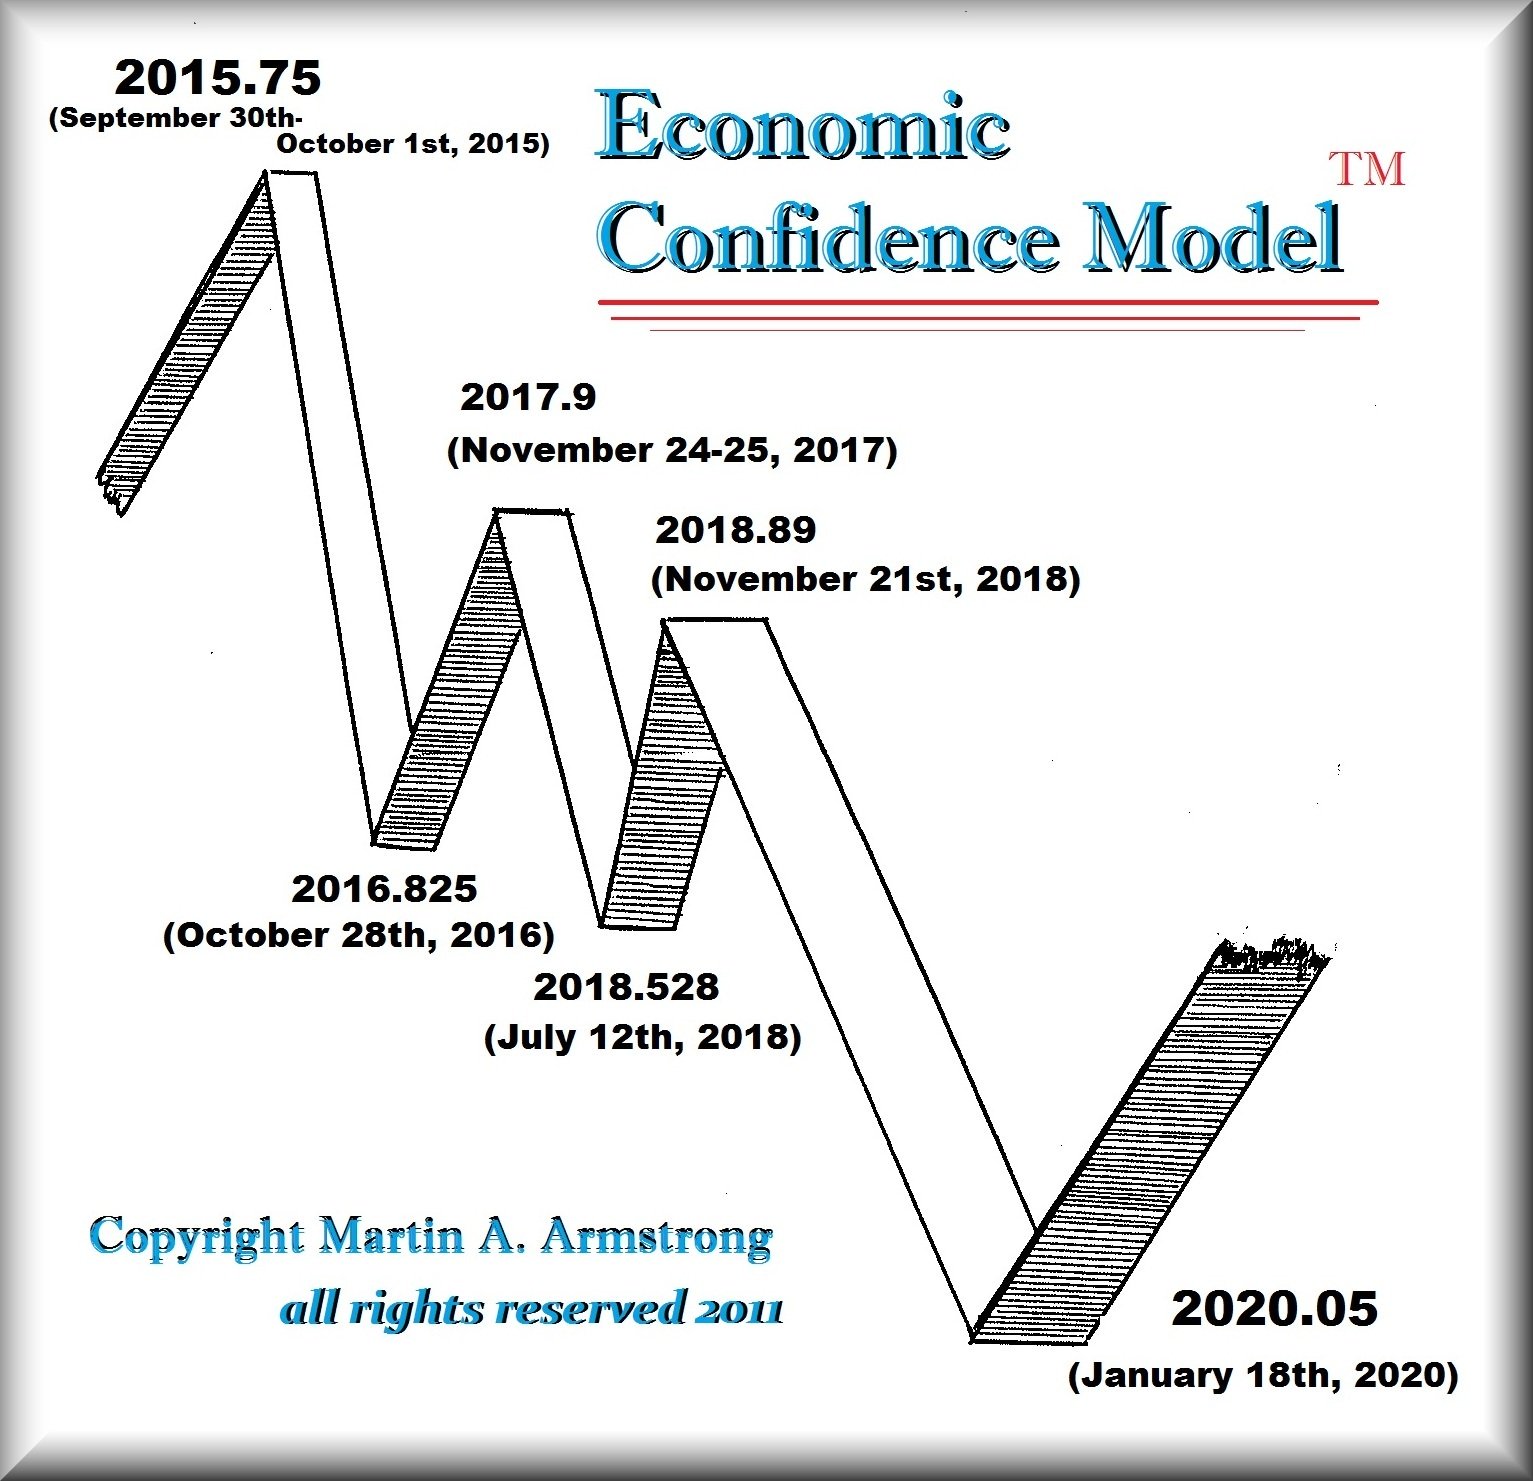
The unleashing of Russian firepower in Syria in support of the Syrian government came precisely on the day of the Economic Confidence Model. What I have come to learn from my observations of this model with world events, has been that whatever is the major focus, appears to line itself up with this model.

 September 30 (King World News) – Richard Russell: “For those of us who are hoping for the best for the US, (Monday) was a discouraging day. I’m seeing something I haven’t seen in years.”
Briefly: In our opinion, speculative long positions are favored (with stop-loss at 1,810, and profit target at 2,020, S&P 500 index)
Our intraday outlook is bullish, and our short-term outlook is bullish:
Intraday outlook (next 24 hours): bullish
Short-term outlook (next 1-2 weeks): bullish
Medium-term outlook (next 1-3 months): bearish
Long-term outlook (next year): bullish
The U.S. stock market indexes gained 1.5-2.4% on Wednesday, as investors hunted for bargains, following recent move down. The S&P 500 index bounced off support level at around 1,860-1,870, marked by late August low. The nearest important level of resistance is at 1,950, and support level is currently at 1,900. There have been no confirmed positive signals so far, however, we can see some positive technical divergences:

Expectations before the opening of today’s trading session are positive, with index futures currently up 0.6-0.8%. The European stock market indexes have gained 0.1-1.1% so far. Investors will now wait for some economic data announcements: Initial Claims at 8:30 a.m., ISM Index, Construction Spending at 10:00 a.m. The S&P 500 futures contract (CFD) trades within an intraday consolidation, following yesterday’s rebound. The nearest important level of resistance is at 1,930-1,950, marked by previous local highs. On the other hand, support level remains at 1,900, among others, as the 15-minute chart shows:

The technology Nasdaq 100 futures contract (CFD) follows a similar path, as it currently trades along the level of 4,200. The nearest important level of support is at 4,150, as we can see on the 15-minute chart:

Concluding, the broad stock market bounced off its medium-term support level yesterday, and the S&P 500 index broke above resistance level of 1,900. There have been no confirmed positive signals so far. However, we continue to maintain our already profitable speculative long position (1,881.90, S&P 500 index), as we expect an upward correction or downtrend reversal. Stop-loss is at 1,810, and potential profit target is at 2,020. You can trade S&P 500 index using futures contracts (S&P 500 futures contract – SP, E-mini S&P 500 futures contract – ES) or an ETF like the SPDR S&P 500 ETF – SPY. It is always important to set some exit price level in case some events cause the price to move in the unlikely direction. Having safety measures in place helps limit potential losses while letting the gains grow.
Thank you.

 In Part 1 of this article I discussed the catalyst spark which ignited this Fourth Turning and the seemingly delayed regeneracy. In Part 2 I pondered possible Grey Champion prophet generation leaders who could arise during the regeneracy. In Part 3 I will focus on the economic channel of distress which is likely to be the primary driving force in the next phase of this Crisis.
In this exclusive interview with Marcopolis.net Marc Faber covers it all: from commodities and China to the outlook on inflation, the Euro and gold. According to him the global economy is not healing. To the contrary, we might find ourselves back into recession within six months or a year. In that case he expects more money printing by central banks, which eventually could lead to high inflation rates and renewed strength in commodity prices. On the bright side, he sees great economic potential in Vietnam. Also, the Iraqi stock market has good potential now that a deal with Iran has been reached. While mining stocks are extremely depressed we might see defaults before any meaningful recovery.
Click HERE for Kondratieff explanation and a larger version of the chart (scroll down for the charts)


-
I know Mike is a very solid investor and respect his opinions very much. So if he says pay attention to this or that - I will.
~ Dale G.
-
I've started managing my own investments so view Michael's site as a one-stop shop from which to get information and perspectives.
~ Dave E.
-
Michael offers easy reading, honest, common sense information that anyone can use in a practical manner.
~ der_al.
-
A sane voice in a scrambled investment world.
~ Ed R.
Inside Edge Pro Contributors

Greg Weldon

Josef Schachter

Tyler Bollhorn

Ryan Irvine

Paul Beattie

Martin Straith

Patrick Ceresna

Mark Leibovit

James Thorne

Victor Adair