
Currency
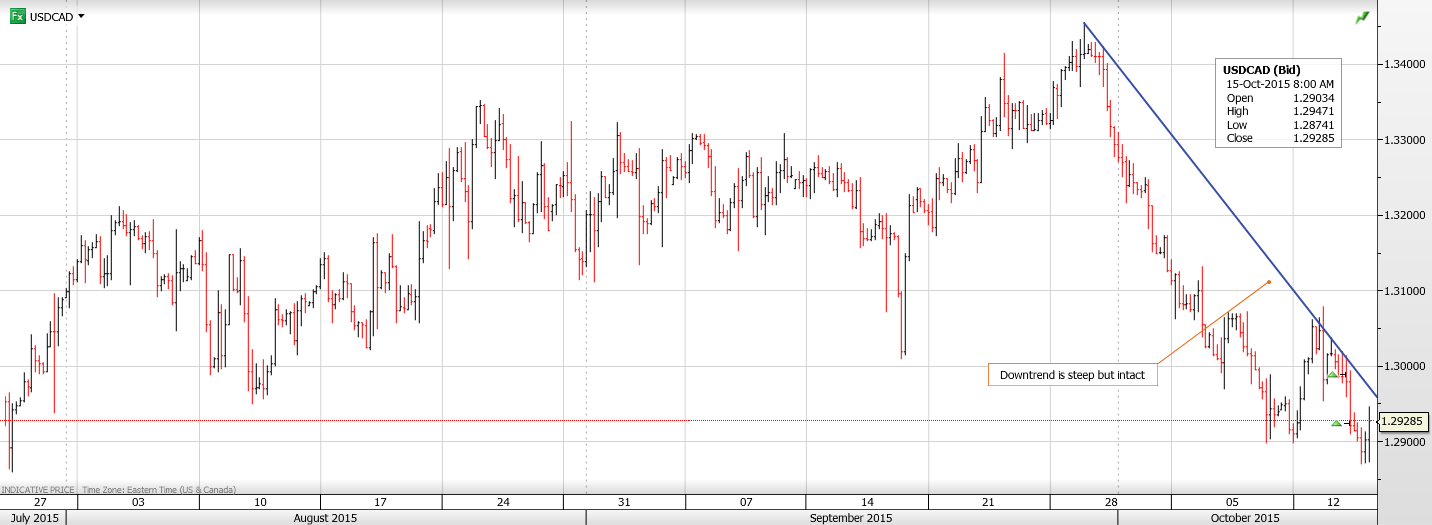
USDCAD Overnight Range 1.2875-1.2947
The US dollar attempted to rally following this morning’s ever so modest improvement in CPI (Core Actual 0.2% vs. forecast of 0.1% gain) and a small drop in Jobless claims. However the gains were short lived and the dollar sellers quickly returned.
Overnight, the story was the same except for the dollar rally part.
The Canadian dollar soared like Jose Bautista’s game winning seventh inning stretch, in another lively overseas FX market.
It started in Asia. The dollar continued to free-fall when Asian traders started their day, continuing the move at the end of the New York day. AUDUSD climbed despite weak employment data and renewed calls for a rate cut. Kiwi stayed bid while USDJPY headed lower even as the Nikkei rallied.
In Europe, EURUSD retreated from its peak on doveish talk from an ECB official even though his comments were nothing new.
USDCAD direction is tied to US dollar direction against the majors and right now that direction is down. US dollar bears cite falling US Treasury yields, long dollar squeeze, soft US data and the perception of US rate hikes being pushed well into 2016 for the selling.
The USDCAD drop is beginning to look overdone, especially considering that WTI prices are currently testing minor support at $4575, which if broken suggests a steeper decline tow the $44.00/barrel area.
USDCAD technical outlook
The intraday USDCAD technicals are bearish while trading below 1.2950 looking for a break of 1.2840 to extend losses to 1.2650. The move below 1.2900 broke both the 100 day moving average and the low following the July BoC rate cut. For today, USD Support is at 1.2875 (overnight low) 1.2840 and 1.2810. Resistance is at 1.2950 and 1.2980
Today’s Range 1.2875-1.2950
Chart USDCAD 4 hour with downtrend Larger Chart

Correcon Could End in October
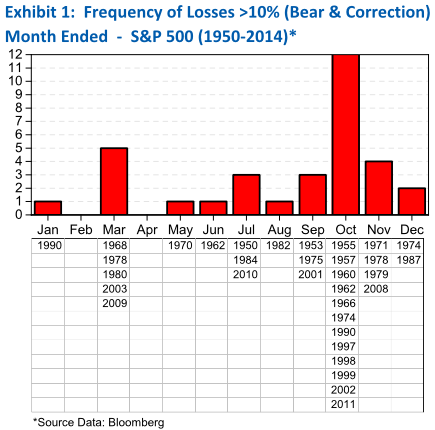
It is not a coincidence that the favorable six month cycle for stocks starts in late October (October 28th), and Octo- ber is the most frequent months for correcons and bear markets to be “killed,” and the stock market to rally. A cor- recon is defined as a decline of 10% to 19.9% and a bear market as a decline of 20%+.
Since 1950, the S&P 500 has had a total of 33 correcons of 10% or greater. Most of the declines were stopped in the second half of the year and by far, the most common month was October, which accounted for almost 1/3 of the correcons and bear market booms (Exhibit 1).
also:
October 2015 – Thackray Market Letter
The recent rally has been good, but getting past the old highs is going to be difficult.

| Wed. | Thu. | Fri. | Mon. | Tue. | Wed. | Evaluation | |
| Monetary conditions | 0 | 0 | 0 | 0 | 0 | 0 | 0 |
| 5 day RSI S&P 500 | 75 | 80 | 80 | 81 | 64 | 54 | 0 |
| 5 day RSI NASDAQ | 67 | 70 | 73 | 74 | 56 | 51 | 0 |
|
McCl-
lAN OSC.
|
+244 | +297 | +275 | +241 | +133 | +89 |
0
|
| Composite Gauge | 5 | 7 | 9 | 7 | 15 | 12 | 0 |
| Comp. Gauge, 5 day m.a. | 6.2 | 6.2 | 7.0 | 7.4 | 8.6 | 10.6 | 0 |
| CBOE Put Call Ratio | 1.09 | 92 | .86 | .92 | .89 | .96 |
0
|
| VIX | 18.40 | 17.42 | 17.08 | 16.17 | 17.56 | 18.03 | 0 |
| VIX % change | -5 | -5 | -2 | -5 | +9 | +2 | 0 |
| VIX % change 5 day m.a. | -5.6 | -5.0 | -4.0 | -3.6 | -1.6 | -0.2 | 0 |
| Adv – Dec 3 day m.a. | +1445 | +1210 | +1228 | +819 | -345 | -655 | + |
| Supply Demand 5 day m.a. | .81 | .78 | .69 | .67 | .61 | .48 | 0 |
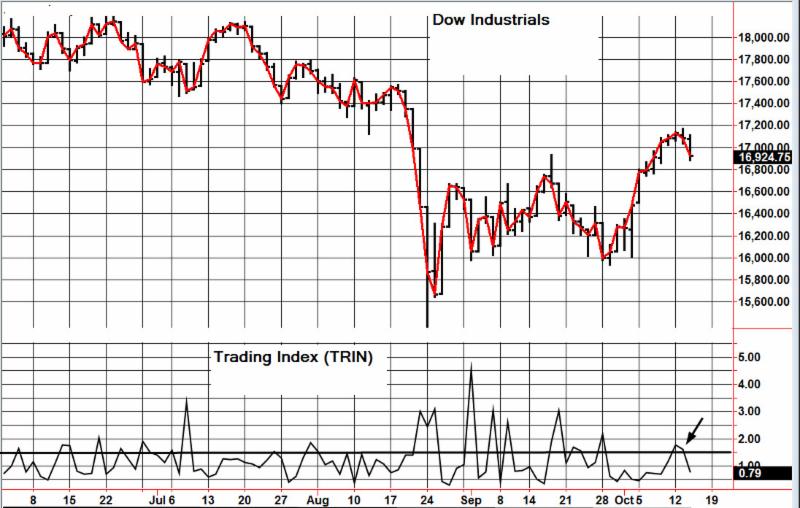
| Trading Index (TRIN) | .74 | .72 | 1.22 | 1.79 | 1.64 | .78 |
0
|
|
S&P 500
|
1996 | 2013 | 2015 | 2017 | 2004 | 1994 | Plurality +1 |

 “China has been busy buying up more oil because they are smarter than a 5th grader. They know that the USD will slip back because it always does, global economies are going to get stronger and everyone is going to be looking for anyone that is growing refinery capacity. That means at some point it’s not going to be about who can produce the most oil, but who has the most oil in hand to refine and produce commercial fuels for everyone. In effect, becoming the Tony Montana of oil.”
 The Government’s strange and awesome powers
Six years after the recession ended, we are due for another recession. Many experts say that the government is “out of bullets” to fight the next severe downturn. That’s quite false because 2008 marked the start of a new era in which our leaders manage the business cycles using strange and awesome tools. We’ll learn the long-term effects of these tools slowly, probably only decades later.
“All is not lost until you run out of airspeed, altitude, and ideas.” — Pilots’ wisdom.
….continue reading this interesting article HERE – Money Talks Editor

-
I know Mike is a very solid investor and respect his opinions very much. So if he says pay attention to this or that - I will.
~ Dale G.
-
I've started managing my own investments so view Michael's site as a one-stop shop from which to get information and perspectives.
~ Dave E.
-
Michael offers easy reading, honest, common sense information that anyone can use in a practical manner.
~ der_al.
-
A sane voice in a scrambled investment world.
~ Ed R.
Inside Edge Pro Contributors

Greg Weldon

Josef Schachter

Tyler Bollhorn

Ryan Irvine

Paul Beattie

Martin Straith

Patrick Ceresna

Mark Leibovit

James Thorne

Victor Adair