
Stocks & Equities
Read the entire StockScores Perspective Newsletter titled Measuring Your Trading Performance
STRATEGY OF THE WEEK
It is earnings season and this week is the busiest for announcements so there will be lots of action. If a company impresses investors with their announcement of earnings, the stock will often gap higher. These price gaps are a bit scary to trade because the distance down to support is far and that makes entry risky.
Often, these big gappers will pull back for a day or two after the big gap up and then resume their upward trend. This presents a great opportunity for the savvy day or swing trader who does not forget about the hot stocks of a few days ago. When stocks are hot on news, keep them on your watch list for a few days and wait for the echo, a break of a pull back after the gap. Here are two stocks that made big gaps in the last week and then went on to surge higher after a brief pause. These are not here for you to trade now, but as examples of what to watch for as other companies do the same thing on the heels of earnings news:
STOCKS THAT MEET THAT FEATURED STRATEGY
1. MSFT
MSFT sold off in to the close on Friday but broke that pull back this morning at around 10:22 and went for a good push up in to the close, giving the day trader a better than 3 to 1 reward for risk pay off. That means $1000 risked made over $3000 for the day.
 2. MCD
MCD is a stock that I shorted on the open after it gapped up on good news. I did not hold the position long as it soon stabilized and resumed its upward trend. Nice break of the pull back at around 10:30ET on Oct 22 that lead to a nice run over the next couple of days.


 In the next few weeks the banks may engineer another gold and silver smash, but silver prices will rise considerably in 2016 – 2020.
“Aaron’s analysis (along with others) shows that silver prices are in a technical position similar to late 2008. Silver prices climbed from under $9 in 2008 to nearly $50 in the subsequent 2.5 years.”
Retail silver is more difficult than usual to source. As they say, “the cure for low prices is low prices.” A shortage of physical silver shows up in higher premiums above the paper COMEX prices. There is no shortage of paper contracts for silver, which can be created in an instant with digital currencies created from nothing by a compliant central bank. Physical silver and gold are not so easily created and consequently can experience severe shortages. Prices for the real stuff will rise.

 A recent UBS study and other evidence show the importance of taking a shared approach to investing with your spouse. Want a happy relationship? We marry for love but we can often argue over money and may even separate because of it too…
The Evidence-Based Investor Video series is a service provided by Paul Philip and the team at Financial Wealth Builders Securities

Strengths
- Palladium was the best relative performing precious metal this week, recording a fall of just 0.27 percent. Palladium has been in a gentle decline post the Volkswagen story on emissions fixing, but rallied the last few days of this week.
- Gold traders are maintaining their bullish calls on the precious metal for the third week in a row. Of the 24 traders surveyed by Bloomberg, 13 hold a bullish outlook on gold.
- Gold got a boost this week as China announced further interest rate cuts and the ECB re-emphasized its pledge to use all the monetary tools at its disposal to support global growth. Furthermore, Russia boosted its gold purchases by the largest amount in a year throughout the month of September, adding 34 tonnes.
Weaknesses
- Silver was off 1.47 percent, making it the worst performing precious metal this week. Silver is normally more volatile than gold, so during a week that gold declines we should expect to see silver be pared back more so than gold.
- India has officially announced the implementation of its gold monetization scheme that is set to replace existing deposit structure. The plan seeks to reduce imports as banks will now be allowed to sell or lend gold to retailers, thus boosting supply if owners of the gold trust the system enough to lend their gold to the state.
- Argonaut Gold is facing some operation issues as an illegal blockade has formed at its El Castillo mine in Durango, Mexico.
Opportunities
- Investors are eyeing gold once again as $393 million flowed into U.S. precious metals-backed exchange traded funds this month, through October 20. After a multiyear downturn in the precious metal, more bulls are emerging. Retail investors have depleted coin dealer inventories of silver coins, Russia and China are buying gold, and even Paul Singer of Elliot Management said recently that investors should have up to 10 percent of their portfolio in gold and/or gold stocks.
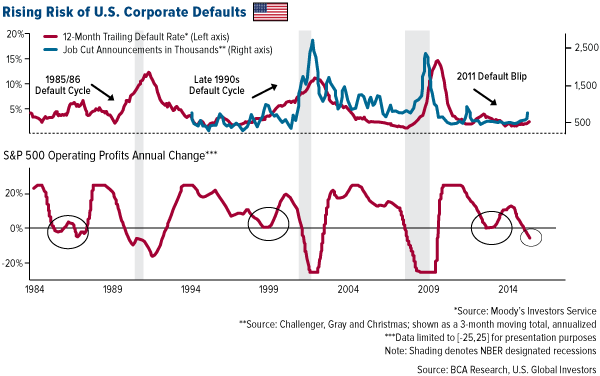
- The corporate sector could cause trouble for the U.S. economy as profits are contracting on a year-over-year basis. What’s more, every contraction in profits since 1980 has coincided with a rise in the corporate default rate. The default rate also closely correlates with job cut announcements.
- Overall, credit conditions for U.S. companies are already deteriorating as the 10-month span through this year has seen more S&P downgrades than the prior two years combined. Even more concerning is that these downgrades are not solely limited to the energy space. Challenger Gray noted that they are seeing layoffs at major firms at a level they have not witnessed since 2009.
Threats
- The largest hurricane the world has ever recorded could cause trouble for certain Mexican mining operators proximal to the Western coast. The third-quarter rainy season just ended, normally playing havoc with heap leach operations. Companies such as Primero, Alamos and Argonaut could be affected; potentially even Goldcorp or Agnico-Eagle, should the rainfall be intense.
- Goldman Sachs is expecting the Federal Reserve to hike rates in December and sees gold suffering as a result. The bank sees gold falling to $1,000 over the next 12 months.
- Faced with significant debt repayments, the Venezuelan government may tap into its gold reserves to generate sufficient cash. Venezuela dumping its gold could put negative pressure on global prices. Venezuela also made the news when the country notified Guyana Goldfields that its mine, which is nearly finished with construction, is on land claimed to be owned by Venezuela and not Guyana.

This chart series features an overlay of the Four Bad Bears in U.S. history since the market peak in 1929. They are:
- The Crash of 1929, which eventually ushered in the Great Depression,
- The Oil Embargo of 1973, which was followed by a vicious bout of stagflation,
- The 2000 Tech Bubble bust and,
- The Financial Crisis following the record high in October 2007.
The series includes four versions of the overlay: nominal, real (inflation-adjusted), total-return with dividends reinvested and real total-return.
The first chart shows the price, excluding dividends for these four historic declines and their aftermath. As of Friday’s close are now 2025 market days from the 2007 peak in the S&P 500.


-
I know Mike is a very solid investor and respect his opinions very much. So if he says pay attention to this or that - I will.
~ Dale G.
-
I've started managing my own investments so view Michael's site as a one-stop shop from which to get information and perspectives.
~ Dave E.
-
Michael offers easy reading, honest, common sense information that anyone can use in a practical manner.
~ der_al.
-
A sane voice in a scrambled investment world.
~ Ed R.
Inside Edge Pro Contributors

Greg Weldon

Josef Schachter

Tyler Bollhorn

Ryan Irvine

Paul Beattie

Martin Straith

Patrick Ceresna

Mark Leibovit

James Thorne

Victor Adair