
Energy & Commodities
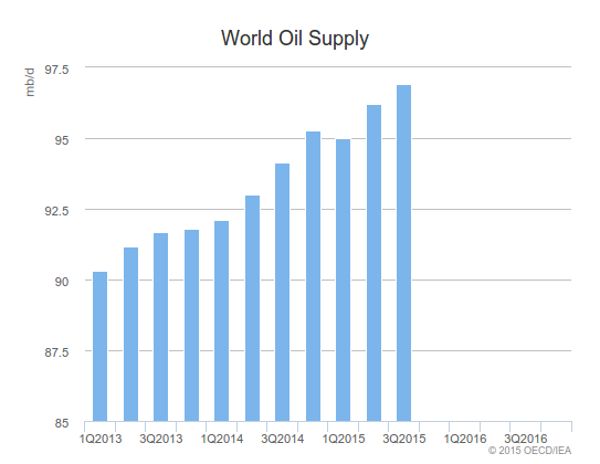
Part 1: The Crude Flood Cometh… and Taketh
What’s ahead for the oil market in 2016: rally or ruin?
Unfortunately, the answer to that question isn’t as easy as you might think.
Had you asked me a year ago, I wouldn’t have given it a second thought before telling you that it’s simply a matter of when production destruction would take place.
After all, the cure for low oil prices is low oil prices.
However, the problem is that even after 18 months of falling oil prices, we’re only now starting to see U.S. oil…

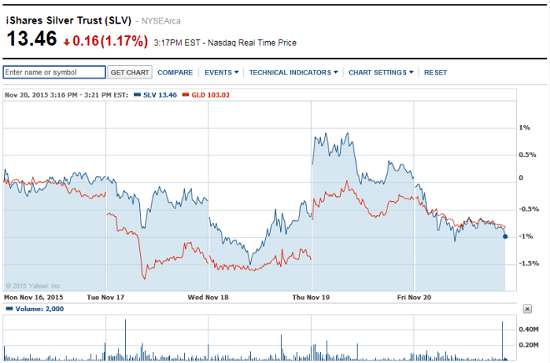
There are encouraging signs for the silver price in 2016…
Positive silver price action coupled with supportive news on the fundamental side are pointing to a possible end to the silver bear. Still, we’ll need to see some key technical price targets met before we can declare an outright return to a full-fledged silver bull.
To figure out what might lie ahead, let’s look at recent action and market news for silver prices…


Big Shock
The financial news continues to confound and confuse investors. The Fed is telling one story. The world economy is telling another.
The Fed is talking about increasing the federal funds rate – eventually getting rates back to “normal” – because the U.S. economy is so healthy. Meanwhile, the world heads toward deflation.
Says Ruchir Sharma, head of emerging markets and global macro at Morgan Stanley Investment Management:
We are now just one big shock away from a global downturn, and the next one seems most likely to originate in China, where heavy debt, excessive investment, and population decline are combining to undermine growth…
But it looks to us as though the global downturn is already here.
First, the Baltic Dry Index is at a record low. Here’s Bloomberg with the full story:
The cost of shipping commodities fell to a record, amid signs that Chinese demand growth for iron ore and coal is slowing, hurting the industry’s biggest source of cargoes.
The Baltic Dry Index, a measure of shipping rates for everything from coal to ore to grains, fell to 504 points on Thursday, the lowest data from the London-based Baltic Exchange going back to 1985.
And falling shipping costs aren’t the only sign of global deflation…
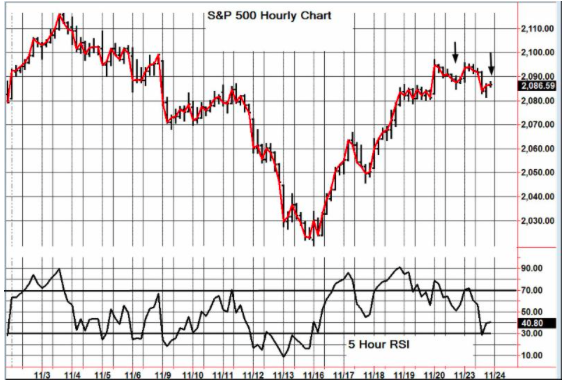
| Mon. | Tue. | Wed. | Thu. | Fri. | Mon. | Evaluation | |
| Monetary conditions | 0 | 0 | 0 | 0 | 0 | 0 | 0 |
| 5 day RSI S&P 500 | 43 | 41 | 62 | 56 | 65 | 62 | 0 |
| 5 day RSI NASDAQ | 37 | 37 | 61 | 61 | 68 | 67 | 0 |
|
McCl-
lAN OSC.
|
-109 | -132 | -38 | -30 | +4 | +10 |
0
|
| Composite Gauge | 5 | 12 | 5 | 11 | 8 | 11 | 0 |
| Comp. Gauge, 5 day m.a. | 12.8 | 13.0 | 11.2 | 10.0 | 8.0 | 9.2 | 0 |
| CBOE Put Call Ratio | .86 | .88 | 1.00 | .94 | .94 | 1.03 |
+
|
| VIX | 18.16 | 18.84 | 16.65 | 16.99 | 15.47 | 15.62 | 0 |
| VIX % change | -10 | +4 | -11 | +1 | -9 | +1 | 0 |
| VIX % change 5 day m.a. | +2.2 | +4.4 | +1.2 | -1.4 | -5.0 | -2.8 | 0 |
| Adv – Dec 3 day m.a. | -462 | -39 | +704 | +283 | +755 | +295 | 0 |
| Supply Demand 5 day m.a. | .39 | .26 | .45 | .47 | .55 | .43 | + |
| Trading Index (TRIN) | .48 | 1.30 | .34 | 1.15 | 1.51 | 1.35 |
0
|
|
S&P 500
|
2053 | 2050 | 2084 | 2081 | 2089 | 2087 | Plurality +2 |

Trading is Simple (But Not Easy)
This week, I ran the Stockscores Simple Weekly Market Scan. This strategy looks for stocks breaking from predictive chart patterns on the 3 year weekly chart. It is a great strategy for the longer term trader who only has 15 – 30 minutes a week to dedicate to checking the market. Found one good candidate this week:

-
I know Mike is a very solid investor and respect his opinions very much. So if he says pay attention to this or that - I will.
~ Dale G.
-
I've started managing my own investments so view Michael's site as a one-stop shop from which to get information and perspectives.
~ Dave E.
-
Michael offers easy reading, honest, common sense information that anyone can use in a practical manner.
~ der_al.
-
A sane voice in a scrambled investment world.
~ Ed R.
Inside Edge Pro Contributors

Greg Weldon

Josef Schachter

Tyler Bollhorn

Ryan Irvine

Paul Beattie

Martin Straith

Patrick Ceresna

Mark Leibovit

James Thorne

Victor Adair