

Todd Market Forecast for Monday November 23, 2015, 3:00 Pacific.
DOW – 31 on 150 net advances
NASDAQ COMP – 2 on 350 net advances
SHORT TERM TREND Bullish
INTERMEDIATE TERM TREND Bullish
STOCKS : Last week was the best one this year, so it’s not surprising to see a bit of a profit taking pullback. We like the fact that both of the above indices were down on positive breadth. That is usually a bullish development.
Know this about thanksgiving week. Since 1987, Wednesday through Friday has been higher 16 of 26 times for a total Dow gain of 659 points.
GOLD: Gold was down $8. Strength in the dollar was again given credit.
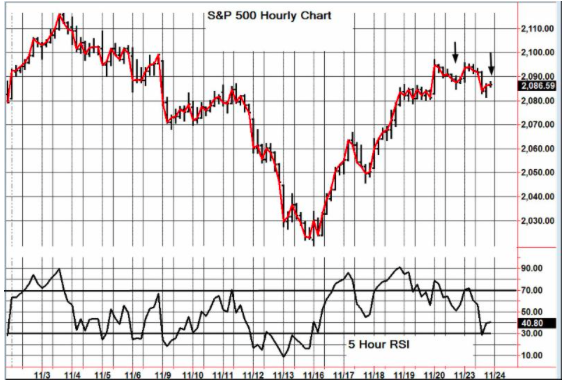
CHART: The S&P 500 hourly chart made a low below a previous low (arrows). It would be nice if this were to turn around on Tuesday. It does cause our antennae to rise.
BOTTOM LINE: (Trading)
Our intermediate term system is on a buy as of August 26.
System 7 We are long the SSO from 64.04. Stay with it on Tuesday.
System 8 We are in cash. Stay there.
GOLD We are in cash. Stay there.
News and fundamentals: The PMI Manufacturing Index Flash was 52.6, less than the expected 54.5. Existing home sales came in at 5.36 million, less than the expected 5.40. On Tuesday we get the second estimate of Q3 GDP, the trade gap, the Case Shiller Home Price Index and consumer confidence.
Interesting Stuff : I have noticed that the novice can often see things the expert overlooks. —-Tom Peters.
TORONTO EXCHAN GE: Toronto lost 51.
S&P/TSX VENTURE COMP: The TSX gained 1
BONDS: Bonds rose again.
THE REST: The dollar was higher. Silver and crude oil were both down.
Bonds –Bullish since November 12.
U.S. dollar –Bullish since October 22.
Euro — Bearish since October 22.
Gold —-Bearish since October 19.
Silver—- Bearish since October 21.
Crude oil —- Bearish since November 11.
Toronto Stock Exchange—- Bullish since August 27.
S&P\ TSX Venture Fund — Bullish since August 27.
We are on a long term buy signal for the markets of the U.S., Canada, Britain, Germany and France.
| Mon. | Tue. | Wed. | Thu. | Fri. | Mon. | Evaluation | |
| Monetary conditions | 0 | 0 | 0 | 0 | 0 | 0 | 0 |
| 5 day RSI S&P 500 | 43 | 41 | 62 | 56 | 65 | 62 | 0 |
| 5 day RSI NASDAQ | 37 | 37 | 61 | 61 | 68 | 67 | 0 |
|
McCl-
lAN OSC.
|
-109 | -132 | -38 | -30 | +4 | +10 |
0
|
| Composite Gauge | 5 | 12 | 5 | 11 | 8 | 11 | 0 |
| Comp. Gauge, 5 day m.a. | 12.8 | 13.0 | 11.2 | 10.0 | 8.0 | 9.2 | 0 |
| CBOE Put Call Ratio | .86 | .88 | 1.00 | .94 | .94 | 1.03 |
+
|
| VIX | 18.16 | 18.84 | 16.65 | 16.99 | 15.47 | 15.62 | 0 |
| VIX % change | -10 | +4 | -11 | +1 | -9 | +1 | 0 |
| VIX % change 5 day m.a. | +2.2 | +4.4 | +1.2 | -1.4 | -5.0 | -2.8 | 0 |
| Adv – Dec 3 day m.a. | -462 | -39 | +704 | +283 | +755 | +295 | 0 |
| Supply Demand 5 day m.a. | .39 | .26 | .45 | .47 | .55 | .43 | + |
| Trading Index (TRIN) | .48 | 1.30 | .34 | 1.15 | 1.51 | 1.35 |
0
|
|
S&P 500
|
2053 | 2050 | 2084 | 2081 | 2089 | 2087 | Plurality +2 |
INDICATOR PARAMETERS
Monetary conditions (+2 means the Fed is actively dropping rates; +1 means a bias toward easing. 0 means neutral, -1 means a bias toward tightening, -2 means actively raising rates). RSI (30 or below is oversold, 80 or above is overbought). McClellan Oscillator ( minus 100 is oversold. Plus 100 is overbought). Composite Gauge (5 or below is negative, 13 or above is positive). Composite Gauge five day m.a. (8.0 or below is overbought. 13.0 or above is oversold). CBOE Put Call Ratio ( .80 or below is a negative. 1.00 or above is a positive). Volatility Index, VIX (low teens bearish, high twenties bullish), VIX % single day change. + 5 or greater bullish. -5 or less, bearish. VIX % change 5 day m.a. +3.0 or above bullish, -3.0 or below, bearish. Advances minus declines three day m.a.( +500 is bearish. – 500 is bullish). Supply Demand 5 day m.a. (.45 or below is a positive. .80 or above is a negative). Trading Index (TRIN) 1.40 or above bullish. No level for bearish.
No guarantees are made. Traders can and do lose money. The publisher may take positions in recommended securities.


