
Bonds & Interest Rates
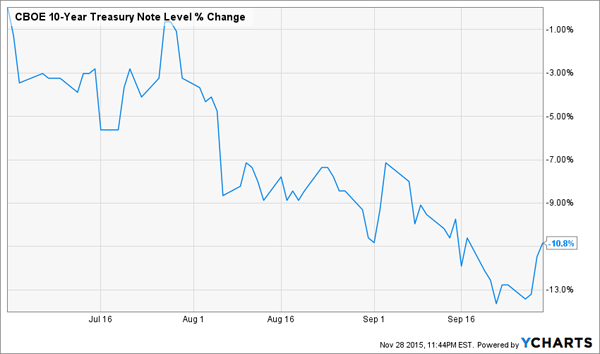
Worried that rising rates are going to hurt some of the bonds you own? A 0.5% – 1% move would be plenty big to pancake many bonds.
As I write to you on this first Wednesday of December, traders are handicapping a 78% probability that the Fed will boost rates in two weeks. Overall they’re projecting a half-percent increase between now and June. And renowned government insider Goldman Sachs is a bit more aggressive – it’s projecting a full percentage point of tightening.
So if you’re worried that Goldman Sachs could be right, you’d better move some of your fixed-rate bond money into “floating-rate” issues.

“Don’t ever take a fence down until you know why it was put up.” ~ Robert Frost
We have seen the same song sung over and over again by the Doctors of Doom; the markets are going to crash, the world is going to come to an end, or some other pretentious title. Let’s cut to the chase, the markets are not going to crash; they could experience a strong correction at some future date but that would just present you with another opportunity to buy quality stocks. Could the markets crash? That is a possibility, but you could kick the bucket before the event plays out the way the naysayers have envisioned. In fact, one could go as far as to state that there has never been a real market crash in the true sense of the word and that every so-called crash event was nothing but a buying opportunity in disguise. Crash or correction is a matter of perspective and that perspective depends on where you boarded the train; if you got in towards the end of the ride, then it will certainly feel like a crash. We will examine this concept in more detail in a follow-up article.
Less than two months ago a lot of fuss was made about the death cross formation on the Dow; we immediately repudiated that nonsense and stated the Dow would continue to trend upwards. Fast Forward and the Dow followed the projected course. Now some professors are stating that all is not well with the NYSE and that it is signalling a massive breakdown in the markets. With the advent of Quantitative easing and an ultra low rate environment that has been artificially maintained for an inordinate amount of time, many technical indicators ceased to function normally. As the environment had changed and the Fed had eliminated all semblance of free market forces, the laws of the jungle came into play; adapt or die. It is hot money that is powering this market and it is hot money that will continue to power this market, much to the anguish of the naysayers. The bull market will end one day but that day is not yet upon us. We do not believe that the NYSE Index is signalling impending disaster; at most it is signalling that another correction could be in the works, with extremely strong emphasis on the word “could“.
Let’s take a look at long term chart and see what it’s implying.
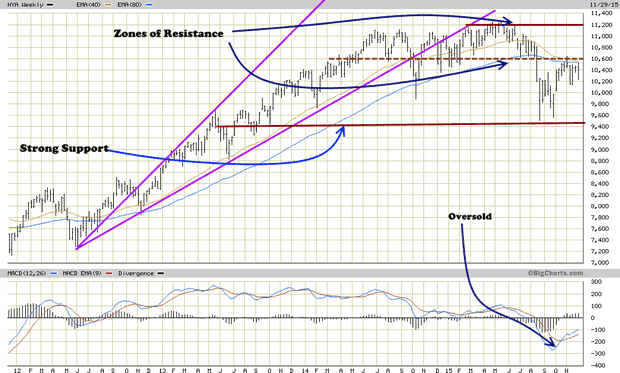
There is a strong layer of support that comes into play in the 9450-9500 ranges. It would take a monthly close below this level to indicate lower prices. Even in the off chance this did occur, the astute investor will view it for what it is and view it as opportunity knocking in disguise. However, don’t place all your eggs in one basket and hope for this target to be hit. For now, it is a low probability target, unless Turkey and Russia suddenly decide to go to war.
The inability of the NYSE to trade above 10,700 on weekly basis, suggests further downside testing and a possible retest of the October lows. The NYSE is building momentum to take out the 11,200 ranges and eventually put in a series of new highs. Overall the expectation is for the NYSE to be trading higher next year.
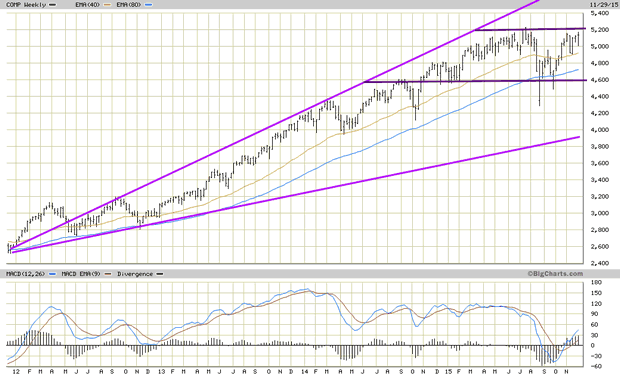
The NASDAQ is already trading well of its lows and is dangerously close to taking out its old highs. As this is the most speculative index out of all the major indices, it suggests that this trend is likely to continue, as there is still a large percentage of individuals sitting on the sideline. Our analysis indicates that there are currently more individuals sitting in the neutral camp than in either the bullish or bearish camps. Neutrality equates to fear, you sit out because you don’t know what to expect and markets love to climb a wall of worry. Despite trading dangerously close to its highs, the MACDS are still trading in the oversold ranges, validating that there is more upside to this market.
In what light should you view the dire warnings coming from the Professors of doom? Dump these warnings of doom into the nearest dustbin and move on. Our game plan is to view every pullback as a buying opportunity. What is your game plan?
“I can stand brute force, but brute reason is quite unbearable. There is something unfair about its use. It is hitting below the intellect.” ~ Oscar Wilde

 The path of rate hikes by the US Fed and how their policy diverges from their fellow G7 nations continues to be heavily debated and will be one of the foremost important themes for the global economy in 2016.
There is no question the decision makers at US Fed sit between a rock and hard place. A report out of the Financial Times at the end of last week revealed more than a trillion dollars in US corporate debt has been downgraded so far this year. This represents a 72 per cent jump in the total value of US debt that was downgraded in the first 11 months of 2014. Much of the story is related to the energy picture and US companies that face declining revenues with weaker commodity prices, but also linked is the fear and pressure created from higher interest rates from the path of Fed rate hikes.


Last week we had Draghi surprising the market. Everyone was expecting QE to be increased by the ECB. Instead, all Draghi did was extend the present QE for at least another year and probably indefinitely. Of course interest rates then went from negative 02 percent to negative 0.3 percent. And they still cannot create any inflation in Europe…continue reading HERE

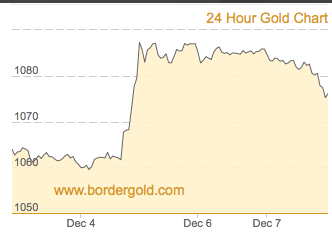
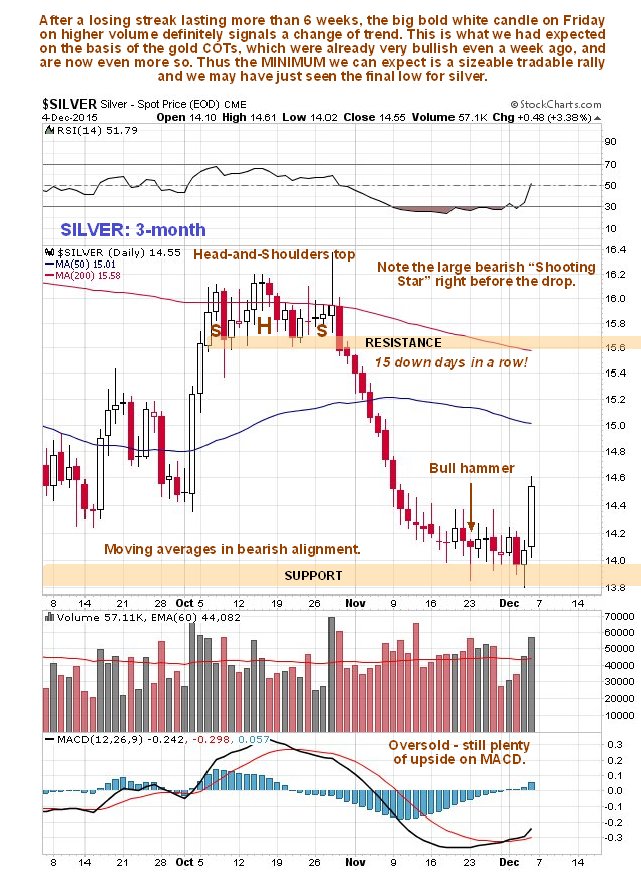
Silver broke out with gold on Friday, following an extraordinary plunge in the dollar on Thursday. On its 3-month chart we can see that the ground had been well prepared for this move, with an intermediate base pattern having formed above support for about 3 weeks prior to the breakout. The preceding persistent decline included an extraordinary 15 days down in a row. There were various indications of an impending upside breakout, including the appearance of a bull hammer at the support and a bullish cross by the MACD indicator above its moving average, the large gap with moving averages, and, in the background, silver’s COT was improving and gold’s COT had become remarkably bullish by last week.

-
I know Mike is a very solid investor and respect his opinions very much. So if he says pay attention to this or that - I will.
~ Dale G.
-
I've started managing my own investments so view Michael's site as a one-stop shop from which to get information and perspectives.
~ Dave E.
-
Michael offers easy reading, honest, common sense information that anyone can use in a practical manner.
~ der_al.
-
A sane voice in a scrambled investment world.
~ Ed R.
Inside Edge Pro Contributors

Greg Weldon

Josef Schachter

Tyler Bollhorn

Ryan Irvine

Paul Beattie

Martin Straith

Patrick Ceresna

Mark Leibovit

James Thorne

Victor Adair